. 2023 Mar 21;33(7):3636-3650.
doi: 10.1093/cercor/bhac297.

Site-dependent shaping of field potential waveforms

Affiliations

Site-dependent shaping of field potential waveforms

Oscar Herreras et al. Cereb Cortex. .

Abstract

The activity of neuron populations gives rise to field potentials (FPs) that extend beyond the sources. Their mixing in the volume dilutes the original temporal motifs in a site-dependent manner, a fact that has received little attention. And yet, it potentially rids of physiological significance the time-frequency parameters of individual waves (amplitude, phase, duration). This is most likely to happen when a single source or a local origin is erroneously assumed. Recent studies using spatial treatment of these signals and anatomically realistic modeling of neuron aggregates provide convincing evidence for the multisource origin and site-dependent blend of FPs. Thus, FPs generated in primary structures like the neocortex and hippocampus reach far and cross-contaminate each other but also, they add and even impose their temporal traits on distant regions. Furthermore, both structures house neurons that act as spatially distinct (but overlapped) FP sources whose activation is state, region, and time dependent, making the composition of so-called local FPs highly volatile and strongly site dependent. Since the spatial reach cannot be predicted without source geometry, it is important to assess whether waveforms and temporal motifs arise from a single source; otherwise, those from each of the co-active sources should be sought.

Keywords: FP sources; LFPs; network oscillations; source mixing; volume conduction.


Figures

Fig. 1
Fig. 1
FPs with contributions from various sources add/subtract their temporal traits in a site-dependent manner. The upper panel depicts two dipolar sources (S1 and S2) and multisite recording arrays (r1–r3) covering a portion of the space nearby. The dipoles represent synaptic inputs to two different neuron populations with different dynamics (left). Middle: All sources produce field potentials (FPS1, FPS2) that decay in amplitude over a distance. Note that the temporal structure is maintained at all positions for the FPs of each source. Bottom: Since potentials add linearly in a volume conductor, when the two sources are co-activated (traces in red) the time course of the original sources is lost and the resulting FP pattern (FPS1 + S2) varies at different sites according to the relative distance to each of them. At some sites, it resembles one of the original sources but at others, the blending results in the disappearance of the traits identifying the original sources. Note that single-site recordings cannot provide the number, position or temporal features of the co-activating sources.
Box 1
Box 1
The neuron morphology and synapse location determine the amplitude of extracellular currents and potentials. During synaptic activation, electrical current traverses neuronal membranes twice (arrowheads), once as active (ionic) current through discrete points in the synapses, and once as return current to the extracellular space (ES). For illustration, panel “a” shows the currents during activation of an excitatory synapse. As the currents propagate inside, they leak out through the membrane capacitance (red arrowheads), so it will be the width of the dendrites and the branching pattern that determine how much leaks out close to the synapse, and therefore cancels with inward current there, and how much goes out far from it. In the diagram, the membrane patches where intense cancellation of inward and outward currents occurs is represented by squares. Zones where net current is inward or outward are called sinks or sources, respectively, and jointly form extracellular dipoles of current. These promote extracellular current to close the loop (curved arrows). Thus, knowing the 3D morphology of a neuron helps predicting if synaptic currents will manage to create source/sink dipoles in the ES and thus contribute to FPs. The cancellation of inward and outward currents in small volumes around the synaptic zone is minimized when synapses are located on a thick primary dendrite (a) so that returning currents separate maximally from active ones in the ES, but reduced when they are located on secondary oblique dendrites (b). Cancellation is much more pronounced in the cell body (c), because the large size and surface provides easy path for return currents at the same ES level of active currents. (d) The co-activation of multiple synapses in neurons with multipolar morphology also maximizes cancellation of inward and outward currents in cell-size volumes (dots represent microscopic sources and sinks). (e) Similarly, addition or cancellation between sinks and sources takes place when they arise from different neurons. Thus the buildup of multineuronal (mesoscopic) dipoles is facilitated in cases of homogeneous activation of spatially grouped excitatory synapses in aligned neurons (e1–2), and reduces as synapses are dispersed over the dendrite or when they are located in secondary oblique dendrites (e3–4). The net sources and sinks in the ES behave as layered blocks or sheets of current (red/blue bands) with spatially variable charge density and simplified geometry (e2, e4). This facilitates biophysical processing towards estimating the amplitude and extent of the associated FPs (bottom row). The spatial distribution of FPs can be well derived from the general geometry of a source/sink combination (thereafter referred to generically as source), and users should try to visualize them as concentric isopotential spheroids around it without a pre-set boundary (Supplementary Video 1). It is essential to remind that electric fields extend beyond the physical limits of the source, which makes the spatial distribution of FPs less intuitive (Box 2). Panels e and f show the partition of the ES into positive (redish) and negative regions (bluish) at an arbitrary isopotential level for the activation of a single (e) or a group of synapses (f). As for currents, the location of the synapse on a main (1) or a secondary oblique dendrite (2), or in a tapering dendrite (3) determines the relative size and location of the respective positive and negative zones and whether they coincide at a similar spatial level or they are separated. Larger FPs arise when activated synapses are clustered at distal (f1) compared to middle (f2) dendritic segments, which has great relevance for stratified synaptic pathways. However, disperse synapses (f3) lead to maximal mutual cancellation of positive and negative potentials (compare proportional spatial plots of FP amplitude at f4). The ability of different cytoarchitectonic elements to generate FPs are summarized in g; red: location and grouping of synapses; green: cell morphology; blue: arrangement of neurons. All of these factors are limiting, therefore, all must be favorable to allow mesoscopic buildup of FPs.
Fig. 2
Fig. 2
Different dynamics of a single upstream population produce different FP waveforms. Although variable FP waveforms are expected from the mix of sources, a single source can also produce varying waveforms. The diagrams at the top show the shaping of waveforms by varying the timing of the spikes in the afferent neurons (vertical strokes): 1–2, full synchrony; 3–4, increasing the temporal dispersion. Note that the amplitude depends on both the synchrony and the number of elementary inputs (black traces). Only full synchrony preserves the waveform of the elementary inputs. 5, different upstream spiking regimes give rise to very diverse FP motifs. The lower traces correspond to Schaffer-specific FPs in a real experiment, which may produce gamma oscillations and sharp-wave events.
Box 2
Box 2
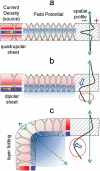
Architectonic factors promoting the far reach of FPs. One might expect an FP to fall towards zero from the source, and the rate of decay to be proportional to the amplitude at the origin. However, neither of these is correct. The amplitude of the FPs within the limits of the source population does not define whether or to what extent they will spread to other structures. This is a transcript of Coulomb’s law, according to which there are no spatial limits for the electric field generated by charged particles. Therefore, since the sources and the sinks that form an extracellular dipole are neither regular nor uniform, the strength and rate of decay of the combined field they create varies in different directions depending on how each is located relative to each other. The 3D geometry and density can be very complex. Some general principles can be derived from the activation of orderly populations, which can help in more complex cases. In palisade-arranged populations of neurons (e.g. cortex and hippocampus), in which principal cells meet the criteria for generating large FPs (Box 1), it is the location of the afferent pathway in the dendritic tree which determines whether it also extends far in volume. Thus, inputs to distal dendrites tend to generate mesoscopic dipoles (dipole sheets) that promote far reaching of associated FPs away from source neurons, whereas inputs to middle dendritic segments lead to a configuration of quadrupole (sandwich-shaped), whose FPs tend to “stay” local (compare diagrams a and b). Even though the amplitude of the LFPs may be equivalent for the two input locations, the rate of decay is much more pronounced when the active (synaptic) layer that accumulates a strong sink is surrounded by sources from both sides (see spatial profiles on the right), as if it were shielded. The red circle in b indicates the far reach of the FPs away from the source population. Another common architectural configuration in the brain is that of folded layers of cells. The curvatures thus formed cause remarkable effects when combined with activation in distal dendritic segments (c). Thus, even when individual cells produce the same configuration of currents, the amplitude of FPs on the concave side of such cell arrangement exceeds several times the achieved in the synaptic layer itself, while it decreases somewhat on the convex side. This can be understood considering that, on average, the individual sinks are much closer to any site in the concave region than they would be in a parallel arrangement. This also calls for caution when using the maximum voltage (white arrows) as a marker of source location: it may not even be close.
Fig. 3
Fig. 3
Site-dependent waveforms in LFPs are caused by the mixing of partially co-localized sources. (A and B). The diagrams show schematically the effect of source geometry on the FP waveforms along a recording track (e1–e5) covering positions in and near the sources. These are depicted as colored blocks on neuron dummies, and the extent denotes the size of the population and dendritic domain that is coherently activated. Colored waveforms are generated by each of the two sources alone (green and orange) or when co-activated (blue). Different dynamics for the sources have been chosen to facilitate visual discrimination of temporal traits: In (A), the sources arise from inputs in the same dendritic domain; and in (B), they are in adjacent domains of the same population. Rows 1 and 2 show the waveforms from two sources of identical extension, and in row 3, they have different extensions. Co-activation always results in site-dependent waveforms, although different sets are obtained for different geometrical configurations and dendritic position of the sources. For simplicity, only one polarity is used. (C) Example of co-localized sources rising site-dependent LFPs in real experiments. The laminar profile corresponds to a slow cortical wave (S1) with superimposed spindle-like oscillations (S2). The two sources extend through different portions of the cortical column (colored bars to the right). Since the slow wave also has fast fluctuations (see the time course in the blue trace at the bottom), their mixing with waves produced by the spindle source that have different phase and a varying power along the cortical column renders strong site-dependent waveforms. The characteristic signature of multisource contribution is the dissimilar profile exhibited by contiguous waves. The superposition of FP waves in sites e1–e7 reveals large variations in the amplitude, start/end-times and total duration (green arrow), and peak phase in different sites and from wave to wave.
Fig. 4
Fig. 4
Site-dependent waveforms caused by the mixing of potentials from far and nearby sources (volume contamination). (A) Schematic analysis of the FP obtained near a source (S1, local) to which site potentials also arrive from another distant (contaminating) source (S2). Note the fast decay of the FPs for the local source (green) and the constant amplitude of the remotely generated ones (orange). Similar waveforms have been chosen for the two sources and a slight delay (Δt) has been allowed to indicate independence. The effect of the remote source is to add waveforms with a constant voltage to all sites near the local source, whose waves show a steep decay. When the local and remote sources have the same polarity, the blend of FPs (S1 plus S2, in blue) shows a slower decay rate and changes in waveform parameters at different sites (samples at bottom are normalized for comparison). When they have opposite polarity (S1 minus S2), the site-dependent waveform differences are much more marked. (B) Numerous site-dependent waveform changes can be observed when similar local waves blend to remote ones of varying amplitude, polarity, phase, duration or start time. The degree of site-dependent alterations is more marked when the remote FPs are stronger (1) and less perceptible when they are weaker (2) (relative power indicated in the respective spatial curves to the right). (C) Experimental example illustrating one such combination of near and far theta sources in the cortex (V2) and hippocampus (CA1). The multisite recording covers both regions, so which is close and which is local depends on the site inspected. Both structures can show genuine theta generators that coincide at certain epochs. The cortical FP generator is called slow cortical oscillation (SCO) as it normally shows such waves. Independent component analysis was used to get the correct time course on each (blue and green traces at top), which helped reveal the correct wave parameters at the sources. The colored boxes indicate epochs when the cortical (SCO) and hippocampal theta waves have different phases. Theta FP propagation in each territory produces a variety of site-dependent wave parameter distortions, such as amplitude modulation, dephasing, and even annihilation, affecting specific sites according to the strength of each generator in a given position (check, for example, the sites marked in red or blue ovals in the voltage profiles to the right). (C) Modified from Torres et al. 2019.
Fig. 5
Fig. 5
Site-dependent waveform alterations and other phenomena arising from mixing nearby oscillatory sources of similar frequency. Such cases are common for gamma sources in the cortex and hippocampus. (A) Theoretical analysis (numerical simulations). Note the different distortions that occur at different recording times and positions, including frequency doubling (red shadow epoch), polarity reversal (green and cyan waves), and inconsistent phase shift of waves over time and space (vertical strokes). In (B), the result at a single position is described over a longer period, allowing the phase shift to cycle. A curious amplitude modulation appears as if there are two sources with nested frequencies (the slower one is spurious) that resembles theta-gamma coupling. (C and D) Experimental example of gamma sources mixing in the DG. GCs behave as radially oriented dipoles when activated from the entorhinal cortex at a gamma frequency (C). Gamma oscillations blend in the Hilus (red curved lines), invading area CA3, which also generates gamma oscillations. The latter have a limited spread (green ovals) because the synaptic locus causes these cells to act as quadrupoles. In (D), laminar FPs are shown (black traces) containing multiple sources of gamma activity spanning the CA1 and DG/CA3 regions. The time course of the untangled sources is shown in colored traces. These allow the waves arising from a specific source or a mixture of different sources to be identified and the shape and phase of each to be determined. For example, waves 1, 2 and 6 belong to the CA3 source, while waves 4 and 6 arise from a DG source. It also helps to understand site-specific waveforms, such as wave 3 that has distorted waveform as it rides on top of a slower larger wave from the GD source. (C and D) Modified from Benito et al. (2014).

References

    1. Andersen P, Bliss TVP, Skrede KK. Lamellar organization of hippocampal excitatory pathways. Exp Brain Res. 1971:13:222–238. - PubMed
    1. Arieli A, Sterkin A, Grinvald A, Aertsen A. Dynamics of ongoing activity: explanation of the large variability in evoked cortical responses. Science. 1996:273:1868–1871. - PubMed
    1. Bédard C, Destexhe A. Macroscopic models of local field potentials and the apparent 1/f noise in brain activity. Biophys J. 2009:96:2589–2603. - PMC - PubMed
    1. Bédard C, Kröger H, Destexhe A. Modeling extracellular field potentials and the frequency-filtering properties of extracellular space. Biophys J. 2004:86:1829–1842. - PMC - PubMed
    1. Bell A, Sejnowski T. An information-maximization approach to blind separation and blind deconvolution. Neur Comp. 1995:7:1129–1159. - PubMed

Publication types