. 2022 Oct 3;132(19):e157649.
doi: 10.1172/JCI157649.

TDO2+ myofibroblasts mediate immune suppression in malignant transformation of squamous cell carcinoma

Affiliations

TDO2+ myofibroblasts mediate immune suppression in malignant transformation of squamous cell carcinoma

Simeng Hu et al. J Clin Invest. .

Abstract

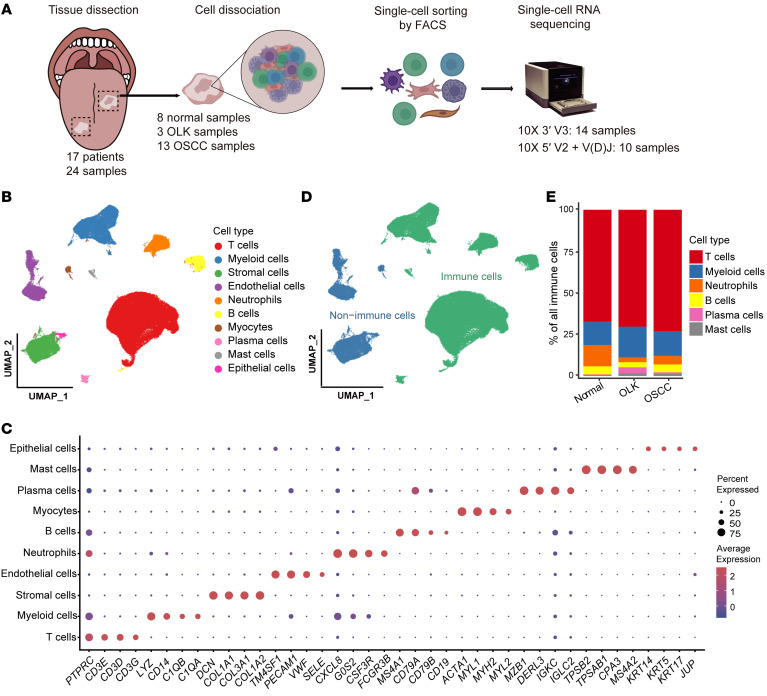
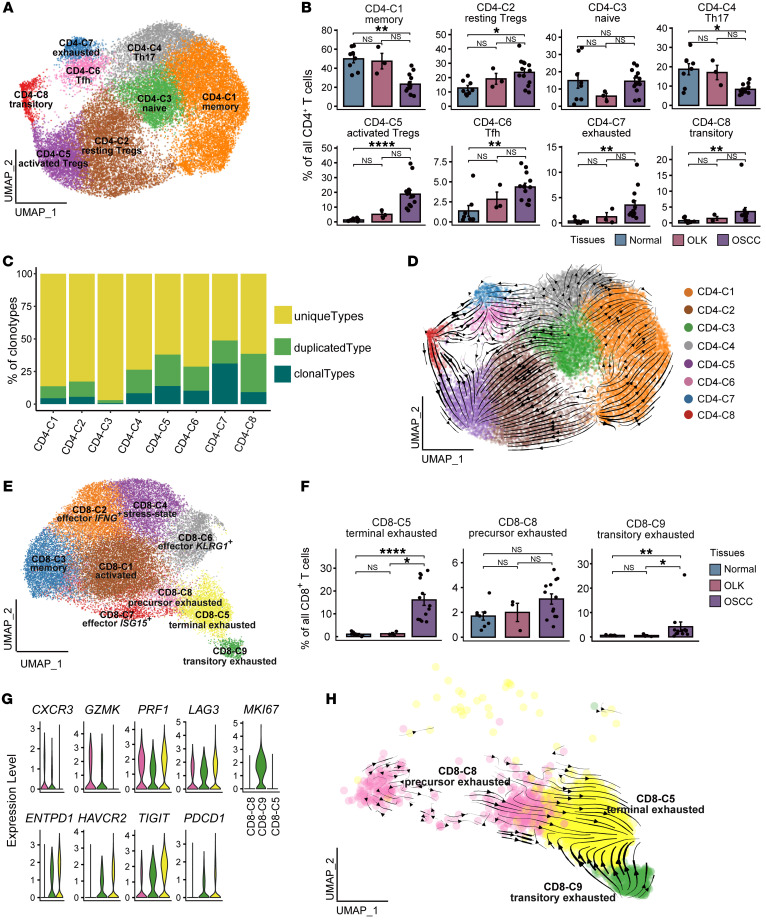
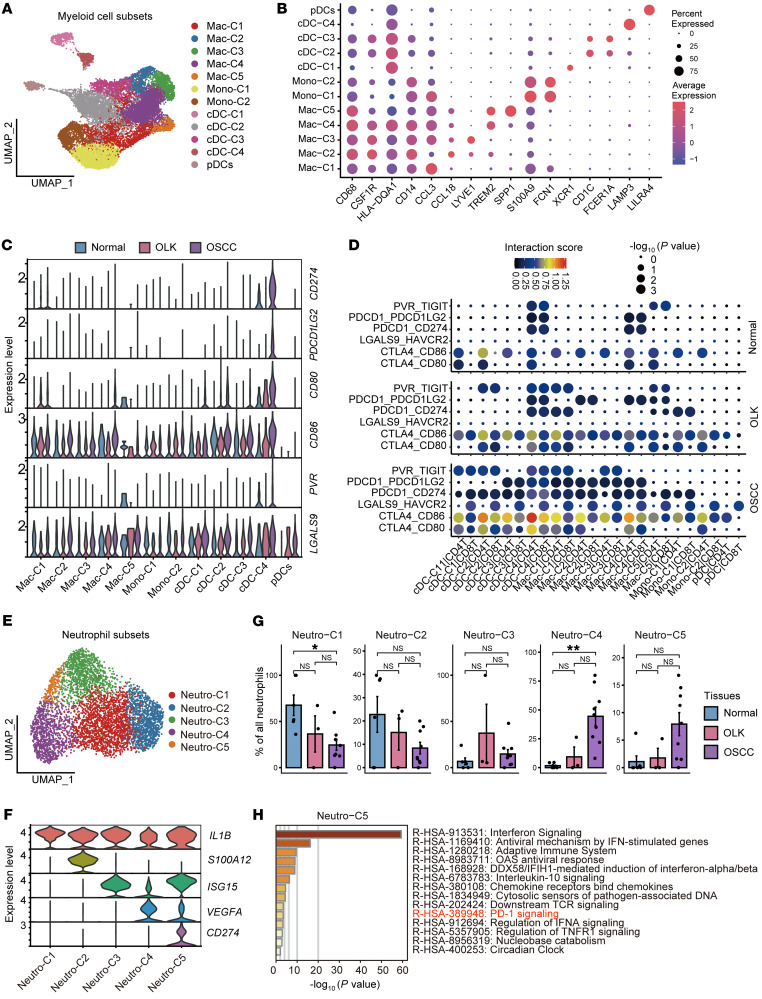
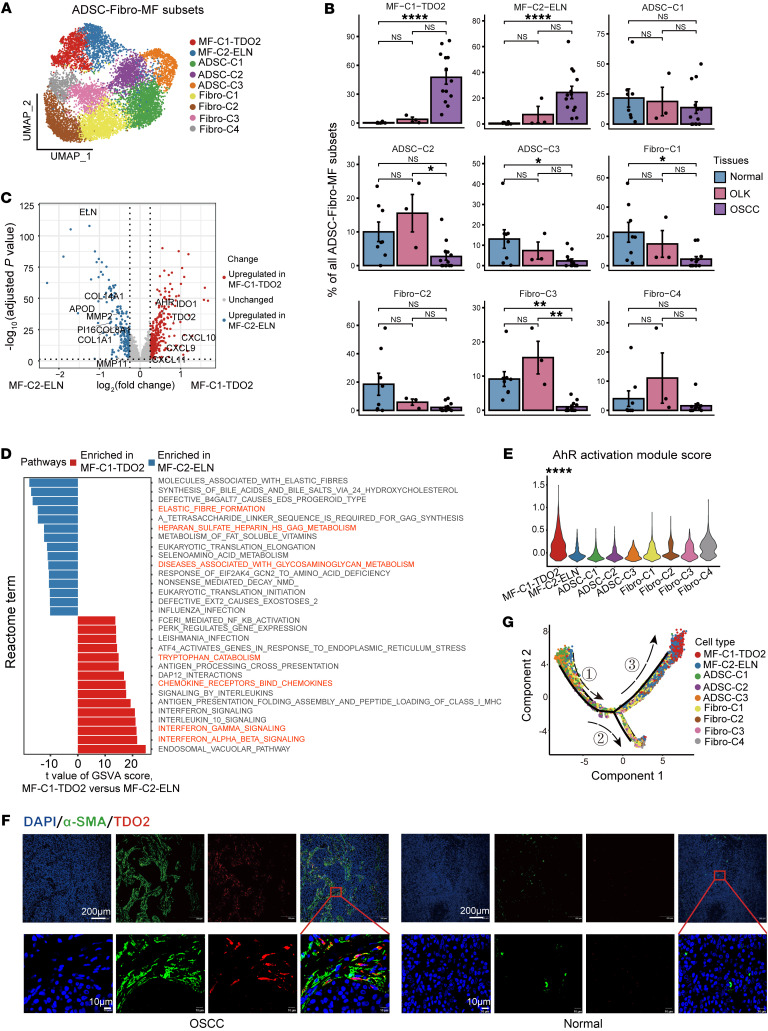
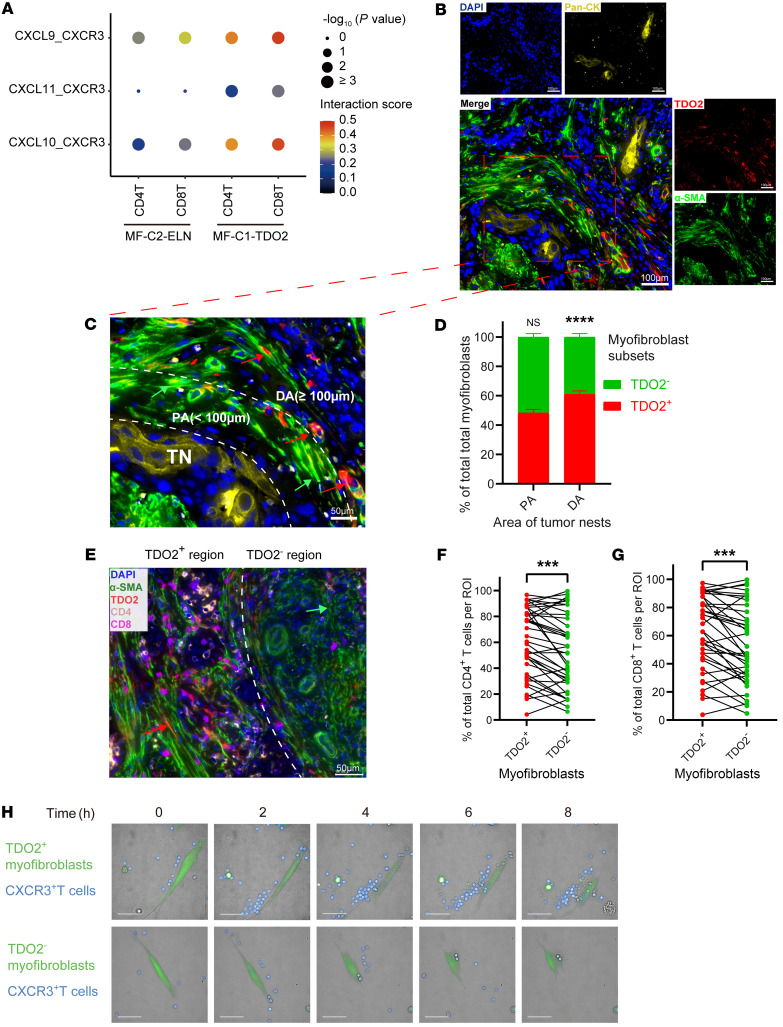
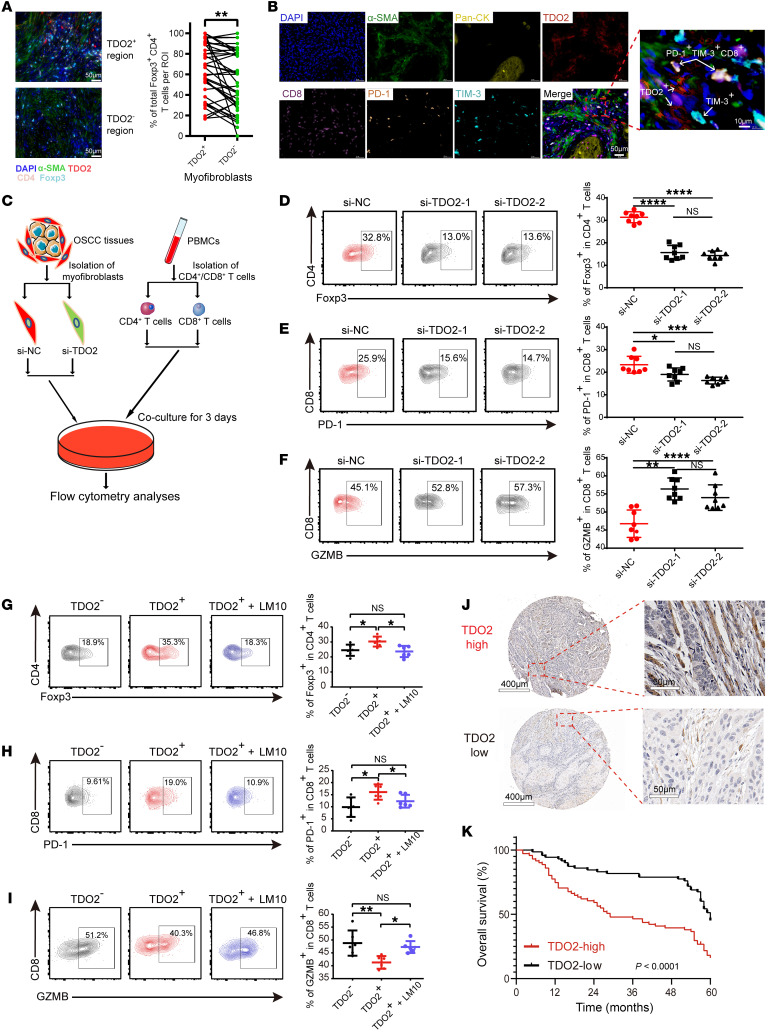
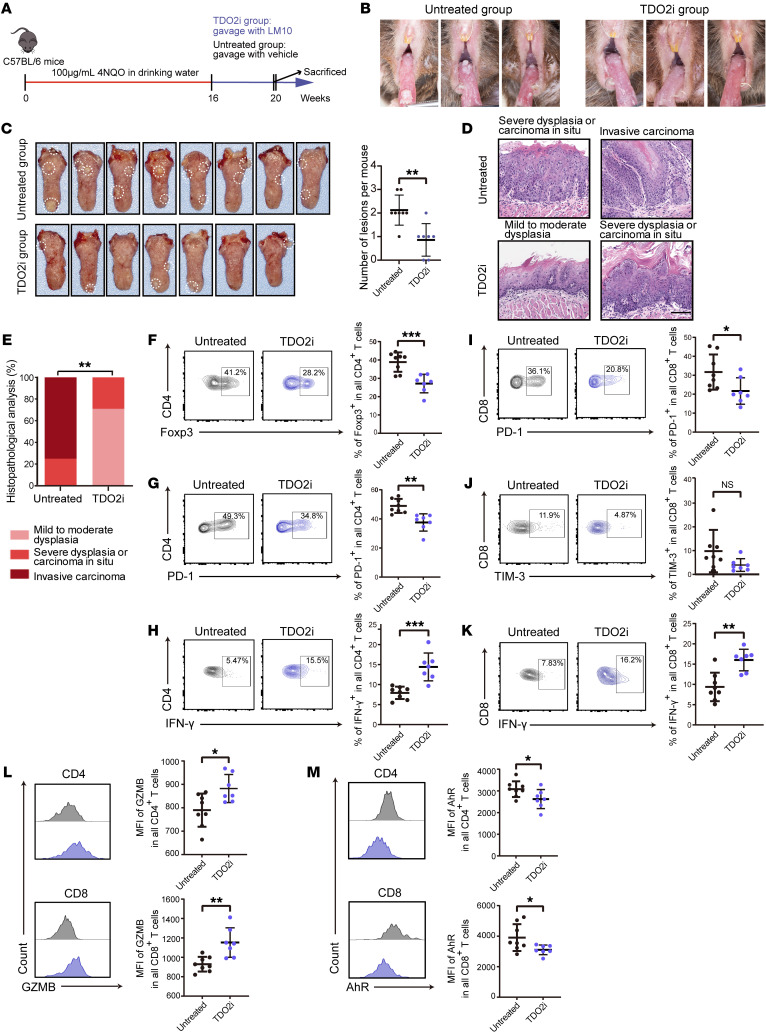
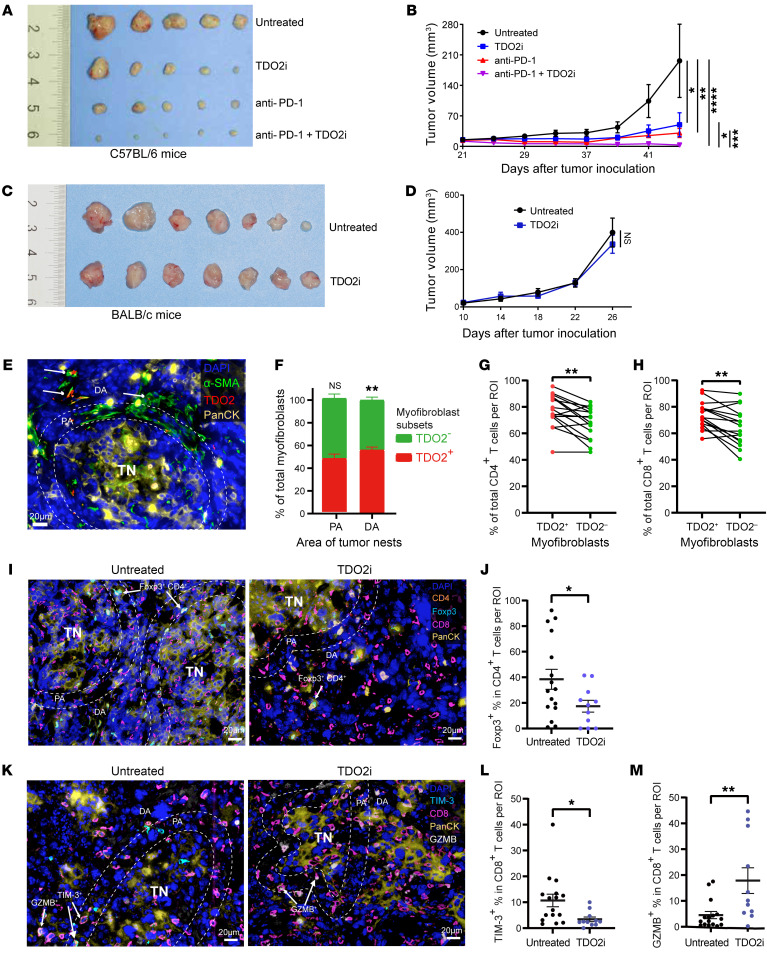
Characterization of the dynamic change in the immunological landscape during malignant transformation from precancerous lesions to cancerous lesions in squamous cell carcinoma (SCC) is critical for the application of immunotherapy. Here, we performed single-cell RNA-Seq (scRNA-Seq) of 131,702 cells from 13 cancerous tissues of oral squamous cell carcinoma (OSCC), 3 samples of precancerous oral leukoplakia, and 8 adjacent normal samples. We found that tumor-infiltrating CD4+ and CD8+ T cells were functionally inhibited by immunosuppressive ligands expressed on various types of myeloid cells or neutrophils in the process of oral carcinogenesis. Notably, we identified a subset of myofibroblasts that exclusively expressed tryptophan 2,3-dioxygenase (TDO2). These TDO2+ myofibroblasts were located distally from tumor nests, and both CD4+ and CD8+ T cells were enriched around them. Functional experiments revealed that TDO2+ myofibroblasts were more likely to possess the ability for chemotaxis toward T cells but induced the transformation of CD4+ T cells into Tregs and caused CD8+ T cell dysfunction. We further showed that use of the TDO2 inhibitor LM10 attenuated the inhibitory states of T cells, restored the T cell antitumor response, and prevented the progression of OSCC malignant transformation in murine models. Our study reveals a multistep transcriptomic landscape of OSCC and demonstrates that TDO2+ myofibroblasts are potential targets for immunotherapy.

Keywords: Cancer immunotherapy; Immunology; Oncology.


Figures

Figure 1
Figure 1. Single-cell transcriptomic landscape of adjacent normal, OLK, and OSCC tissues.
(A) Overview of the workflow and the experimental design for scRNA-Seq. (B) UMAP plot showing the clustering results of 10 major cell types for 131,702 high-quality single cells from adjacent normal, OLK, and OSCC tissues. The colors represent the major cell types. (C) Dot plot showing the highly expressed marker genes in each major cell type. The dot size represents the percentage of cells expressing the marker genes in each major cell type, and the dot color represents the average expression level of the marker genes in each cell type. Red indicates high expression, and blue indicates low expression. (D) UMAP plot showing the distribution of immune and nonimmune cells among all cells. Green indicates immune cells, and blue indicates nonimmune cells. (E) Stacked histogram showing the percentages of immune cell types among total immune cells from adjacent normal, OLK, and OSCC tissues.
Figure 2
Figure 2. T cell dysfunction and cell state transitions in OSCC.
(A) UMAP plot showing the distribution of CD4+ T cell subsets. Each color represents a CD4+ T cell subset. (B) Bar plots showing the percentage of CD4+ T cell subsets among total CD4+ T cells in adjacent normal, OLK, and OSCC tissues. Each color represents a tissue type. (C) Bar plots showing the percentages of TCR-expanded clonotypes in the CD4+ T cell subsets. The colors indicate different expanded clonotypes. (D) The RNA velocity of CD4+ T cells was visualized on the UMAP plot based on the stochastic model in the scVelo algorithm, suggesting a putative differentiation direction for CD4+ T cells. The arrows indicate the putative differentiation direction. (E) UMAP plot showing the distribution of CD8+ T cell subsets. Each color represents a CD8+ T cell subset. (F) Bar plots showing the percentages of 3 subsets of CD8+ T cells among total CD8+ T cells in adjacent normal, OLK, and OSCC tissues. (G) Violin plots showing the expression levels of effector molecules and immune-inhibitory receptors in 3 subsets of CD8+ T cells. (H) The RNA velocity of CD8+ T cell subsets was visualized on the UMAP plot based on the stochastic model in the scVelo algorithm, suggesting a putative differentiation direction for CD8+ T cell subsets. Arrows represent the putative differentiation direction. *P < 0.05, **P < 0.01, and ****P < 0.0001, by Kruskal-Wallis test followed by Bonferroni’s multiple-comparison test (B and F).
Figure 3
Figure 3. Subsets of myeloid cells and neutrophils that inhibit the function of T cells.
(A) UMAP plot showing the distribution of myeloid cell subsets. Each color represents a subset of myeloid cells. (B) Dot plot showing highly expressed marker genes in myeloid cell subsets. (C) Violin plot showing the expression levels of immunosuppressive ligand molecules in myeloid cell subsets in each tissue. (D) Dot plot showing the interaction intensity between myeloid cell subsets and CD4+ and CD8+ T cells according to CellPhoneDB analysis. Blue indicates low-intensity interaction and red indicates high-intensity interaction. The dot size represents –log10 (P value), and a larger dot indicates a smaller P value. (E) UMAP plot showing the distribution of neutrophil subsets. Each color represents a subset of neutrophils. (F) Violin plot showing the expression levels of specifically expressed genes in neutrophil subsets. Each color represents a gene. (G) Bar plots showing the percentages of neutrophil subsets among the total neutrophils in adjacent normal, OLK, and OSCC tissues. *P < 0.05 and **P < 0.01, by Kruskal-Wallis test followed by Bonferroni’s multiple-comparison test. (H) Bar plot showing the results of enrichment analysis of the set of genes highly expressed in Neutro-C5 in the Reactome database, with the horizontal coordinate representing –log10 (P value). Hypergeometric distribution; P < 0.01.
Figure 4
Figure 4. Subsets of ADSC-Fibro-MF cells and a subtype of myofibroblasts expressing TDO2 in OSCC.
(A) UMAP plot showing the distribution of ADSC-Fibro-MF subsets, with each color representing a cell subset. (B) Bar plots showing the percentage of ADSC-Fibro-MF subsets among total ADSC-Fibro-MF cells in adjacent normal, OLK, and OSCC tissues. *P < 0.05,**P < 0.01, and ****P < 0.0001, by Kruskal-Wallis test followed by Bonferroni’s multiple-comparison test. (C) Volcano plot showing differentially expressed genes between MF-C1-TDO2 and MF-C2-ELN. Red dots represent genes that were significantly upregulated in MF-C1-TDO2 [log2(fold change) >1, adjusted P < 0.05]; blue dots represent genes that were significantly upregulated in MF-C2-ELN [log2(fold change) <–1, adjusted P < 0.05]; and gray dots represent genes with no significant difference. (D) Bar plot showing the top 15 highest differential pathways between MF-C1-TDO2 and MF-C2-ELN. Red bars represent pathways that were enriched in MF-C1-TDO2, and blue bars represent pathways that were enriched in MF-C2-ELN. (E) Violin plot showing the score for the AhR activation module among ADSC-Fibro-MF subsets. ****P < 0.0001, by Wilcoxon rank-sum test. (F) IF staining images showing the expression intensity of α-SMA (green) and TDO2 (red) in OSCC and normal adjacent tissue. Images in the first row were obtained at ×10 magnification (scale bars: 200 μm). Images in the second row were obtained at ×40 magnification (scale bars: 10 μm). (G) UMAP plot showing the differentiation trajectory of ADSC-Fibro-MF cells and the distribution of each cell subset on the trajectory. Branch 1 is mainly composed of ADSCs, branch 2 is mainly composed of fibroblasts, and branch 3 is mainly composed of myofibroblasts. The numbers indicate the branches.
Figure 5
Figure 5. MF-C1-TDO2 myofibroblasts attract T cells and shield tumor cells from T cell attacks.
(A) Dot plot showing the interaction intensity between chemokines (CXCL9/-10/-11) from myofibroblasts (MF-C2-ELN or MF-C1-TDO2) and the chemokine receptor CXCR3 on CD4+ and CD8+ T cells according to the CellPhoneDB analysis. (B) mIHC results showing the spatial localization of TDO2+ myofibroblasts (TDO2+α-SMA+), TDO2 myofibroblasts (TDO2α-SMA+), and cancer cells (Pan-CK+). Scale bars: 100 μm. (C) Representative image (Pt10_Ca) showing the spatial distribution of TDO2+ (red) and TDO2 myofibroblasts (green) in the proximal area (PA) (PA <100 μm from the tumor nest [TN] border) and the distal area (DA) (DA ≥100 μm from the tumor nest border) of tumor nests. Scale bar: 50 μm. Green arrows indicate examples of TDO2 cells in the proximal area; red arrows indicate examples of TDO2+ cells in the distal area. (D) Quantitative analysis of the proportions of TDO2+ and TDO2 myofibroblasts in the PA and the DA of tumor nests. (E) Representative images (Pt10_Ca) showing the spatial distribution of CD4+ (orange) and CD8+ (purple) T cells around TDO2+ (radius <50 μm) and TDO2 (radius <50 μm) myofibroblasts. Scale bar: 50 μm. Red arrow indicates an example of a TDO2+ cell; green arrow indicates an example of a TDO2 cell. (F and G) Quantitative analyses of the proportions of (F) CD4+ and (G) CD8+ T cells around TDO2+ or TDO2 myofibroblasts. ROI, region of interest. (H) High-content cell imaging showing the difference between the CXCR3+CD3+ T cell (blue) chemoattraction toward TDO2+ and TDO2 myofibroblasts (green) from OSCC tissue at different time points in vitro. Scale bars: 50 μm. ***P < 0.001 and ****P < 0.0001, by 2-tailed Student’s t test (D, F, and G).
Figure 6
Figure 6. TDO2+ myofibroblasts mediate T cell suppression.
(A) Representative images (Pt14_Ca) (left) and quantitative analyses (right) showing the spatial distribution and the proportions of Foxp3+CD4+ T cells (light blue) around TDO2+ (red) and TDO2 (green) myofibroblasts (radius <50 μm). Scale bars: 50 μm. (B) Representative images (Pt14_Ca) showing the spatial distribution of PD-1+TIM-3+CD8+ T cells around TDO2+ myofibroblasts. Scale bars: 50 μm and 10 μm (enlarged inset). (C) Schematic diagram depicting the coculture strategy for control myofibroblasts (si-NC) and TDO2-knockdown myofibroblasts (si-TDO2) with CD4+ or CD8+ T cells. (DF) Representative images of flow cytometry (left) and statistical results (right) showing the proportions of (D) Foxp3+CD4+ T cells, (E) PD-1+, and (F) GZMB+CD8+ T cells for the control group (si-NC) and the TDO2-knockdown groups (si-TDO2-1 and si-TDO2-2). (GI) Representative flow cytometry (left) and statistical results (right) showing the proportion of (G) Foxp3+ T cells, (H) PD-1+, and (I) GZMB+CD8+ T cells after 3 days of coculturing with TDO2 or TDO2+ myofibroblasts or with TDO2+ myofibroblasts plus the TDO2 inhibitor LM10. (J) Representative IHC images of TMAs. The H scores of representative TDO2hi and TDO2lo images were 141.9 and 68.0, respectively. Scale bars: 400 μm (left) and 50 μm (right). (K) OS curve between TDO2hi (n = 71) and TDO2lo (n = 71) cohorts of patients with OSCC according to the staining intensity of IHC images. P < 0.0001, by log-rank test. (A and DI) *P < 0.05, **P < 0.01, ***P < 0.001, and ****P < 0.0001, by 1-way ANOVA followed by Bonferroni’s multiple-comparison test.
Figure 7
Figure 7. Inhibition of TDO2 prevents the formation of OSCC in 4NQO-induced carcinogenic murine models.
(A) Schematic plot showing the induction of OSCC by 4NQO in C57BL/6 mice and the administration strategies for the TDO2i group (n = 7) and the untreated group (n = 8). (B) Six representative intraoral lesions on the tongues of mice in the TDO2i and untreated groups. (C) Macroscopic lesions on the tongues (left) and statistical results (right) for mice in the TDO2i and untreated groups. The dotted circles indicate macroscopic cauliflower-like lesions. (D) Representative microscopic images of the TDO2i and untreated groups following H&E staining. Scale bar: 100 μm. (E) Comparison of the tongue lesions (mild-to-moderate dysplasia, severe dysplasia or carcinoma in situ, and invasive carcinoma) in mice from the TDO2i and untreated groups. **P < 0.01, by Fisher’s exact test. (FH) Representative flow cytometry (left) and statistical results (right) showing the proportions of (F) Foxp3+, (G) PD-1+ and (H) IFN-γ+CD4+ T cells for the TDO2i and untreated groups. (IK) Representative flow cytometry (left) and statistical results (right) showing the proportions of (I) PD-1+, (J) TIM-3+, and (K) IFN-γ+CD8+ T cells for the TDO2i and untreated groups. (L and M) Representative flow cytometry (left) and statistical results (right) showing the median fluorescence intensity (MFI) of (L) GZMB and (M) AhR for CD4+ (upper) and CD8+ (lower) T cells from the TDO2i and untreated groups. *P < 0.05, **P < 0.01, and ***P < 0.001, by 2-tailed Student’s t test (C and EM).
Figure 8
Figure 8. TDO2 inhibition enhances the effector function of CD8+ T cells to exert antitumor immunity.
(A and B) Gross appearance of the tumor mass (A) and kinetics of the tumor volume (mm3) (B) were measured and documented for C57BL/6 mice in the untreated group, the anti–PD-1 group, the TDO2i group, and the anti–PD-1 plus TDO2i group. (C and D) Gross appearance of the tumor mass (C) and kinetics of the tumor volume (mm3) (D) were measured and documented for BALB/c nude mice in the untreated group and the TDO2i group. (E) Representative image showing the spatial distribution of TDO2+ or TDO2 myofibroblasts in the PA and DA. Scale bar: 20 μm. (F) Quantitative analysis of the proportions of TDO2+ and TDO2 myofibroblasts in the PA and DA. (G and H) Quantitative analyses of the proportions of (G) CD4+ and (H) CD8+ T cells around TDO2+ or TDO2 myofibroblasts from murine tumor tissues. (I and J) Representative images (I) and quantitative analyses (J) showing the spatial distribution and proportions of Foxp3+ CD4+ T cells located in the PA of tumor tissues from mice in the untreated and TDO2i groups. Scale bars: 20 μm. (KM) Representative images (K) and quantitative analyses showing the spatial distribution and proportions of (L) TIM-3+CD8+ T cells and (M) GZMB+CD8+ T cells located in the PA of tumor tissues from mice in the untreated and TDO2i groups. Scale bars: 20 μm. *P < 0.05, **P < 0.01, ***P < 0.001, and ****P < 0.0001, by repeated-measures analysis of means (B and D) and *P < 0.05 and **P < 0.01, by 2-tailed Student’s t test (FH and J, L, and M). PA, less than 20 μm from the murine tumor nest border. DA, 20 μm or more from the murine tumor nest border. TN, tumor nest.

References

    1. Sung H, et al. Global cancer statistics 2020: GLOBOCAN estimates of incidence and mortality worldwide for 36 cancers in 185 countries. CA Cancer J Clin. 2021;71(3):209–249. doi: 10.3322/caac.21660. - DOI - PubMed
    1. Chi AC, et al. Oral cavity and oropharyngeal squamous cell carcinoma--an update. CA Cancer J Clin. 2015;65(5):401–421. doi: 10.3322/caac.21293. - DOI - PubMed
    1. Yardimci G, et al. Precancerous lesions of oral mucosa. World J Clin Cases. 2014;2(12):866–872. doi: 10.12998/wjcc.v2.i12.866. - DOI - PMC - PubMed
    1. Evren I, et al. Annual malignant transformation rate of oral leukoplakia remains consistent: a long-term follow-up study. Oral Oncol. 2020;110:105014. doi: 10.1016/j.oraloncology.2020.105014. - DOI - PubMed
    1. Ribas A, Wolchok JD. Cancer immunotherapy using checkpoint blockade. Science. 2018;359(6382):1350–1355. doi: 10.1126/science.aar4060. - DOI - PMC - PubMed

Publication types