Shared and Distinctive Neighborhoods of Emerin and Lamin B Receptor Revealed by Proximity Labeling and Quantitative Proteomics
- PMID: 35972904
- PMCID: PMC9442789
- DOI: 10.1021/acs.jproteome.2c00281
Shared and Distinctive Neighborhoods of Emerin and Lamin B Receptor Revealed by Proximity Labeling and Quantitative Proteomics
Abstract
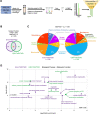
Emerin and lamin B receptor (LBR) are abundant transmembrane proteins of the nuclear envelope that are concentrated at the inner nuclear membrane (INM). Although both proteins interact with chromatin and nuclear lamins, they have distinctive biochemical and functional properties. Here, we have deployed proximity labeling using the engineered biotin ligase TurboID (TbID) and quantitative proteomics to compare the neighborhoods of emerin and LBR in cultured mouse embryonic fibroblasts. Our analysis revealed 232 high confidence proximity partners that interact selectively with emerin and/or LBR, 49 of which are shared by both. These included previously characterized NE-concentrated proteins, as well as a host of additional proteins not previously linked to emerin or LBR functions. Many of these are TM proteins of the ER, including two E3 ubiquitin ligases. Supporting these results, we found that 11/12 representative proximity relationships identified by TbID also were detected at the NE with the proximity ligation assay. Overall, this work presents methodology that may be used for large-scale mapping of the landscape of the INM and reveals a group of new proteins with potential functional connections to emerin and LBR.
Keywords: TurboID; emerin; inner nuclear membrane; lamin B receptor; nuclear envelope; nuclear lamina; proximity labeling.
Conflict of interest statement
The authors declare no competing financial interest.
Figures


Similar articles
-
Dependence of diffusional mobility of integral inner nuclear membrane proteins on A-type lamins.Biochemistry. 2006 Feb 7;45(5):1374-82. doi: 10.1021/bi052156n. Biochemistry. 2006. PMID: 16445279 Free PMC article.
-
Both emerin and lamin C depend on lamin A for localization at the nuclear envelope.J Cell Sci. 2001 Jul;114(Pt 14):2577-90. doi: 10.1242/jcs.114.14.2577. J Cell Sci. 2001. PMID: 11683386
-
Nuclear envelope structural proteins facilitate nuclear shape changes accompanying embryonic differentiation and fidelity of gene expression.BMC Cell Biol. 2017 Jan 14;18(1):8. doi: 10.1186/s12860-017-0125-0. BMC Cell Biol. 2017. PMID: 28088180 Free PMC article.
-
Lamins in disease: why do ubiquitously expressed nuclear envelope proteins give rise to tissue-specific disease phenotypes?J Cell Sci. 2001 Jan;114(Pt 1):9-19. doi: 10.1242/jcs.114.1.9. J Cell Sci. 2001. PMID: 11112685 Review.
-
Lamins and lamin-binding proteins in functional chromatin organization.Crit Rev Eukaryot Gene Expr. 1999;9(3-4):257-65. doi: 10.1615/critreveukargeneexpr.v9.i3-4.100. Crit Rev Eukaryot Gene Expr. 1999. PMID: 10651242 Review.
Cited by
-
Comparative membrane proteomics reveals diverse cell regulators concentrated at the nuclear envelope.bioRxiv [Preprint]. 2023 Feb 14:2023.02.13.528342. doi: 10.1101/2023.02.13.528342. bioRxiv. 2023. Update in: Life Sci Alliance. 2023 Jul 11;6(9):e202301998. doi: 10.26508/lsa.202301998. PMID: 36824861 Free PMC article. Updated. Preprint.
-
Choreography of lamina-associated domains: structure meets dynamics.FEBS Lett. 2023 Nov;597(22):2806-2822. doi: 10.1002/1873-3468.14771. Epub 2023 Nov 14. FEBS Lett. 2023. PMID: 37953467 Free PMC article. Review.
-
The role of inner nuclear membrane protein emerin in myogenesis.FASEB J. 2025 Apr 15;39(7):e70514. doi: 10.1096/fj.202500323. FASEB J. 2025. PMID: 40178931 Free PMC article. Review.
-
Activity-dependent synthesis of Emerin gates neuronal plasticity by regulating proteostasis.Cell Rep. 2025 Apr 22;44(4):115439. doi: 10.1016/j.celrep.2025.115439. Epub 2025 Apr 9. Cell Rep. 2025. PMID: 40208794 Free PMC article.
-
The development of proximity labeling technology and its applications in mammals, plants, and microorganisms.Cell Commun Signal. 2023 Sep 30;21(1):269. doi: 10.1186/s12964-023-01310-1. Cell Commun Signal. 2023. PMID: 37777761 Free PMC article. Review.
References
Publication types
MeSH terms
Substances
Grants and funding
LinkOut - more resources
Full Text Sources
Research Materials

