Review
. 2022 Nov;131(5):311-324.
doi: 10.1111/bcpt.13780. Epub 2022 Aug 24.

Drug metabolism and drug transport of the 100 most prescribed oral drugs

Affiliations
Review

Drug metabolism and drug transport of the 100 most prescribed oral drugs

Ditte B Iversen et al. Basic Clin Pharmacol Toxicol. 2022 Nov.

Abstract

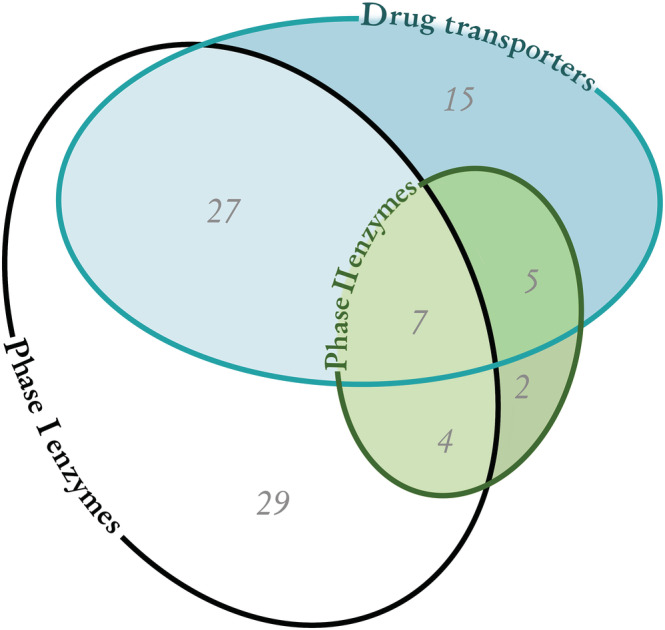
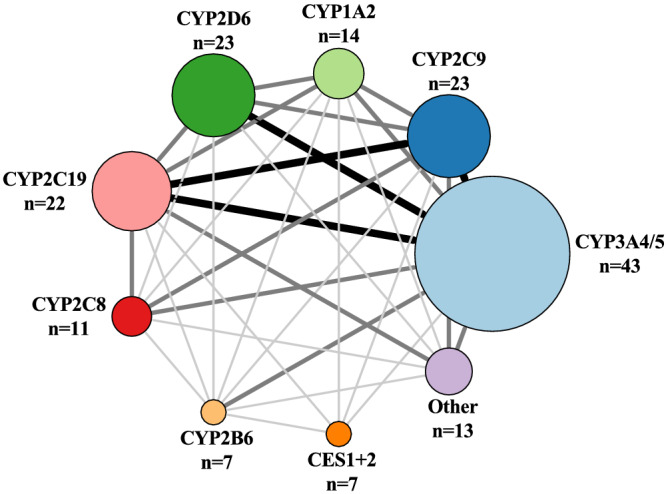
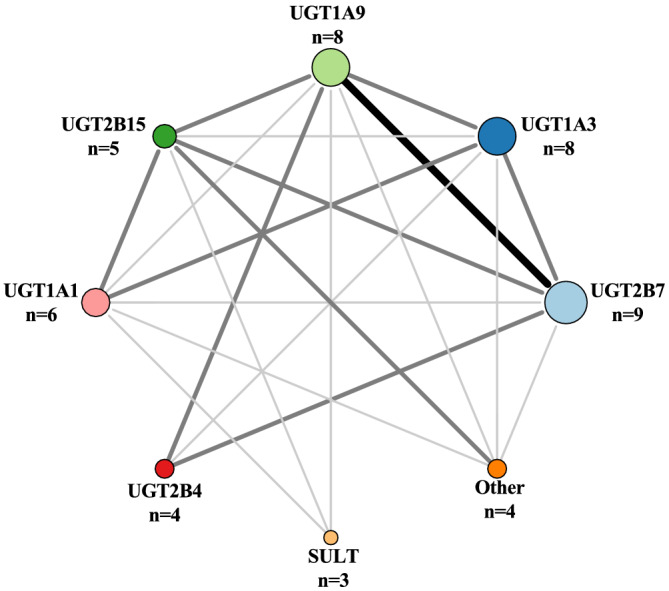
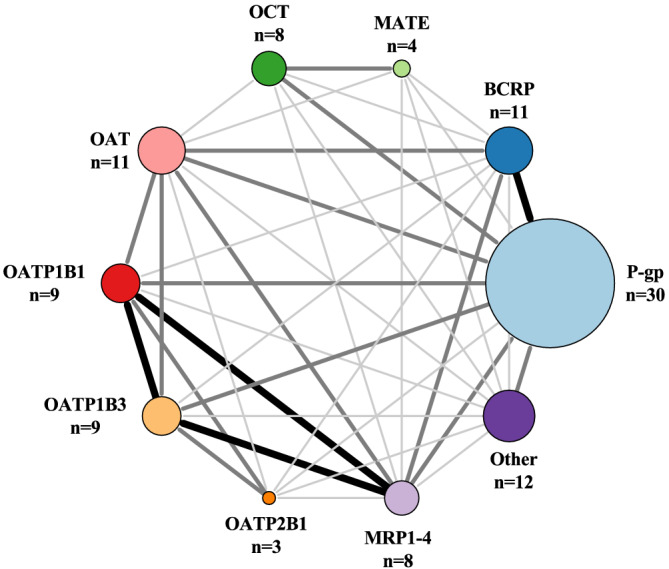
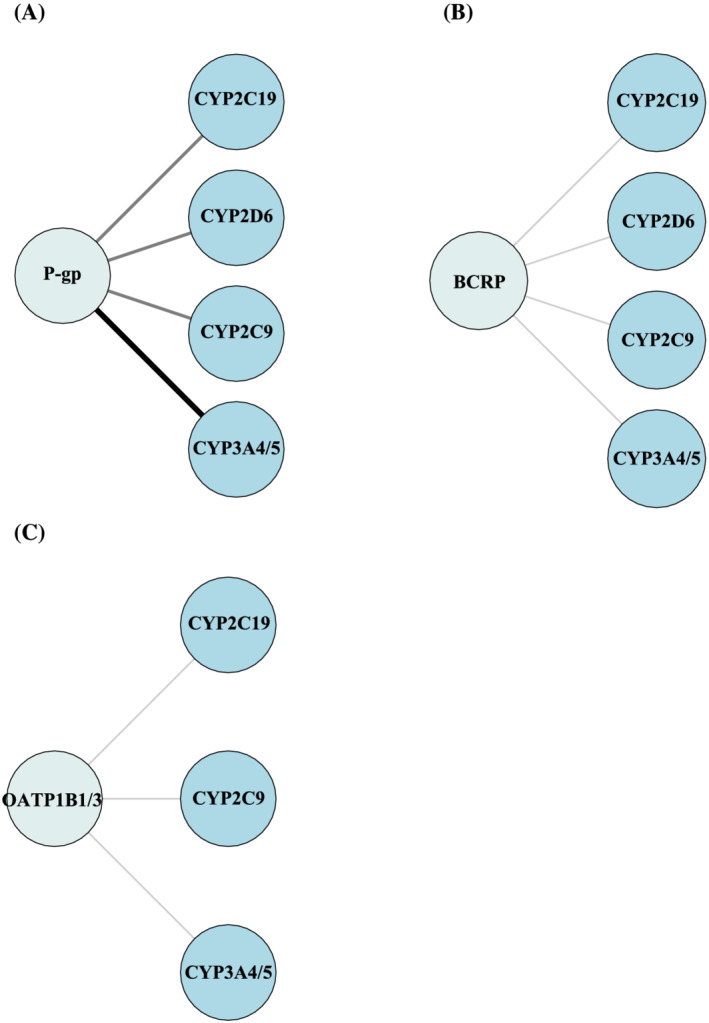
Safe and effective use of drugs requires an understanding of metabolism and transport. We identified the 100 most prescribed drugs in six countries and conducted a literature search on in vitro data to assess contribution of Phase I and II enzymes and drug transporters to metabolism and transport. Eighty-nine of the 100 drugs undergo drug metabolism or are known substrates for drug transporters. Phase I enzymes are involved in metabolism of 67 drugs, while Phase II enzymes mediate metabolism of 18 drugs. CYP3A4/5 is the most important Phase I enzyme involved in metabolism of 43 drugs followed by CYP2D6 (23 drugs), CYP2C9 (23 drugs), CYP2C19 (22 drugs), CYP1A2 (14 drugs) and CYP2C8 (11 drugs). More than half of the drugs (54 drugs) are known substrates for drug transporters. P-glycoprotein (P-gp) is known to be involved in transport of 30 drugs, while breast cancer resistance protein (BCRP) facilitates transport of 11 drugs. A considerable proportion of drugs are subject to a combination of Phase I metabolism, Phase II metabolism and/or drug transport. We conclude that the majority of the most frequently prescribed drugs depend on drug metabolism or drug transport. Thus, understanding variability of drug metabolism and transport remains a priority.

Keywords: ADME; CYP3A4; P-gp; drug metabolism; drug transport.


Conflict of interest statement

Ann‐Cathrine Dalgård Dunvald has given paid lectures for Astellas Pharma. Tore B. Stage has given paid lectures for Pfizer and Eisai and done consulting for Pfizer. Anton Pottegård has participated in research projects funded by Alcon, Almirall, Astellas, AstraZeneca, Boehringer‐Ingelheim, Novo Nordisk, Servier and LEO Pharma, all regulator‐mandated Phase IV studies. All of this is unrelated to the work done in this review. Ditte Bork Iversen and Nanna Elman Andersen declare that they have no conflict of interest.

Figures

FIGURE 1
FIGURE 1
Number of the 100 most prescribed drugs metabolized by Phase I enzymes or Phase II enzymes or transported by drug transporters. Overlapping areas reflect a combination of pathways. Of the 100 most prescribed drugs, 11 drugs are not metabolized or transported.
FIGURE 2
FIGURE 2
Number of drugs metabolized by Phase I enzymes is illustrated with increasing circle size. The size and darkness of the lines between enzymes illustrate the substrate overlap between enzymes. Thin/light‐grey line corresponds to 1–5 drugs as substrate overlap. Medium/grey line corresponds to 6–10 drugs as substrate overlap. Thick/black line corresponds to >10 drugs as substrate overlap. Overlap within a group is not illustrated in the figure, but we refer to Table S1 for further information. The group Other includes CYP1A1, CYP2E1, CP2C18, CYP2J2, CYP3A3, CYP3A7, CYP2A6, CYP1B1, AO, FMO and MAO‐A + B. AO, aldehyde oxidase; CES, carboxylesterase; CYP, cytochrome P450 enzyme; FMO, flavin‐containing monooxygenase; MAO, monoamine oxidase.
FIGURE 3
FIGURE 3
Number of drugs metabolized by Phase II enzymes is illustrated with increasing circle size. The size and darkness of the lines between enzymes illustrate the substrate overlap. Thin/light‐grey line corresponds to 1–2 drugs as substrate overlap. Medium/grey line corresponds to 3–4 drugs as substrate overlap. Thick/black line corresponds to >4 drugs as substrate overlap. Overlap within a group is not illustrated in the figure, but we refer to Table S1 for further information. The group Other contains UGT1A4, UGT1A6 and UGT2B10. SULT, sulfotransferases; UGT, uridine 5′‐diphospho‐glucuronosyltransferases.
FIGURE 4
FIGURE 4
Number of drugs transported by drug transporters is illustrated with increasing circle size. The size and darkness of the lines between enzymes illustrate the substrate overlap. Thin/light‐grey line corresponds to 1–2 drugs as substrate overlap. Medium/grey line corresponds to 3–4 drugs as substrate overlap. Thick/black line corresponds to >4 drugs as substrate overlap. Overlap within a group is not illustrated in the figure, but we refer to Table S1 for further information. The group Other contains MCT, OATP1A2, OATP4C1, OCTN, LAT, SERT, PMAT, THTR, CHT, NTCP, PePT and AE. AE, anion exchange protein; BCRP, breast cancer resistance protein; CHT, choline transporter; LAT, L‐amino acid transporter; MATE, multidrug and toxic compound extrusion; MCT, monocarboxylate transporter; MRP, multidrug resistance‐associated protein; NTC, sodium‐taurocholate co‐transporting polypeptide; OAT, organic anion transporter; OATP, organic anion transporting polypeptide; OCT, organic cation transporter; OCTN, organic cation transporter novel; PePT, peptide transporter; PMAT, plasma membrane monoamine transporter; P‐gp, P‐glycoprotein; SERT, serotonin transporter; THTR, thiamine transporter protein.
FIGURE 5
FIGURE 5
(A) Substrate overlap between P‐gp and CYP3A4/5, CYP2C9, CYP2C19 and CYP2D6. (B) Substrate overlap between BCRP and CYP3A4/5, CYP2C9, CYP2C19 and CYP2D6. (C) Substrate overlap between OATP1B1/3 and CYP3A4/5, CYP2C9 and CYP2C19. The size and darkness of the lines between drug transporter and enzymes illustrate the substrate overlap. Thin/light‐grey line corresponds to 1–5 drugs as substrate overlap. Medium/grey line corresponds to 6–10 drugs as substrate overlap. Thick/black line corresponds to >10 drugs as substrate overlap. BCRP, breast cancer resistance protein; CYP, cytochrome P450 enzyme; OATP, organic anion transporting polypeptide; P‐gp, P‐glycoprotein.

References

    1. Venkatakrishnan K, von Moltke LL, Greenblatt DJ. Human drug metabolism and the cytochromes P450: application and relevance of in vitro models. J Clin Pharmacol. 2001;41(11):1149‐1179. doi: 10.1177/00912700122012724 - DOI - PubMed
    1. Kornholt J, Christensen MB. Prevalence of polypharmacy in Denmark. Dan Med J. 2020;67(6):A12190680. - PubMed
    1. Issa NT, Wathieu H, Ojo A, Byers SW, Dakshanamurthy S. Drug metabolism in preclinical drug development: a survey of the discovery process, toxicology, and computational tools. CDM. 2017;18(6):556‐565. doi: 10.2174/1389200218666170316093301 - DOI - PMC - PubMed
    1. Zhao M, Ma J, Li M, et al. Cytochrome P450 enzymes and drug metabolism in humans. Int J Mol Sci. 2021;22(23):12808. doi: 10.3390/ijms222312808 - DOI - PMC - PubMed
    1. Ahmed S, Zhou Z, Zhou J, Chen SQ. Pharmacogenomics of drug metabolizing enzymes and transporters: relevance to precision medicine. Genom Proteom Bioinf. 2016;14(5):298‐313. doi: 10.1016/j.gpb.2016.03.008 - DOI - PMC - PubMed

MeSH terms

Substances