

Prediction of Cardiac Resynchronization Therapy Response Using a Lead Placement Score Derived From 4-Dimensional Computed Tomography
- PMID: 35973012
- PMCID: PMC9558060
- DOI: 10.1161/CIRCIMAGING.122.014165
Prediction of Cardiac Resynchronization Therapy Response Using a Lead Placement Score Derived From 4-Dimensional Computed Tomography
Abstract
Background: Cardiac resynchronization therapy (CRT) is an effective treatment for patients with heart failure; however, 30% of patients do not respond to the treatment. We sought to derive patient-specific left ventricle maps of lead placement scores (LPS) that highlight target pacing lead sites for achieving a higher probability of CRT response.
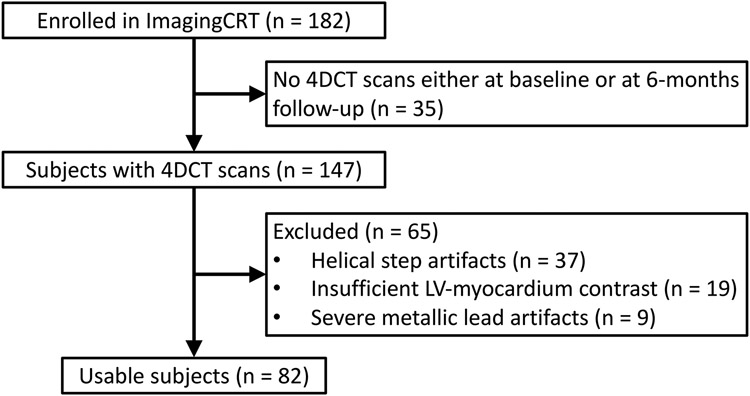
Methods: Eighty-two subjects recruited for the ImagingCRT trial (Empiric Versus Imaging Guided Left Ventricular Lead Placement in Cardiac Resynchronization Therapy) were retrospectively analyzed. All 82 subjects had 2 contrast-enhanced full cardiac cycle 4-dimensional computed tomography scans: a baseline and a 6-month follow-up scan. CRT response was defined as a reduction in computed tomography-derived end-systolic volume ≥15%. Eight left ventricle features derived from the baseline scans were used to train a support vector machine via a bagging approach. An LPS map over the left ventricle was created for each subject as a linear combination of the support vector machine feature weights and the subject's own feature vector. Performance for distinguishing responders was performed on the original 82 subjects.
Results: Fifty-two (63%) subjects were responders. Subjects with an LPS≤Q1 (lower-quartile) had a posttest probability of responding of 14% (3/21), while subjects with an LPS≥ Q3 (upper-quartile) had a posttest probability of responding of 90% (19/21). Subjects with Q1<LPS<Q3 had a posttest probability of responding that was essentially unchanged from the pretest probability (75% versus 63%, P=0.2). An LPS threshold that maximized the geometric mean of true-negative and true-positive rates identified 26/30 of the nonresponders. The area under the curve of the receiver operating characteristic curve for identifying responders with an LPS threshold was 87%.
Conclusions: An LPS map was defined using 4-dimensional computed tomography-derived features of left ventricular mechanics. The LPS correlated with CRT response, reclassifying 25% of the subjects into low probability of response, 25% into high probability of response, and 50% unchanged. These encouraging results highlight the potential utility of 4-dimensional computed tomography in guiding patient selection for CRT. The present findings need verification in larger independent data sets and prospective trials.
Keywords: cardiac imaging techniques; cardiac resynchronization therapy; four-dimensional computed tomography; heart failure; heart function tests; support vector machine; ventricular function.
Figures


Similar articles
-
Empiric versus imaging guided left ventricular lead placement in cardiac resynchronization therapy (ImagingCRT): study protocol for a randomized controlled trial.Trials. 2013 Apr 26;14:113. doi: 10.1186/1745-6215-14-113. Trials. 2013. PMID: 23782792 Free PMC article. Clinical Trial.
-
Electrically guided versus imaging-guided implant of the left ventricular lead in cardiac resynchronization therapy: a study protocol for a double-blinded randomized controlled clinical trial (ElectroCRT).Trials. 2018 Nov 1;19(1):600. doi: 10.1186/s13063-018-2930-y. Trials. 2018. PMID: 30382923 Free PMC article.
-
An exploratory study on coronary sinus lead tip three-dimensional trajectory changes in cardiac resynchronization therapy.Heart Rhythm. 2013 Sep;10(9):1360-7. doi: 10.1016/j.hrthm.2013.07.008. Epub 2013 Jul 11. Heart Rhythm. 2013. PMID: 23851066
-
Comparative efficacy of image-guided techniques in cardiac resynchronization therapy: a meta-analysis.BMC Cardiovasc Disord. 2021 May 24;21(1):255. doi: 10.1186/s12872-021-02061-y. BMC Cardiovasc Disord. 2021. PMID: 34024286 Free PMC article. Review.
-
Assessment of mechanical dyssynchrony in cardiac resynchronization therapy.Dan Med J. 2014 Dec;61(12):B4981. Dan Med J. 2014. PMID: 25441737 Review.
Cited by
-
Motion correction of wide-detector 4DCT images for cardiac resynchronization therapy planning.J Cardiovasc Comput Tomogr. 2024 Mar-Apr;18(2):170-178. doi: 10.1016/j.jcct.2024.01.007. Epub 2024 Jan 11. J Cardiovasc Comput Tomogr. 2024. PMID: 38242778 Free PMC article.
-
Cine cardiac magnetic resonance segmentation using temporal-spatial adaptation of prompt-enabled segment-anything-model: a feasibility study.J Cardiovasc Magn Reson. 2025 Summer;27(1):101909. doi: 10.1016/j.jocmr.2025.101909. Epub 2025 May 9. J Cardiovasc Magn Reson. 2025. PMID: 40350082 Free PMC article.
-
Cardiac CT in CRT as a Singular Imaging Modality for Diagnosis and Patient-Tailored Management.J Clin Med. 2023 Sep 26;12(19):6212. doi: 10.3390/jcm12196212. J Clin Med. 2023. PMID: 37834855 Free PMC article. Review.
-
Low dose threshold for measuring cardiac functional metrics using four-dimensional CT with deep learning.J Appl Clin Med Phys. 2025 Feb;26(2):e14593. doi: 10.1002/acm2.14593. Epub 2024 Dec 3. J Appl Clin Med Phys. 2025. PMID: 39625106 Free PMC article.
-
Cardiovascular imaging in children with cardiac implantable electronic devices.Pediatr Radiol. 2025 Jan 21:10.1007/s00247-024-06144-8. doi: 10.1007/s00247-024-06144-8. Online ahead of print. Pediatr Radiol. 2025. PMID: 39836181
References
-
- Prinzen FW, Vernooy K, Auricchio A. Cardiac Resynchronization Therapy. Circulation. 2013;128:2407–2418. - PubMed
-
- Vernooy K, van Deursen CJM, Strik M, Prinzen FW. Strategies to improve cardiac resynchronization therapy. Nat Rev Cardiol. 2014;11:481–493. - PubMed
-
- Marek J, Gandalovičová J, Kejřová E, Pšenička M, Linhart A, Paleček T. Echocardiography and cardiac resynchronization therapy. Cor et Vasa. 2016;58:340–351.
-
- Khan FZ, Virdee MS, Palmer CR, Pugh PJ, O’Halloran D, Elsik M, Read PA, Begley D, Fynn SP, Dutka DP. Targeted Left Ventricular Lead Placement to Guide Cardiac Resynchronization Therapy. J Am Coll Cardiol. 2012;59:1509–1518. - PubMed
-
- Vitarelli A, Franciosa P, Rosanio S. Tissue Doppler Imaging in the assessment of selection and response from cardiac resynchronization therapy. Eur J Echocardiogr. 2007;8:309–316. - PubMed
Publication types
MeSH terms
Substances
Grants and funding
LinkOut - more resources
Full Text Sources
Medical
Research Materials
