

A gene expression assay based on chronic lymphocytic leukemia activation in the microenvironment to predict progression
- PMID: 35973197
- PMCID: PMC9647836
- DOI: 10.1182/bloodadvances.2022007508
A gene expression assay based on chronic lymphocytic leukemia activation in the microenvironment to predict progression
Abstract
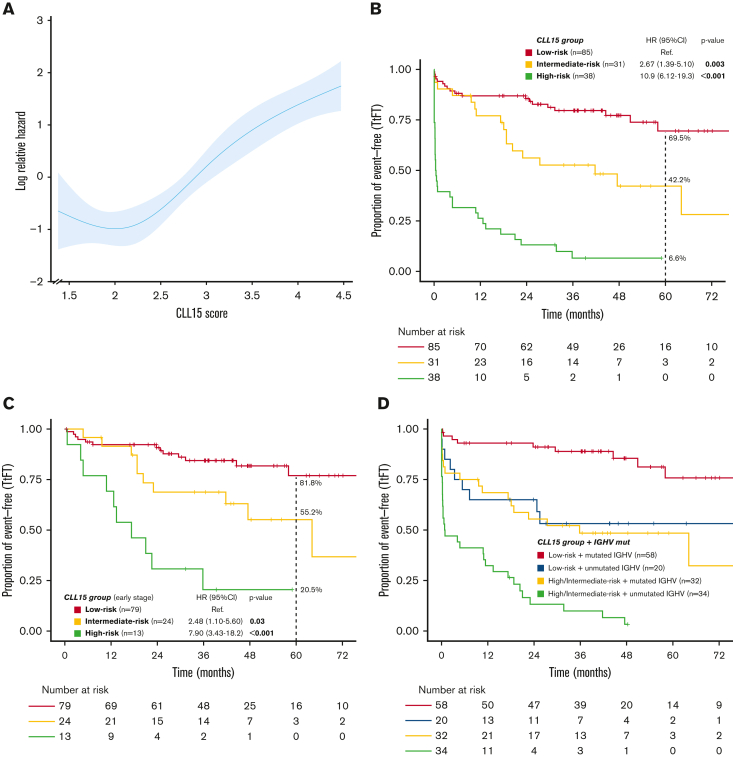
Several gene expression profiles with a strong correlation with patient outcomes have been previously described in chronic lymphocytic leukemia (CLL), although their applicability as biomarkers in clinical practice has been particularly limited. Here we describe the training and validation of a gene expression signature for predicting early progression in patients with CLL based on the analysis of 200 genes related to microenvironment signaling on the NanoString platform. In the training cohort (n = 154), the CLL15 assay containing a 15-gene signature was associated with the time to first treatment (TtFT) (hazard ratio [HR], 2.83; 95% CI, 2.17-3.68; P < .001). The prognostic value of the CLL15 score (HR, 1.71; 95% CI, 1.15-2.52; P = .007) was further confirmed in an external independent validation cohort (n = 112). Notably, the CLL15 score improved the prognostic capacity over IGHV mutational status and the International Prognostic Score for asymptomatic early-stage (IPS-E) CLL. In multivariate analysis, the CLL15 score (HR, 1.83; 95% CI, 1.32-2.56; P < .001) and the IPS-E CLL (HR, 2.23; 95% CI, 1.59-3.12; P < .001) were independently associated with TtFT. The newly developed and validated CLL15 assay successfully translated previous gene signatures such as the microenvironment signaling into a new gene expression-based assay with prognostic implications in CLL.
© 2022 by The American Society of Hematology. Licensed under Creative Commons Attribution-NonCommercial-NoDerivatives 4.0 International (CC BY-NC-ND 4.0), permitting only noncommercial, nonderivative use with attribution. All other rights reserved.
Conflict of interest statement
Conflict-of-interest disclosure: P.A. received honoraria from Janssen, Roche, Celgene, AbbVie, and AstraZeneca. G.V. received research honoraria for speaker activities from MSD and an advisory role from AstraZeneca. M.A. received honoraria for speaker activities from AstraZeneca, an advisory role from Janssen, and nonfinancial support from Janssen, and AbbVie. A.M.-N. received honoraria from Janssen, Roche, Takeda, Gilead, AbbVie, and Celgene for speaker activities and from Janssen, Takeda, Gilead, Kiowa Kirin, AstraZeneca, and Beigene for participating in advisory boards. M.C. received research funding from Janssen, Roche, and AstraZeneca. F.B. received honoraria and research grants from Roche, Celgene, Takeda, AstraZeneca, Novartis, AbbVie, Lilly, Beigene, and Janssen. The remaining authors declare no competing financial interests.
Figures


Similar articles
-
International prognostic score for asymptomatic early-stage chronic lymphocytic leukemia.Blood. 2020 May 21;135(21):1859-1869. doi: 10.1182/blood.2019003453. Blood. 2020. PMID: 32267500 Free PMC article.
-
Surrogate molecular markers for IGHV mutational status in chronic lymphocytic leukemia for predicting time to first treatment.Leuk Res. 2015 Aug;39(8):840-5. doi: 10.1016/j.leukres.2015.05.005. Epub 2015 May 19. Leuk Res. 2015. PMID: 26038121 Clinical Trial.
-
The chronic lymphocytic leukemia international prognostic index predicts time to first treatment in early CLL: Independent validation in a prospective cohort of early stage patients.Am J Hematol. 2016 Nov;91(11):1090-1095. doi: 10.1002/ajh.24493. Epub 2016 Aug 8. Am J Hematol. 2016. PMID: 27465919 Free PMC article. Clinical Trial.
-
Chronic lymphocytic leukemia: a clinical and molecular heterogenous disease.Cancer Genet. 2013 Mar;206(3):49-62. doi: 10.1016/j.cancergen.2013.01.003. Epub 2013 Mar 24. Cancer Genet. 2013. PMID: 23531595 Review.
-
Prognostic factors and risk stratification in chronic lymphocytic leukemia.Semin Oncol. 2016 Apr;43(2):233-40. doi: 10.1053/j.seminoncol.2016.02.009. Epub 2016 Feb 8. Semin Oncol. 2016. PMID: 27040701 Review.
Cited by
-
Genes selection using deep learning and explainable artificial intelligence for chronic lymphocytic leukemia predicting the need and time to therapy.Front Oncol. 2023 Aug 31;13:1198992. doi: 10.3389/fonc.2023.1198992. eCollection 2023. Front Oncol. 2023. PMID: 37719021 Free PMC article.
-
A Nine-Gene Expression Signature Distinguished a Patient with Chronic Lymphocytic Leukemia Who Underwent Prolonged Periodic Fasting.Medicina (Kaunas). 2023 Jul 31;59(8):1405. doi: 10.3390/medicina59081405. Medicina (Kaunas). 2023. PMID: 37629695 Free PMC article.
References
-
- Hallek M, Cheson BD, Catovsky D, et al. iwCLL guidelines for diagnosis, indications for treatment, response assessment, and supportive management of CLL. Blood. 2018;131(25):2745–2760. - PubMed
-
- Langerbeins P, Bahlo J, Rhein C, et al. The CLL12 trial protocol: a placebo-controlled double-blind phase III study of ibrutinib in the treatment of early-stage chronic lymphocytic leukemia patients with risk of early disease progression. Future Oncol. 2015;11(13):1895–1903. - PubMed
