. 2022 Sep 1;82(17):3270-3283.e9.
doi: 10.1016/j.molcel.2022.07.007. Epub 2022 Aug 15.

Saturation of the mitochondrial NADH shuttles drives aerobic glycolysis in proliferating cells

Affiliations

Saturation of the mitochondrial NADH shuttles drives aerobic glycolysis in proliferating cells

Yahui Wang et al. Mol Cell. .

Abstract

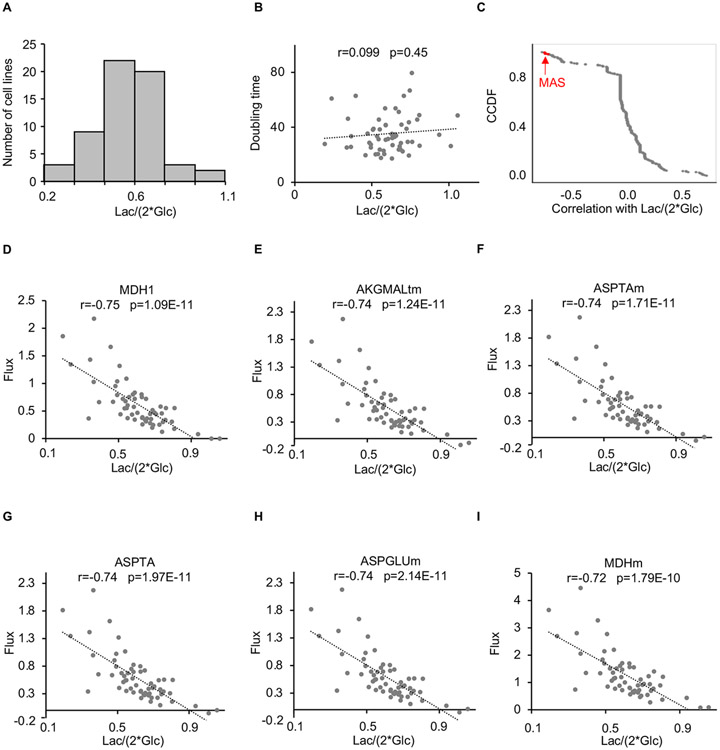
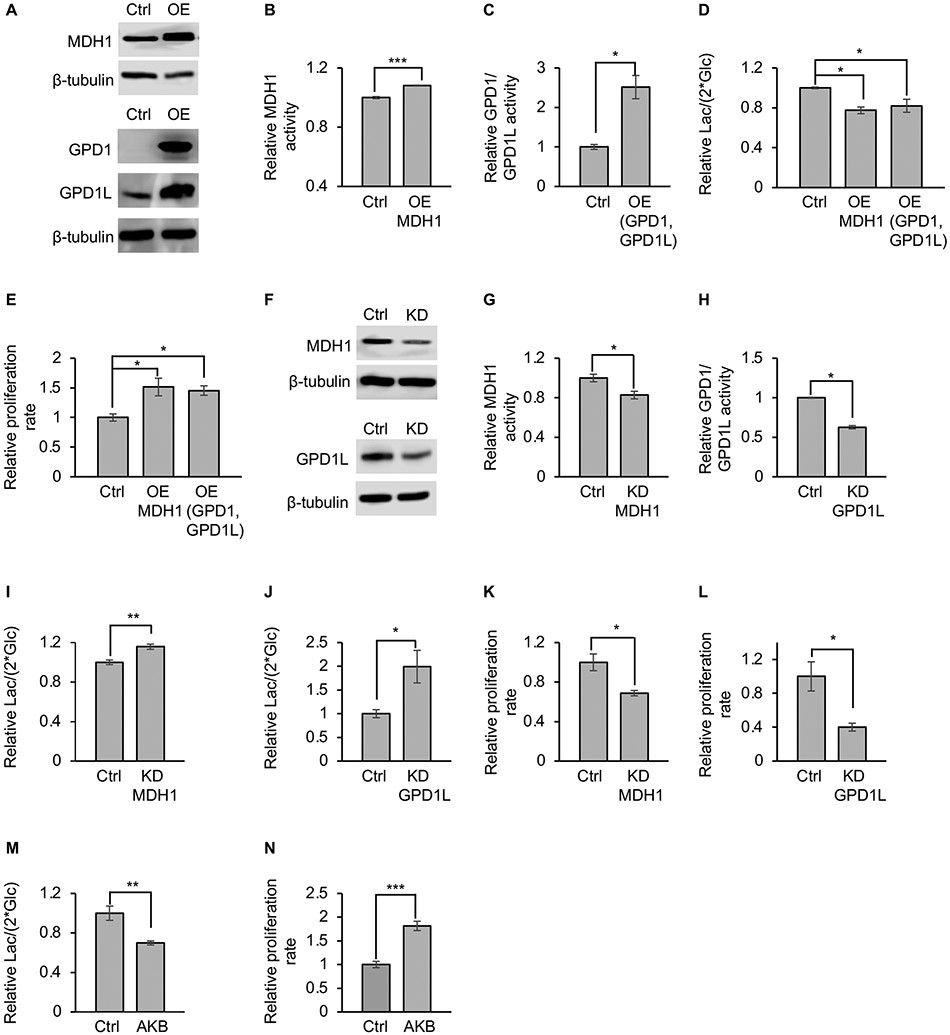
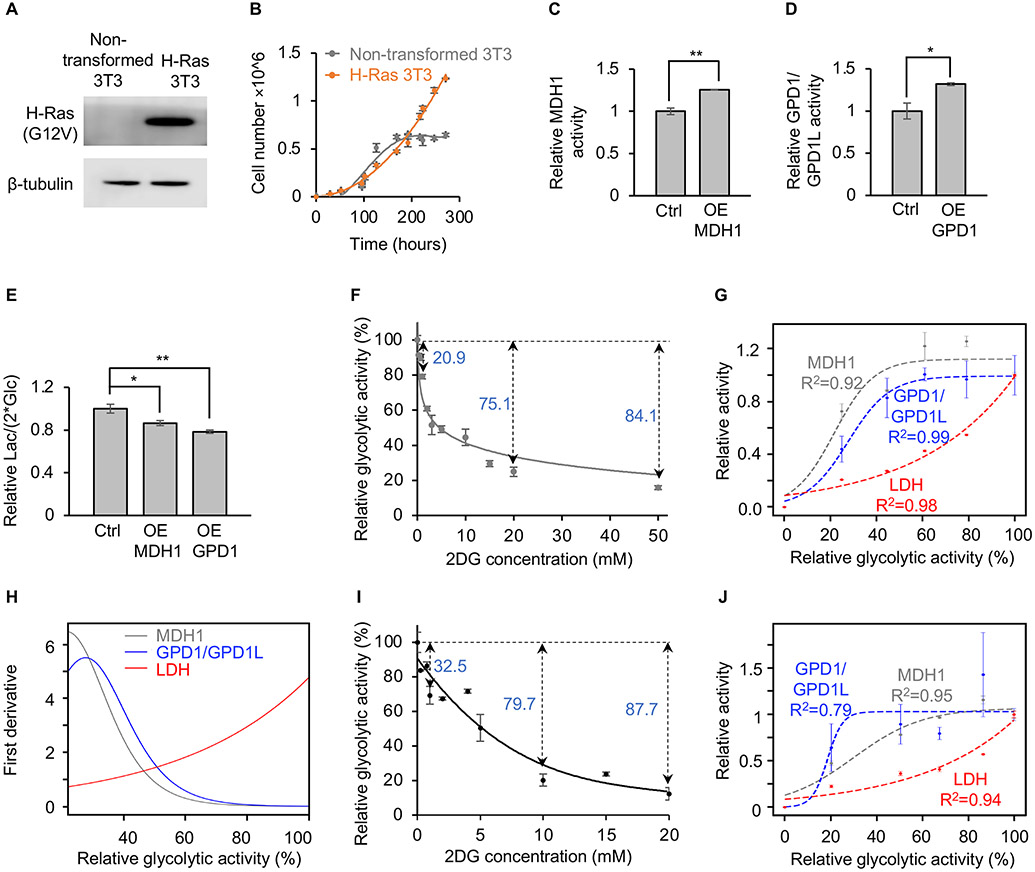
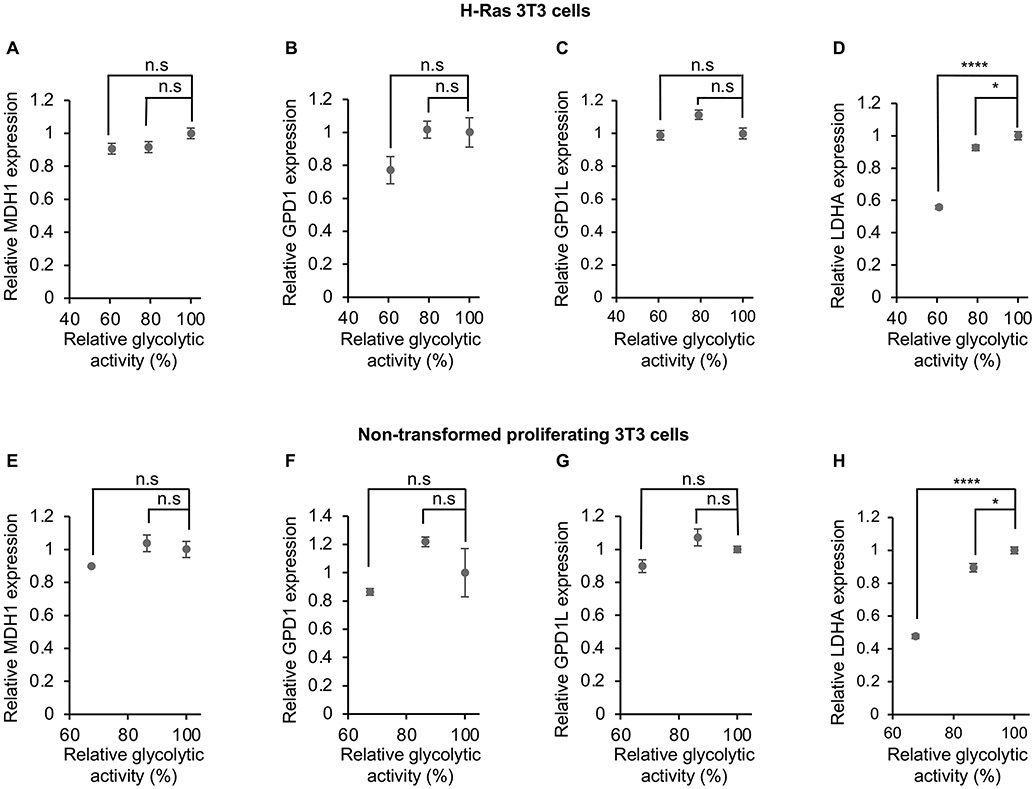
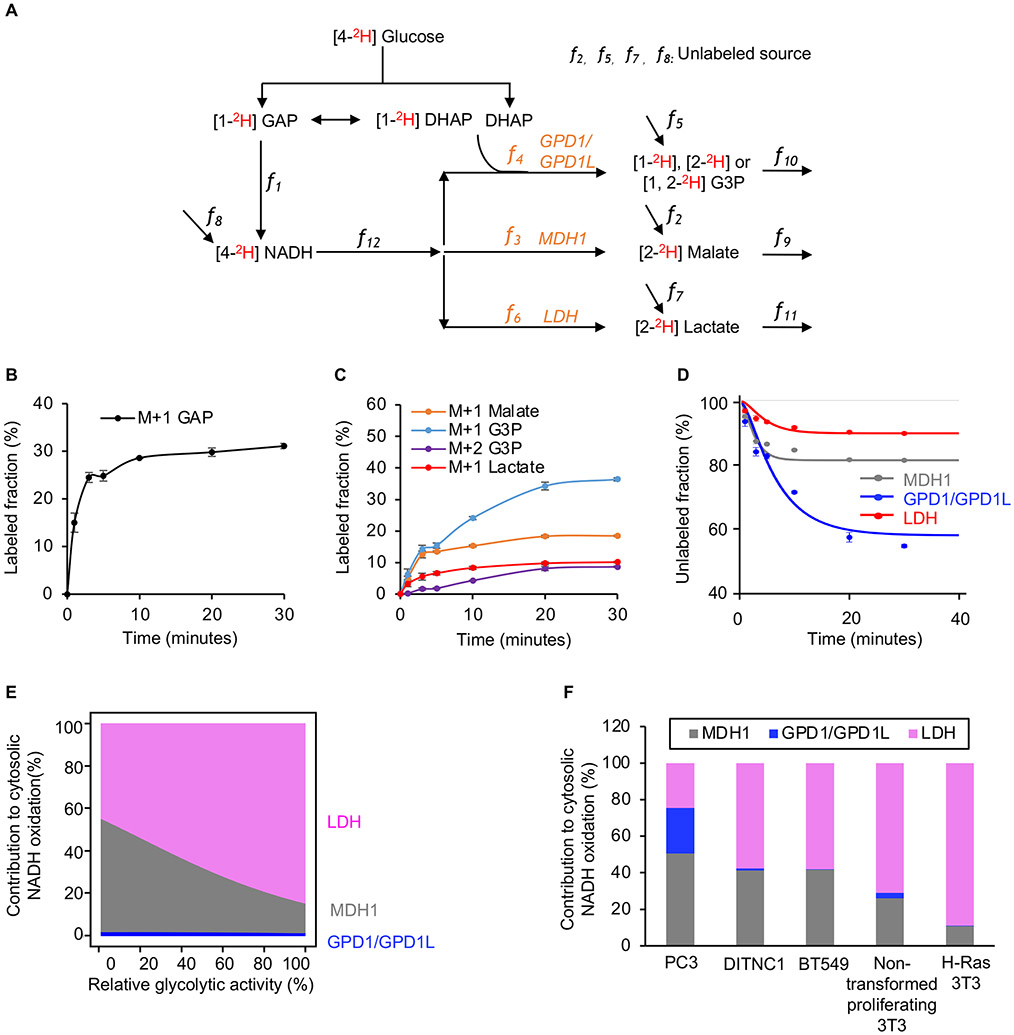
Proliferating cells exhibit a metabolic phenotype known as "aerobic glycolysis," which is characterized by an elevated rate of glucose fermentation to lactate irrespective of oxygen availability. Although several theories have been proposed, a rationalization for why proliferating cells seemingly waste glucose carbon by excreting it as lactate remains elusive. Using the NCI-60 cell lines, we determined that lactate excretion is strongly correlated with the activity of mitochondrial NADH shuttles, but not proliferation. Quantifying the fluxes of the malate-aspartate shuttle (MAS), the glycerol 3-phosphate shuttle (G3PS), and lactate dehydrogenase under various conditions demonstrated that proliferating cells primarily transform glucose to lactate when glycolysis outpaces the mitochondrial NADH shuttles. Increasing mitochondrial NADH shuttle fluxes decreased glucose fermentation but did not reduce the proliferation rate. Our results reveal that glucose fermentation, a hallmark of cancer, is a secondary consequence of MAS and G3PS saturation rather than a unique metabolic driver of cellular proliferation.

Keywords: NADH shuttles; aerobic glycolysis; cancer metabolism; glycerol 3-phosphate shuttle; isotope-tracer analysis; malate-aspartate shuttle; metabolic flux; metabolomics; the Warburg effect.


Conflict of interest statement

Declaration of interests G.J.P. is a scientific advisory board member for Cambridge Isotope Laboratories. The Patti laboratory has a collaborative agreement with Thermo Fisher Scientific and Agilent Technologies.

Figures

Figure 1:
Figure 1:. Lactate excretion is correlated with malate-aspartate shuttle flux, but not proliferation in cancer cells
(A) Histogram showing the distribution of lactate-excretion rates across the NCI-60 panel of cell lines. (B) No significant correlation was observed between lactate-excretion rate and doubling times for cancer cell lines from the NCI-60 panel. A correlation coefficient (r) and a p value as determined by a Pearson correlation are provided. (C) Complementary cumulative distribution function (CCDF) for Pearson correlations between metabolic fluxes and the lactate-excretion rate for cancer cell lines from the NCI-60 panel. Fluxes highlighted in red correspond to reactions involved in the malate-aspartate shuttle. We note that the glycerol 3-phosphate shuttle was not included in the metabolic model used for flux balance analysis. (D-I) Plot of malate-aspartate shuttle fluxes as a function of lactate-excretion rate for cancer cell lines from the NCI-60 panel. Correlation coefficients (r) and p values as determined by a Pearson correlation are provided. Results are from the analysis of the NCI-60 panel of cancer cell lines. Lac, lactate; Glc, glucose.
Figure 2:
Figure 2:. MDH1 activity and GPD1/GPD1L activity regulate lactate-excretion rate
(A) Western blots for MDH1, GPD1, and GPD1L in PC3 cancer cells. Overexpression increases protein levels. Control cells overexpressed green fluorescent protein (GFP) instead of a dehydrogenase. (B and C) Overexpressing MDH1 (B), GPD1, and GPD1L (C) in PC3 cancer cells increases MDH1 and GPD1/GPD1L activities. Control cells overexpressed GFP instead of a dehydrogenase. MDH1 activities was determined by the fraction of [2-2H] malate normalized to the fraction of [1-2H] GAP. GPD1/GPD1L activities was determined by the fraction of [1,2-2H] G3P normalized to the fraction of [1-2H] DHAP and [4-2H] NADH. n=3 replicates per group. p values were determined by using a two-tailed Student’s t test. (D) Lactate-excretion rates decrease when MDH1 or GPD1/GPD1L are overexpressed. n=3 replicates per experimental group. p values were determined by using a one-way analysis of variance (ANOVA) followed by Dunnett’s test. (E) Proliferation rate of PC3 cells before and after overexpression of MDH1 or GPD1/GPD1L. n=3 replicates per experimental group. p values were determined by using a one-way ANOVA followed by Dunnett’s test. (F) Western blots for MDH1 and GPD1L in PC3 cells after MDH1 or GPD1L knockdown. GPD1 is not shown because its levels were below detection prior to knockdown. (G and H) Knocking down MDH1 (G) or GPD1L (H) in PC3 cells decreases MDH1 and GPD1/GPD1L activities. MDH1 and GPD1/GPD1L activities were determined as in (B) and (C). (I and J) Lactate-excretion rates in PC3 cells are increased after MDH1 (I) or GPD1L (J) knockdown. Control cells were administered scrambled siRNA. n=9 replicates per experimental group for panel (I). n=10 replicates per experimental group for panel (J). p values were determined by using a two-tailed Student’s t test. (K and L) Proliferation rate of PC3 cells decreases when MDH1(K) and GPD1L (L) is knocked down. n=3 replicates per experimental group. p values were determined by using a two-tailed Student’s t test. (M) Lactate-excretion rate decreases when PC3 cells are given 0.5 mM AKB. n=3 replicates per experimental group. p values were determined by using a two-tailed Student’s t test. (N) Proliferation rate increases when PC3 cells are given 0.5 mM AKB. n=3 replicates per experimental group. p values were determined by using a two-tailed Student’s t test. Error bars denote standard error. *p≤0.05, **p≤0.001, ***p≤0.001, n.s.>0.05 Ctrl, control; OE, overexpression; KD, knockdown; Lac, lactate; Glc, glucose; GAP, glyceraldehyde 3-phosphate; G3P, glycerol 3-phosphate; DHAP, dihydroxyacetone phosphate; AKB, alpha-ketobutyrate.
Figure 3:
Figure 3:. Saturating MDH1 and GPD1/GPD1L drives lactate production
(A) Transfecting H-Ras (G12V) into non-transformed 3T3 cells results in detectable H-Ras (G12V) protein expression. (B) Non-transformed 3T3 cells are contact inhibited when grown to confluency, but H-Ras 3T3 cells are no longer sensitive to contact inhibition. n=3 replicates per group. (C and D) Overexpressing MDH1 (C) and GPD1 (D) in H-Ras 3T3 cells increases MDH1 and GPD1/GPD1L activities, respectively. Control cells overexpressed GFP instead of a dehydrogenase. MDH1 activities was determined by the fraction of [2-2H] malate normalized to the fraction of [1-2H] GAP. GPD1/GPD1L activities was determined by the fraction of [1,2-2H] G3P normalized to the fraction of [1-2H] DHAP and [4-2H] NADH. n=3 replicates per group. p values were determined by using a two-tailed Student’s t test. (E) Lactate-excretion rates decrease when MDH1 or GPD1 is overexpressed in H-Ras 3T3 cells. Control cells overexpressed GFP instead of a dehydrogenase. n=3 replicates per experimental group. p values were determined by using a one-way ANOVA followed by Dunnett’s test. (F) Relative glycolytic activity in H-Ras 3T3 cells as a function of 2DG concentration. Glycolytic activity was determined by the fraction of M+1 GAP during [4-2H] glucose labeling. n=3 replicates per 2DG concentration. (G) Relative fluxes of MDH1, GPD1/GPD1L, and LDH as a function of glycolytic activity in H-Ras 3T3 cells. Glycolytic activities were derived from (F). MDH1 activity was determined by the fraction of [2-2H] malate normalized to the fraction of [1-2H] GAP. GPD1/GPD1L activity was determined by the fraction of [1,2-2H] G3P normalized to the fraction of [1-2H] DHAP and [4-2H] NADH. LDH activity was determined by the amount of lactate excreted over time. Data were fit with a logistic function. The R2 value is the coefficient of determination. n = 3 replicates per experimental group. (H) First derivatives of MDH1, GPD1/GPD1L, and LDH activities in H-Ras 3T3 cells. Calculations were based on the fitted equations shown in (G). (I) Relative glycolytic activity in non-transformed proliferating 3T3 cells as a function of 2DG concentration. Glycolytic activity was determined by the fraction of M+1 GAP during [4-2H] glucose labeling. n=3 replicates per 2DG concentration. (J) Relative fluxes of MDH1, GPD1/GPD1L, and LDH as a function of glycolytic activity in non-transformed proliferating 3T3 cells. Glycolytic activities were derived from (I). MDH1 activity was determined by the fraction of [2-2H] malate normalized to the fraction of [1-2H] GAP. GPD1/GPD1L activity was determined by the fraction of [1,2-2H] G3P normalized to the fraction of [1-2H] DHAP and [4-2H] NADH. LDH activity was determined by the amount of lactate excreted over time. Data were fit with a logistic function. The R2 value is the coefficient of determination. n=3 replicates per experimental group. Error bars denote standard error. *p≤0.05, **p≤0.001, ***p≤0.001, n.s.>0.05. Ctrl, control; OE, overexpression; KD, knockdown; Lac, lactate; Glc, glucose; GAP, glyceraldehyde 3-phosphate; G3P, glycerol 3-phosphate; DHAP, dihydroxyacetone phosphate.
Figure 4:
Figure 4:. Increased LDHA expression supports elevated lactate production when MDH1 and GPD1/GPD1L are saturated
Levels of MDH1 (A and E), GPD1 (B and F), and GPD1L (C and G) mRNA are minimally changed when glycolytic flux is above 60% of its unattenuated value. By contrast, the expression level of LDHA (D and H) is significantly increased over the same conditions. n=6 replicates per experimental group in panel (A)-(D). n=3 replicates per experimental group in panel (E)-(H). p values were determined by using a one-way ANOVA followed by Dunnett’s test. Data are shown for H-Ras transformed 3T3 cells (A-D) and non-transformed proliferating 3T3 cells (E-H). Error bars denote standard error. *p≤0.05, ****p≤0.0001, n.s.>0.05.
Figure 5:
Figure 5:. Absolute quantitation of NAD+ regeneration fluxes
(A) Schematic of our model used to calculate fluxes from [4-2H] glucose labeling. (B) Fraction of labeled GAP in H-Ras 3T3 cells as a function of time after introducing [4-2H] glucose. n=3 replicates per time point. (C) Fraction of labeled M+1 G3P, labeled M+2 G3P, labeled M+1 malate, and labeled M+1 lactate in H-Ras 3T3 cells as a function of time after introducing [4-2H] glucose. n=3 replicates per time point. (D) Fraction of unlabeled malate, G3P, and lactate in H-Ras 3T3 cells as a function of time after introducing [4-2H] glucose. The measured metabolite concentrations, the rate of glucose consumption, the rate of lactate excretion, and Equations 1, 2, 3, and 4 were used to find the best model fit from which the activities of MDH1, GPD1/GPD1L, and LDH were determined. n=3 replicates per experimental group. (E) Proportion of glycolysis-derived NADH oxidized by MDH1, GPD1/GPD1L, and LDH in H-Ras 3T3 cells as a function of glycolytic activity. Calculations were based on the fitted curve shown in Figure S6B. (F) Proportion of glycolysis-derived NADH oxidized by MDH1, GPD1/GPD1L, and LDH in multiple cell lines. Actual flux values of MDH1, GPD1/GPD1L, and LDH were determined by the measured metabolite concentrations, the rate of glucose consumption, the rate of lactate excretion, and Equations 1, 2, 3, and 4. Error bars denote standard error. GAP, glyceraldehyde 3-phosphate; G3P, glycerol 3-phosphate; DHAP, dihydroxyacetone phosphate.
Figure 6:
Figure 6:. MDH1 is not saturated in non-proliferating cells
(A) Comparison of the rate of glucose consumption and lactate excretion between proliferating and quiescent 3T3 cells. n=3 replicates for each group. Error bars denote standard error. p values were determined by using a two-tailed Student’s t test. ***p≤0.001. (B) Comparison of lactate-excretion rates between proliferating and quiescent 3T3 cells. n=3 replicates per group. Error bars denote standard error. p values were determined by using a two-tailed Student’s t test. ***p≤0.001. (C) Relative glycolytic activity in quiescent cells as a function of 2DG concentration. Glycolytic activity was determined by the fraction of M+1 GAP during [4-2H] glucose labeling. n=3 replicates per 2DG concentration. Error bars denote standard error. (D) Fluxes of MDH1, GPD1/GPD1L, and LDH as a function of glycolytic activity in quiescent cells. Glycolytic activities were derived from (C). Flux values of MDH1, GPD1/GPD1L, and LDH were determined by the measured metabolite concentrations, the rate of glucose consumption, the rate of lactate excretion, and Equations 1, 2, 3, and 4. Data were fit with a logistic function. Error bars show the interquartile range of the Monte Carlo simulated fluxes. Lac, lactate; Glc, glucose.

Comment in

References

    1. Ahn CS, and Metallo CM (2015). Mitochondria as biosynthetic factories for cancer proliferation. Cancer Metab 3, 1. - PMC - PubMed
    1. Alkan HF, Walter KE, Luengo A, Madreiter-Sokolowski CT, Stryeck S, Lau AN, Al-Zoughbi W, Lewis CA, Thomas CJ, Hoefler G, et al. (2018). Cytosolic Aspartate Availability Determines Cell Survival When Glutamine Is Limiting. Cell Metab 28, 706–720.e706. - PMC - PubMed
    1. Birsoy K, Wang T, Chen WW, Freinkman E, Abu-Remaileh M, and Sabatini DM (2015). An Essential Role of the Mitochondrial Electron Transport Chain in Cell Proliferation Is to Enable Aspartate Synthesis. Cell 162, 540–551. - PMC - PubMed
    1. Borst P (2020). The malate-aspartate shuttle (Borst cycle): How it started and developed into a major metabolic pathway. IUBMB Life 72, 2241–2259. - PMC - PubMed
    1. Brand K, Leibold W, Luppa P, Schoerner C, and Schulz A (1986). Metabolic alterations associated with proliferation of mitogen-activated lymphocytes and of lymphoblastoid cell lines: evaluation of glucose and glutamine metabolism. Immunobiology 173, 23–34. - PubMed

Publication types