. 2022 Aug 16;13(1):4814.
doi: 10.1038/s41467-022-32430-w.

Single cell spatial analysis reveals the topology of immunomodulatory purinergic signaling in glioblastoma

Affiliations

Single cell spatial analysis reveals the topology of immunomodulatory purinergic signaling in glioblastoma

Shannon Coy et al. Nat Commun. .

Abstract

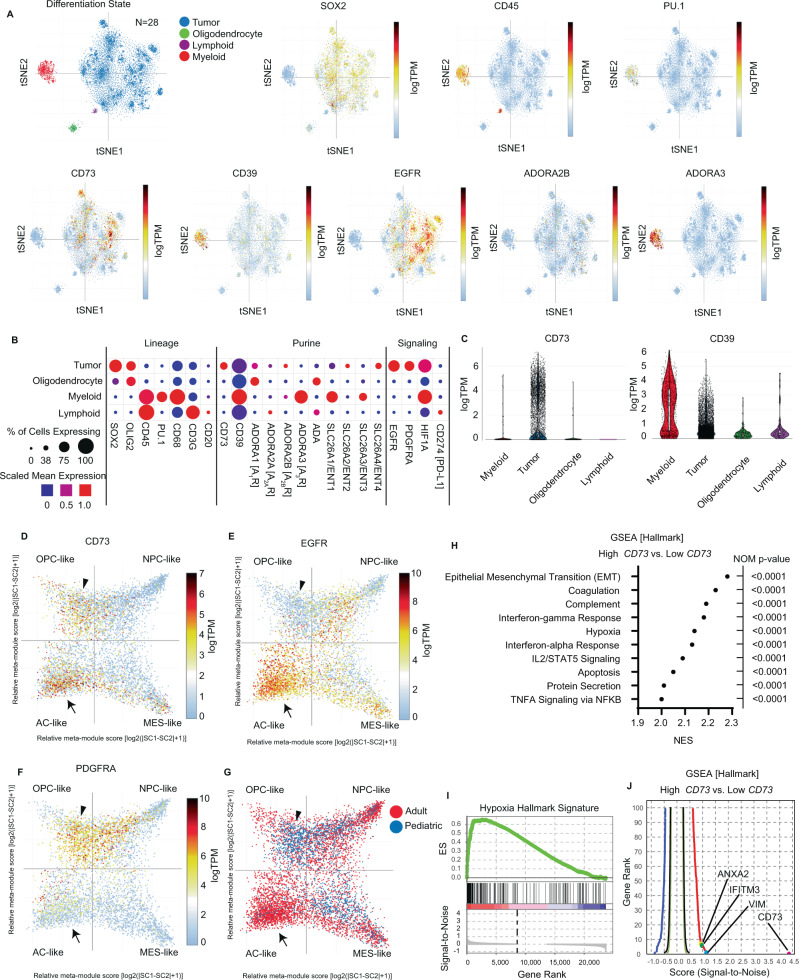
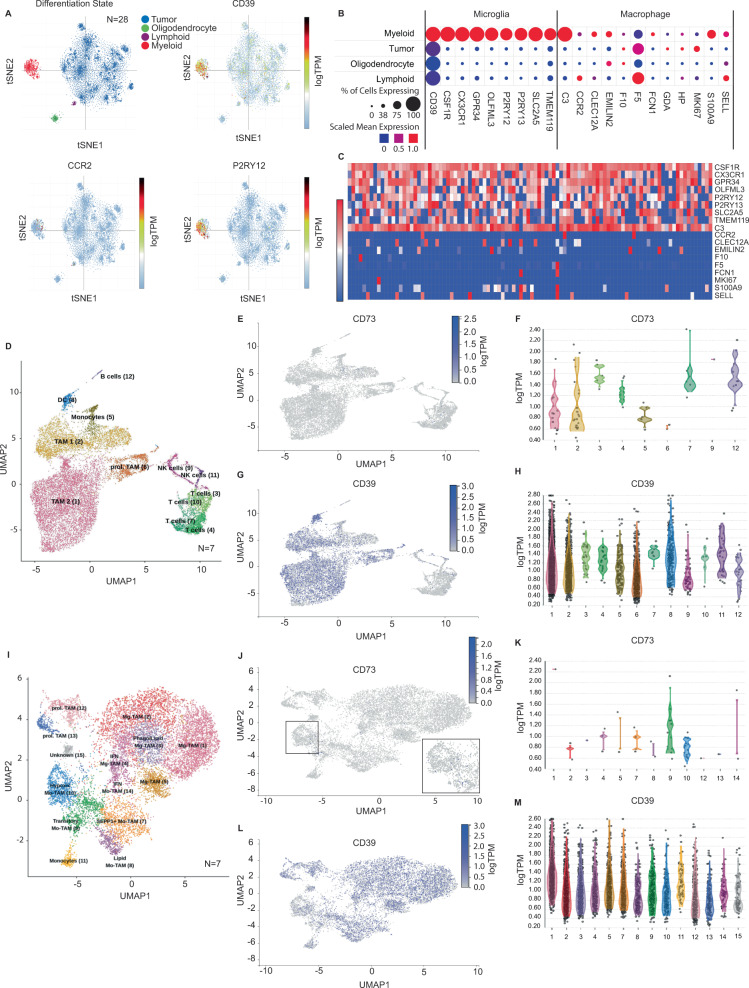
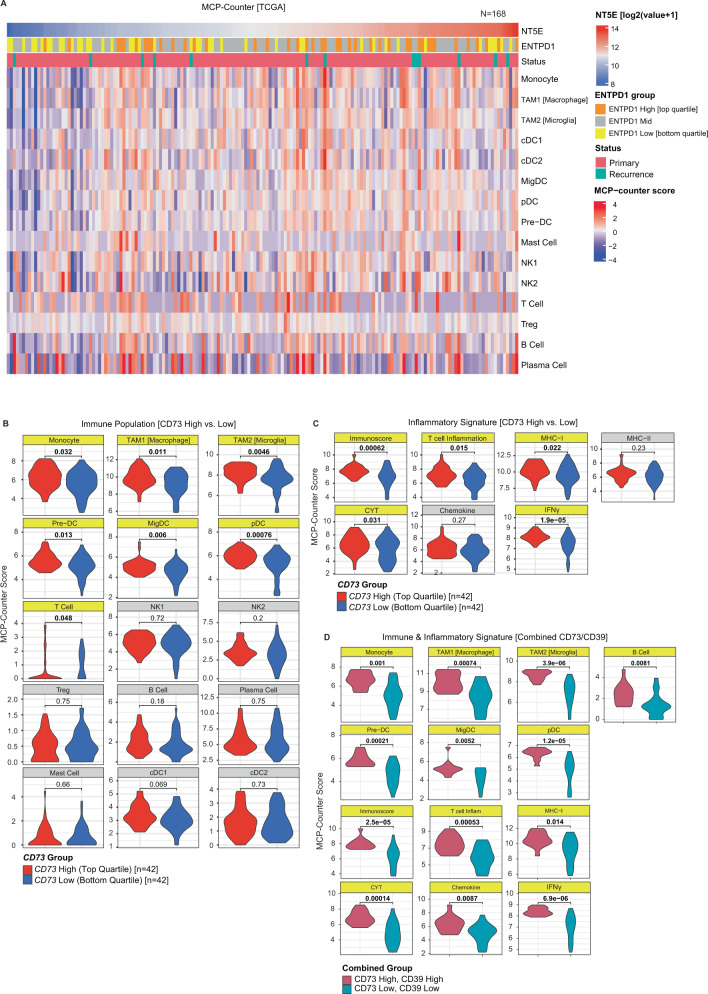
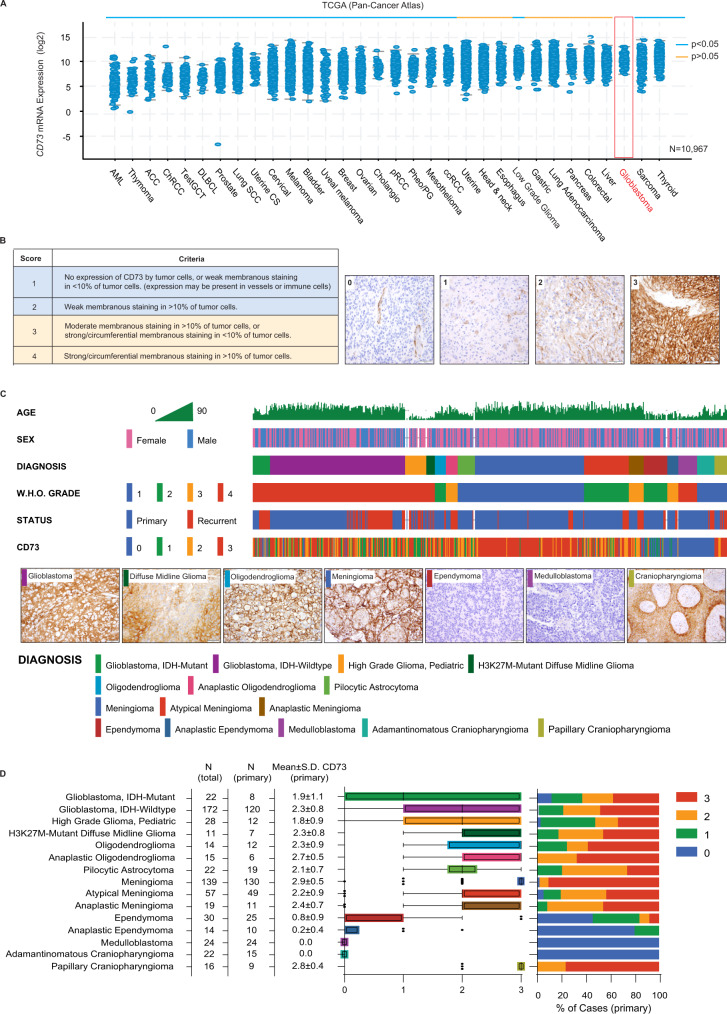
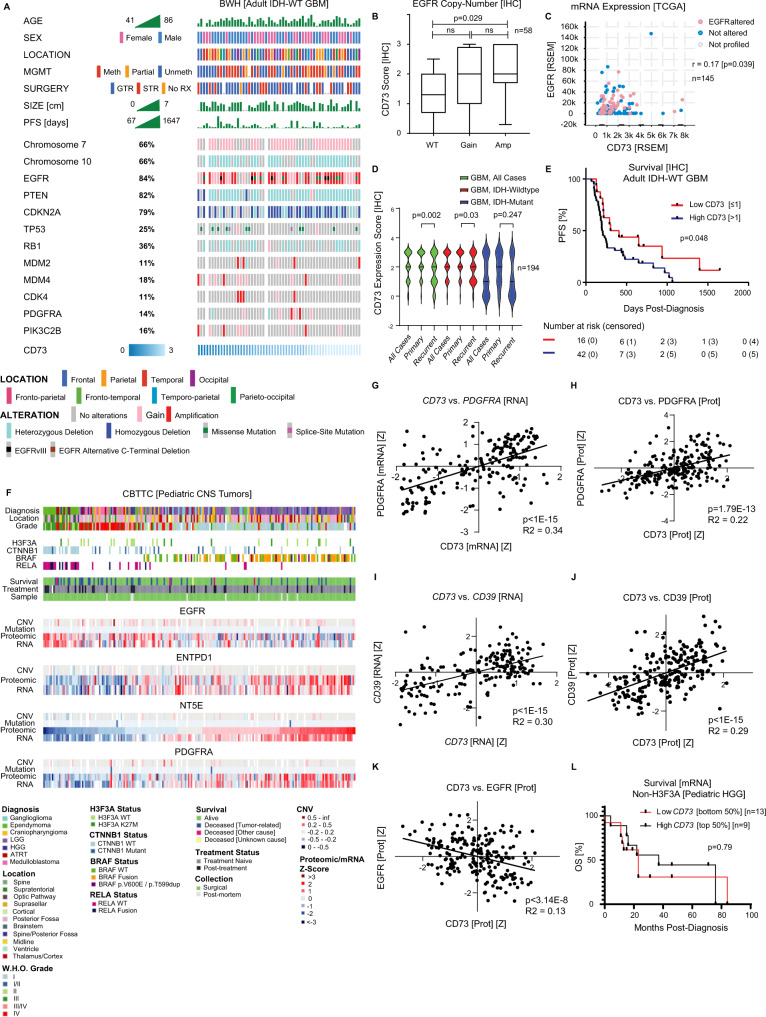
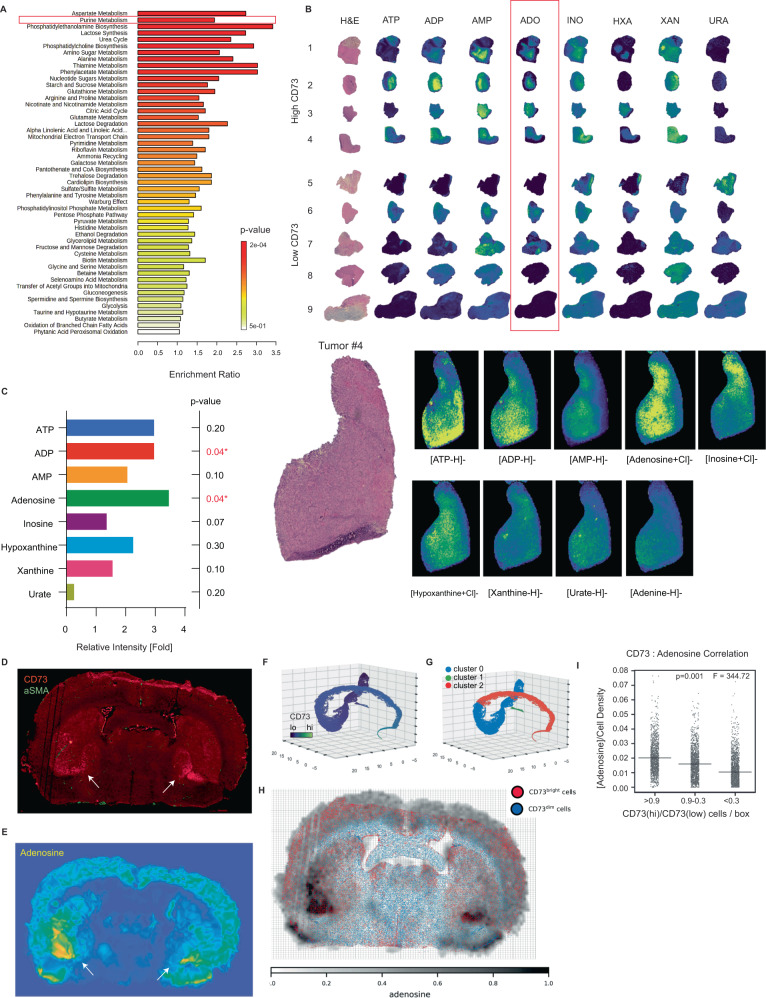
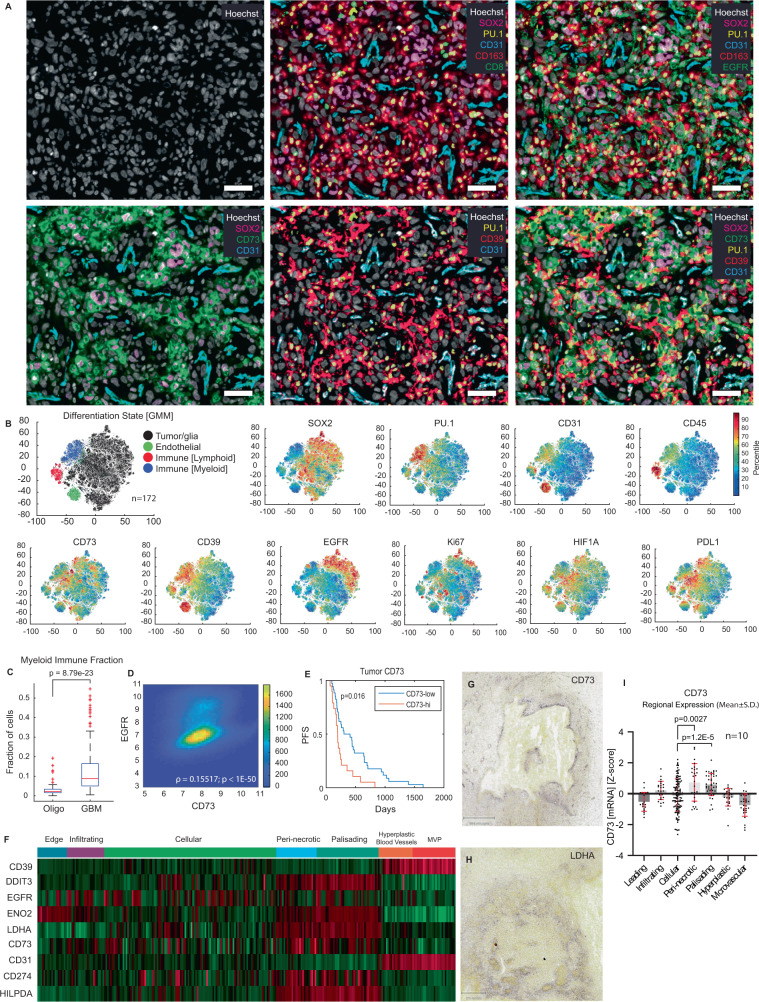
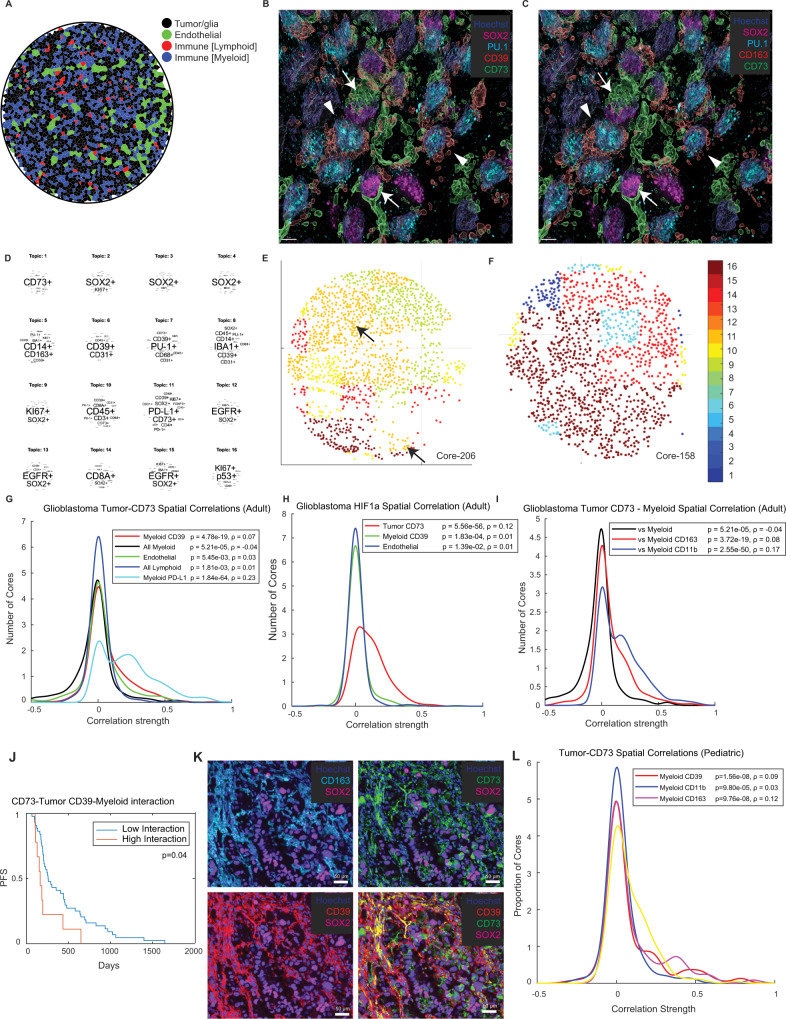
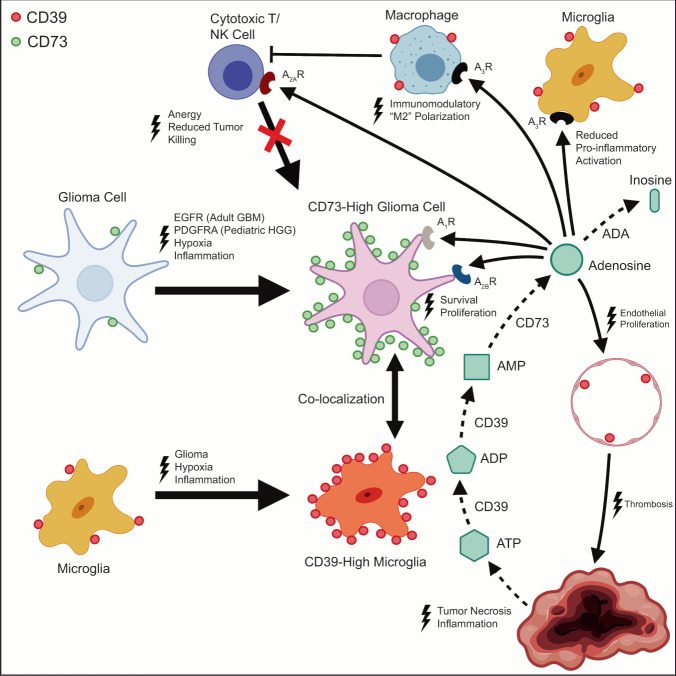
How the glioma immune microenvironment fosters tumorigenesis remains incompletely defined. Here, we use single-cell RNA-sequencing and multiplexed tissue-imaging to characterize the composition, spatial organization, and clinical significance of extracellular purinergic signaling in glioma. We show that microglia are the predominant source of CD39, while tumor cells principally express CD73. In glioblastoma, CD73 is associated with EGFR amplification, astrocyte-like differentiation, and increased adenosine, and is linked to hypoxia. Glioblastomas enriched for CD73 exhibit inflammatory microenvironments, suggesting that purinergic signaling regulates immune adaptation. Spatially-resolved single-cell analyses demonstrate a strong spatial correlation between tumor-CD73 and microglial-CD39, with proximity associated with poor outcomes. Similar spatial organization is present in pediatric high-grade gliomas including H3K27M-mutant diffuse midline glioma. These data reveal that purinergic signaling in gliomas is shaped by genotype, lineage, and functional state, and that core enzymes expressed by tumor and myeloid cells are organized to promote adenosine-rich microenvironments potentially amenable to therapeutic targeting.


Conflict of interest statement

M.T. has a consulting or advisory role with Agios Pharmaceutical, Integragen, and Taiho Oncology, and research funding from Sanofi. P.K.S. is a member of the SAB or BOD member of Applied Biomath, RareCyte Inc., and Glencoe Software; P.K.S. is also a member of the NanoString SAB and a consultant for Montai Health and Merck. In the last five years the Sorger lab has received research funding from Novartis and Merck. KLL is supported by Eli Lilly and BMS, consults for BMS, Integragen, Travera LLC, is on the SAB of Integragen and Rarecyte, and holds equity in Travera LLC. P.B. receives grant funding from Novartis Institute of Biomedical Research and Deerfield, and consults for QED Therapeutics, for unrelated projects. P.Y.W. has research support from Agios, Astra Zeneca, Medimmune, Celgene, Eli Lilly, Genentech, Roche, Kazia, MediciNova, Merck, Novartis, Nuvation Bio, Chimerix, Vascular Biogenics, and VBI Vaccines. P.W. is on the advisory boards of Agios, Astra Zeneca, Black Diamond, Boston Pharmaceuticals, Chimerix, CNS Pharmaceuticals, Elevate Bio, Imvax, Karyopharm, Merck, Mundipharma, Novocure, Novartis, Nuvation Bio, Prelude Therapeutics, Vascular Biogenics, VBI Vaccines, Voyager, and QED. RareCyte manufactured instruments used for tissue imaging and Glencoe developed the OMERO Database used for image informatics. P.K.S. and S.S. declare that none of these relationships have influenced the content of this manuscript. The remaining authors declare no competing interests.

Figures

Fig. 1
Fig. 1. State-specific expression of core purinergic effectors in glioblastoma.
A Single-cell RNA-sequencing data from 21 adult IDH-wildtype human glioblastomas and 7 pediatric high-grade gliomas encompassing 24,131 cells were analyzed for core purine regulators, lineage-specific markers, and related biomarkers. Cells were clustered as previously described (Neftel et al.) into lineage categories by multi-gene expression signatures using t-distributed stochastic neighbor embedding (t-SNE). A, B Lineage differentiation was validated by canonical cell type-specific markers, including SOX2 (tumor), PTPRC/CD45 (pan-immune), SPI1/PU.1, CD68 (myeloid), OLIG2 (oligodendrocyte) and CD3G/CD3, MS4A1/CD20 (lymphoid). AC CD73 was predominantly expressed by tumor cells (35.9% of tumor cells; 1.19 scaled-mean expression), with only rare expression in myeloid (2.5% of cells; 0.06 mean-expression) or other cell types. CD39 was expressed by all lineages, with higher expression in myeloid cells (98.3% of cells; 2.16 mean-expression). Regarding adenosine receptors, ADORA1/A1R was predominantly expressed by oligodendroglia, ADORA2A/A2AR by lymphoid and tumor cells, ADORA2B/A2BR by tumor cells, and ADORA3/A3R by myeloid cells. Adenosine deaminase (ADA) was more strongly expressed by oligodendroglia and lymphoid cells. Myeloid cells predominantly expressed ENT1/3, while tumor cells expressed ENT2/4. DF Tumor cells were clustered according to differentiation state (Neftel et al.) into astrocyte-like (AC-like), mesenchymal-like (MES-like), oligodendroglial progenitor cell-like (OPC-like), and neural progenitor cell-like (NPC-like) signatures (meta-modules) using relative expression of each multi-gene signature (relative meta-module score). CD73 expression was predominantly focused in two clusters: an AC-like cluster associated with EGFR expression (arrow), and an OPC-like cluster associated with PDGFRA expression (arrowhead), with only scattered NPC-like or MES-like cells expressing CD73. G CD73 expressing cells in the AC-like cluster were predominantly derived from adult glioblastomas, while OPC-like cells were predominantly derived from pediatric high-grade gliomas. HJ Gene-set enrichment analysis (GSEA) of tumor cells with the highest (top 1%) vs. lowest (1%) CD73 expression showed multiple significantly enriched pathways (Nominal p < 0.0001, GSEA (Kolmogorov-Smirnov test, unpaired, one-sided)) including epithelial-to-mesenchymal transition (EMT), interferon (α/γ) response, and hypoxia most strongly associated with high CD73 expression, with core genes from each pathway represented among the most enriched genes.
Fig. 2
Fig. 2. CD39 is associated with tumor-associated microglia and myeloid cells in glioblastoma.
A, B Analysis of single-cell RNA-sequencing data from 21 adult IDH-wildtype human glioblastomas and 7 pediatric high-grade gliomas (24,131 cells) showed that most myeloid cells expressed genes associated with microglia (e.g., P2RY12/13, CX3CR1, TMEM119, and SLC2A5), rather than peripherally-derived macrophages (e.g., CCR2, F10, and CLEC12A). C Myeloid cells with the highest CD39 expression (top-100 cells shown) demonstrated microglial gene expression signatures. D Single-cell RNA-sequencing data from FACS-sorted CD45-positive immune cells from a second cohort of 7 newly-diagnosed and 4 recurrent/residual adult glioblastomas (21,303 and 42,870 cells, respectively) (Pombo Antunes et al.), were clustered using uniform manifold approximation and projection (UMAP) by cell lineage (TAM = tumor-associated macrophage; TAM1 = peripheral macrophage, TAM2 = microglia, prol; TAM = proliferative TAM; DC = dendritic cell). E, F These data showed only rare CD73-expressing immune cells (0.5%), with the greatest number of myeloid cells (groups 1,2). G, H CD39 exhibited broad expression in immune populations, with the greatest enrichment in TAM2 (microglia) and TAM1 (peripheral macrophages), and dendritic cells (groups 1,2,8). I Tumor-associated myeloid cells were then clustered by functional sub-group according to gene expression (Mo-TAM = monocytic TAM; Mg-TAM = microglial TAM; prol. TAM = proliferative TAM). J, K CD73 expression was rare in tumor-associated myeloid cells (0.4% of cells) but showed the greatest relative abundance in hypoxic and transitory TAM (groups 9,10). L, M CD39 expression was present in all TAM sub-groups, but most strongly enriched in microglial TAM (group 1). (lineage clusters without any detected cells are not represented in F, H, K, M).
Fig. 3
Fig. 3. CD73 and CD39 are associated with inflammatory signatures in glioblastoma.
A To better understand the inflammatory landscape of glioblastoma, bulk mRNA-sequencing data from 168 adult glioblastomas (TCGA) were deconvolved by Microenvironment Cell Population-Counter (MCP-Counter) to estimate the relative abundance of tumor and immune populations and correlate with purine regulatory enzymes and inflammatory signaling signatures. Analysis of all glioblastoma cases showed a positive correlation between CD73 and CD39 expression, and trend of greater numbers of most immune populations in CD73-high samples. B Comparison of cases with high CD73 expression (top-quartile, n = 42), and those with low expression (bottom-quartile, n = 42), showed that high levels were significantly (p < 0.05, Wilcoxon test, unpaired, two-sided) associated with a greater relative density of myeloid (naïve monocyte, TAM1 (macrophage), TAM2 (microglial)), dendritic (plasmacytoid dendritic cells (pDC) and pre-dendritic cells (pre-DC)), and T-cell populations, with no significant difference in NK, B cell, T regulatory cells, plasma cells, classical dendritic cell (cDC1/2), or mast cell populations. C Bulk analysis of gene signatures associated with inflammatory signaling showed that tumors with high CD73 expression exhibited significantly higher inflammation, including elevation of signatures associated with interferon-γ, MHC-I, Immunoscore, cytolytic (CYT), and T cell inflammatory pathways (p < 0.05, Wilcoxon test, unpaired, two-sided). D We noted that cases with coordinate expression of CD73 and CD39 showed particularly pronounced changes in immune populations and signaling. Direct comparison of CD73hiCD39hi tumors with CD73loCD39lo tumors showed an even more strongly significant relative enrichment of myeloid (monocyte, TAM1, TAM2), dendritic (pre-DC, migDC, pDC), and B cell populations in CD73hiCD39hi tumors) (p < 0.05, Wilcoxon test, unpaired, two-sided), as well as greater elevation of inflammatory signaling (T cell, MHC-I, IFN-γ, and chemokine) (p < 0.05, Wilcoxon test, unpaired, two-sided).
Fig. 4
Fig. 4. CD73 exhibits distinctive expression patterns in glioblastoma and other central nervous system tumors.
A Bulk CD73 mRNA expression was assessed in tumor tissue (n = 10,967) from 32 cancer subtypes (TCGA). Glioblastoma (red box) exhibited significantly higher CD73 expression (p < 0.05, blue bar, t-test, unpaired, two-sided, with Welch’s correction; see Supplementary Data 3 for precise values) relative to most tumor sub-types. B CD73 immunohistochemistry was performed on a cohort of 605 independent human CNS tumors from the BWH archives and Children’s Brain Tumor Tissue Consortium (CBTTC), including each major subtype and multiple tumors which have not been systematically evaluated for CD73 expression previously (oligodendroglioma, meningioma, ependymoma, craniopharyngioma, medulloblastoma, pediatric glioma). Each tumor in the larger cohort was stained once. Following qualitative evaluation of the specimens by a pathologist, semi-quantitative (0–3) immunohistochemistry (IHC) index scoring criteria were defined to characterize and compare membranous CD73 protein expression in these tumors (representative staining for each score in glioblastoma specimens are depicted in the right-panels); scale bars 50 µm. C This scoring system was then applied to the full cohort of 604 CNS tumors, demonstrating distinct expression patterns in each histologic subtype (representative staining from cases of major subtypes are demonstrated); scale bars 50 µm (except for craniopharyngioma 100μm). D IDH-mutant [n = 22] and IDH-wildtype [n = 172] adult glioblastomas, H3K27M-mutant diffuse midline glioma [n = 11] and pediatric high-grade glioma [n = 28], pilocytic astrocytomas [n = 22], and oligodendrogliomas [n = 29] frequently exhibited strong (IHC  ≥  2) CD73 expression. Medulloblastomas of all histologic and molecular subtypes [n = 24] and ependymomas [n = 44], exhibited minimal CD73 expression. Adamantinomatous craniopharyngiomas exhibited no CD73 expression in the tumor epithelium but consistently strong expression in peri-tumoral fibrovascular stroma [n = 22], while papillary craniopharyngiomas exhibited strong epithelial/tumor CD73 expression in all cases [n = 16]; middle panel uses a Tukey box-and-whisker plot with midline = median, box limits = Q1 (25th percentile)/Q3 (75th percentile), whiskers = 1.5 inter-quartile range (IQR), dots = outliers (>1.5IQR)).
Fig. 5
Fig. 5. CD73 expression correlates with genotype and clinical outcome in glioblastoma.
A To explore the genetic and clinical features associated with CD73 expression in glioblastoma, we evaluated a sub-cohort of 58 primary IDH-wildtype human glioblastoma from the BWH cohort with associated genome-wide chromosomal copy-number (array comparative genomic hybridization (ACGH)), 447-gene targeted exome sequencing (Oncopanel), MGMT promoter methylation analysis, and clinicopathologic data. These data showed a typical genomic profile for adult IDH-WT glioblastoma, with frequent polysomy 7, monosomy 10, EGFR gain/amplification, PTEN, CDKN2A, TP53 loss, and other recurrent alterations. B Correlation of CD73 and a wide variety of recurrent genomic alterations was principally notable for a significant association between EGFR gene amplification and CD73 protein expression (n = 58, p = 0.0029, t-test, unpaired, two-sided); Tukey box-and-whisker plot with midline = median, box limits = Q1 (25th percentile)/Q3 (75th percentile), whiskers = 1.5 inter-quartile range (IQR), dots = outliers (>1.5IQR)). C Analysis of bulk mRNA expression in a broader cohort of IDH-WT glioblastoma cases (TCGA, n = 145) validated these findings, showing a weakly significant (p = 0.03, r = 0.17, Pearson’s correlation test, unpaired, two-sided) direct correlation between CD73 and EGFR levels. D In the full GBM cohort (n = 194), mean CD73 protein expression level (by IHC score) was higher in primary (n = 128, mean = 2.2) vs. recurrent tumors (n = 66, mean = 1.8) (p = 0.002, t-test, unpaired, two-sided, line indicates median) and this relationship was also significant in primary IDH-WT tumors (n = 120, mean = 2.3) vs. recurrent/residual IDH-WT tumors (n = 52, mean = 1.9) (p = 0.03, t-test, unpaired, two-sided) but not primary (n = 8, mean = 1.9) vs. recurrent (n = 14, mean = 1.2) IDH-mutant GBM (p = 0.247, t-test, unpaired, two-sided). E Mantel–Cox Log-Rank survival analysis showed that elevated CD73 protein expression (by IHC) was associated with significantly (p = 0.048) shorter progression-free survival (PFS) in adult IDH-WT glioblastoma. F We next assessed a cohort of 102 pediatric tumor specimens from the Children’s Brain Tumor Network (CBTN), including most major tumor subtypes. Strong CD73 expression was present in gliomas and glioneuronal tumors, including H3K27M-mutant diffuse midline glioma, with minimal expression in medulloblastomas, ATRT, and ependymoma. GJ Across pediatric CNS tumors, CD73 expression was positively correlated with PDGFRA at the mRNA (p < 1e−15, t-test, unpaired, two-sided) and protein levels (1.79e−13; t-test, unpaired, two-sided), as well as CD39 mRNA (p < 1e−15, t-test, unpaired, two-sided) and protein (p < 1e−15; t-test, unpaired, two-sided). K Unlike adult glioblastoma, there a negative correlation with EGFR (p = 3.14e−8, t-test, unpaired, two-sided)). L Mantel–Cox Log-Rank survival analysis showed no significant difference in survival between non-H3F3A-mutated pediatric HGG with higher and lower expression of CD73 (top 50% vs. bottom 50%) (p = 0.79).
Fig. 6
Fig. 6. CD73 is associated with elevated adenosine levels in glioblastoma.
A Mass spectrometry metabolomic profiling (MALDI-MSI) of frozen tissue from 9 IDH-wildtype glioblastoma resections showed that purine metabolism was among the most significantly enriched pathways (p < 0.001, t-test, unpaired, two-sided). B, C CD73 IHC performed on these samples showed that 4 cases exhibited high CD73 expression, while 5 cases exhibited low CD73 expression. Spatially-resolved analysis of all purine metabolites in these cases showed that adenosine was the most significantly elevated metabolite in tumor tissue in cases with high CD73 compared to those with low expression (3.5-fold, p = 0.04, t-test, unpaired, two-sided). ADP levels were also significantly elevated in these tumors (p = 0.04, t-test, unpaired, two-sided). D, E To further assess the association of CD73 and adenosine in CNS tissue, we performed immunofluorescence and spatially-resolved mass spectrometry on serial whole-mount murine coronal brain sections. CD73 and adenosine showed a similar distribution, with the greatest levels in the basal ganglia (arrows), with weaker expression in the cortical gray matter and minimal white matter expression. F Matched sections were spatially-registered and cells were segmented and clustered by 3D-embedded uniform manifold approximation and projection (UMAP). G Single-cell analysis revealed clusters associated with high (cluster 2) and low (cluster 0) CD73 expression, as well as αSMA-positive vascular cells (cluster 1). H Registered IF/MS maps were evaluated for cell-density corrected correlation between adenosine and CD73 in all brain regions. I This analysis demonstrated a strongly significant spatial correlation between CD73 and adenosine levels (p = 0.001, F = 344.72, Tukey’s HSD test, unpaired, one-sided).
Fig. 7
Fig. 7. Multiplexed single cell analysis of glioblastoma tissue.
A 36-plex tissue-based cyclic immunofluorescence (CyCIF) encompassing core lineage, signaling, immune, and purine pathway components was performed on a tissue microarray including 172 IDH-WT glioblastoma tissue specimens (representative CyCIF images from one glioblastoma case are shown; each tumor specimen in the microarray cohort underwent one CyCIF staining experiment); scalebars 50 μm. B Cells were segmented and fluorescence intensity was quantified for each marker at a single-cell level. Cells were clustered by marker expression in an unbiased fashion using Gaussian mixture modeling (GMM) showing four dominant signatures, which were validated by evaluation of lineage-specific markers. As with transcriptomic analyses, CD73 was predominantly expressed by tumor cells (SOX2+), while CD39 was predominantly expressed by myeloid (PU.1+) and endothelial (CD31+) cells. Cells were colored by the percentile of signal intensity for each marker. C Immune profiling showed that a substantial proportion of all cells in IDH-WT glioblastoma (n = 172 tumors) were myeloid cells, which comprise the dominant immune population. There were significantly greater numbers of myeloid cells in glioblastoma compared to low grade oligodendrogliomas (n = 14 tumors) (p = 8.79e−23, Wilcoxon rank sum test, unpaired, two-sided), suggesting a greater degree of immune activation in these tumors; Tukey box-and-whisker plot with midline = median, box limits = Q1 (25th percentile)/Q3 (75th percentile), whiskers = 1.5 inter-quartile range (IQR), dots = outliers (>1.5IQR)). D Single-cell analysis of functional markers showed that EGFR protein expression was strongly correlated with CD73 expression (p < 1e−50, t-test on Z-transformed Pearson correlation, unpaired, two-sided). E Mantel–Cox Log-Rank survival analysis showed that higher mean levels of CD73 by single-cell CyCIF analysis correlated with significantly shorter PFS (p = 0.016). F To assess the relationship between CD73 and hypoxia in glioblastoma tissue, we first evaluated mRNA expression of CD73, CD39, and hypoxia-response genes (DDIT3, ENO2, LDHA, HILPDA) in curated histologic regions in the Ivy-GAP glioblastoma RNA-seq dataset (n = 10 tumors). This analysis showed that CD73 was enriched in regions of palisading tumor necrosis and peri-necrotic tumor associated with high levels of hypoxia-response genes. CD39 expression was present in all regions but showed stronger expression in regions of pathognomonic microvascular proliferation (MVP). G, H These results were validated by review of images of in-situ hybridization of tumor tissue, showing accentuation of CD73 and LDHA signal in peri-necrotic hypoxic regions (for example, ISH from representative glioblastoma specimens are shown, one round of ISH was performed on cohorts of 37 independent glioblastomas (NT5E) and 29 glioblastomas (LDHA), with similar results across independent specimens (see https://glioblastoma.alleninstitute.org/ish)); scalebars: G 994 μm, H 576 μm. I Peri-necrotic (p = 0.0027, t-test, unpaired, two-sided, with Welch’s correction) and palisading (p = 1.2e−5, t-test, unpaired, two-sided, with Welch’s correction) regions exhibited significantly higher CD73 than cellular tumor regions (data derived from 10 adult glioblastoma specimens)).
Fig. 8
Fig. 8. Spatial patterning of core purine regulators in adult glioblastoma and pediatric high-grade glioma.
A Given the apparent spatial coordination of CD73, adenosine, and functional states such as hypoxia, we sought to better understand the precise spatial landscape of purinergic signaling in glioblastoma. Segmentation and Voronoi visualization of each cell type revealed an apparent non-random distribution of cells closely intermingled tumor and myeloid cells. B, C 18-plex cyclic multiplexed immunofluorescence (CyCIF) of an adult glioblastoma specimen with high-resolution deconvolution imaging and 3D reconstruction using a Deltavision Elite microscope confirmed close spatial co-localization of SOX2-positive tumor-associated CD73 (arrows) and PU.1/CD163-positive myeloid cell-associated CD39 proteins (arrowheads, representative region shown, CyCIF was performed once); scale bars 5 μm. D Latent Dirichlet Association (LDA) probabilistic modeling was used to globally analyze CyCIF data from the larger dataset of 172 IDH-WT glioblastoma to reduce cell populations into neighborhoods (“topics”) defined by single-cell marker-expression patterns. This confirmed the presence of prominent neighborhoods with a spatial association between tumor (SOX2), myeloid (CD163/PU.1), and core purine regulators (CD39, CD73) (Topic 11), as well as other neighborhoods corresponding to various tissue niches. E, F Glioblastomas are heterogeneous collections of intermixed cellular neighborhoods, including large niches with prominent tumor-CD73:myeloid-CD39 interaction (E, arrows). G To assess the strength of this spatial correlation, we next performed spatial statistics analysis, showing that tumor CD73 is strongly associated with myeloid CD39 (p = 4.78e−19, Pearson’s correlation test, unpaired, two-sided) and PD-L1 protein (p = 1.84e−64), but less so with endothelial or lymphoid cells and myeloid cells themselves. H, I Tumor CD73 was also correlated (p = 5.56e−56, Pearson’s correlation test, unpaired, two-sided) with regions of elevated nuclear HIF1A expression, and myeloid cells (PU.1-positive) with coordinate CD163 (p = 3.72e−19, Pearson’s correlation test, unpaired, two-sided) and CD11b (p = 2.55e−50) expression. J Mantel–Cox survival analysis showed that cases with higher levels of spatial interaction between tumor CD73 and myeloid CD39 showed particularly poor progression-free survival (PFS). K 24-plex CyCIF analysis of a second cohort of 95 pediatric CNS tumors, including 28 pediatric HGG and 11 H3K27M-mutant diffuse midline gliomas, showing similar co-localization of tumor CD73 and myeloid CD39 (representative staining from a high-grade glioma specimen shown, CyCIF was performed once for each specimen); scale bars, 50 μm. L Spatial statistics again showed a strongly significant spatial correlation between tumor CD73 and myeloid CD39 (p = 1.56e−8, Pearson’s correlation test, unpaired, two-side), as well as myeloid CD163 (p = 9.76e−8) and CD11b (p = 9.80e−5) in pediatric high-grade gliomas and diffuse midline gliomas.
Fig. 9
Fig. 9. Spatial topography of purine signaling in glioblastoma and pediatric high-grade glioma.
Collectively, data suggests a model in which EGFR activation (adult IDH-WT glioblastoma), PDGFRA activation (pediatric high-grade glioma) and/or hypoxia promote CD73 expression by tumor cells in an inflammatory microenvironment. Spatial co-localization of tumor cell-specific CD73 with microglial CD39 augments adenosine production in the tumor microenvironment, promoting immune tolerance and tumorigenesis through action on multiple cell populations. Created with BioRender.com.

References

    1. Sharma P, et al. The next decade of immune checkpoint therapy. Cancer Discov. 2021;11:838–857. doi: 10.1158/2159-8290.CD-20-1680. - DOI - PubMed
    1. Iwai Y, et al. Involvement of PD-L1 on tumor cells in the escape from host immune system and tumor immunotherapy by PD-L1 blockade. Proc. Natl Acad. Sci. USA. 2002;99:12293–12297. doi: 10.1073/pnas.192461099. - DOI - PMC - PubMed
    1. von Bernstorff W, et al. Systemic and local immunosuppression in pancreatic cancer patients. Clin. Cancer Res. 2001;7:925s–932s. - PubMed
    1. Ostuni R, Kratochvill F, Murray PJ, Natoli G. Macrophages and cancer: From mechanisms to therapeutic implications. Trends Immunol. 2015;36:229–239. doi: 10.1016/j.it.2015.02.004. - DOI - PubMed
    1. Lyssiotis CA, Kimmelman AC. Metabolic interactions in the tumor microenvironment. Trends Cell Biol. 2017;27:863–875. doi: 10.1016/j.tcb.2017.06.003. - DOI - PMC - PubMed

Publication types