. 2022 Aug 16;13(1):4820.
doi: 10.1038/s41467-022-32435-5.

A TrkB agonist prodrug prevents bone loss via inhibiting asparagine endopeptidase and increasing osteoprotegerin

Affiliations

A TrkB agonist prodrug prevents bone loss via inhibiting asparagine endopeptidase and increasing osteoprotegerin

Jing Xiong et al. Nat Commun. .

Abstract

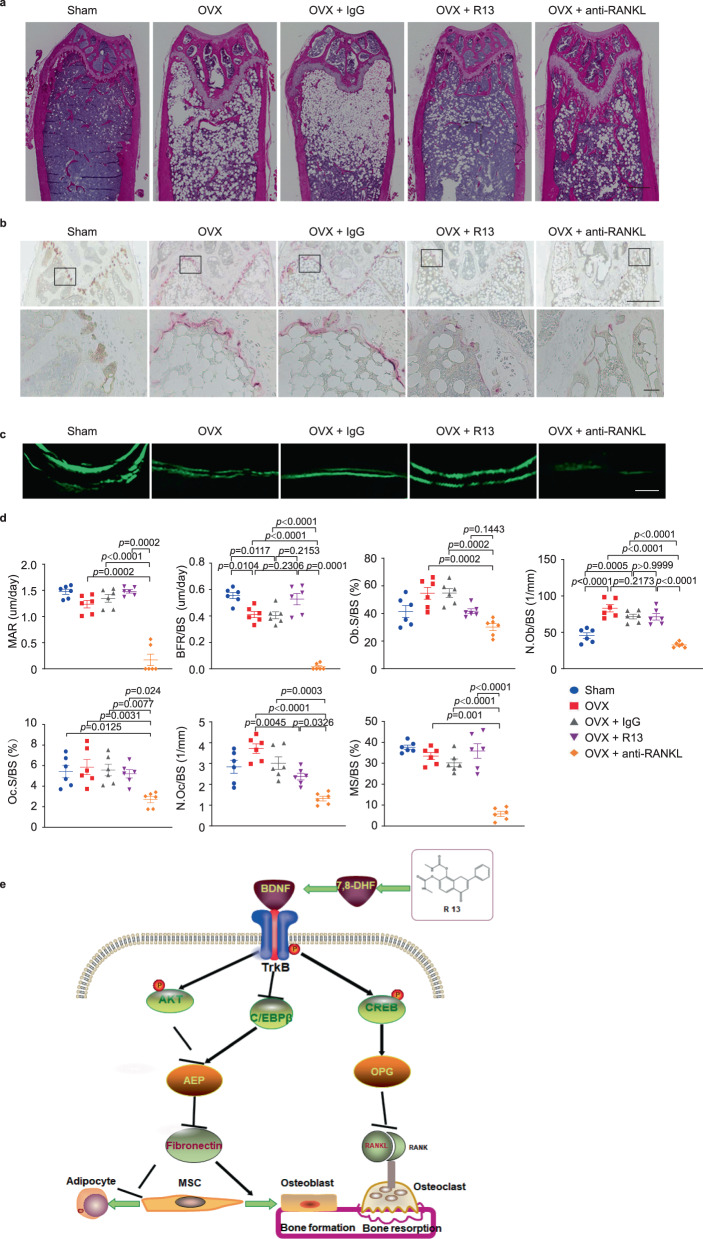
Brain-derived neurotrophic factor (BDNF) and its tropomyosin-related kinase B receptor (TrkB) are expressed in human osteoblasts and mediate fracture healing. BDNF/TrkB signaling activates Akt that phosphorylates and inhibits asparagine endopeptidase (AEP), which regulates the differentiation fate of human bone marrow stromal cells (hBMSC) and is altered in postmenopausal osteoporosis. Here we show that R13, a small molecular TrkB receptor agonist prodrug, inhibits AEP and promotes bone formation. Though both receptor activator of nuclear factor kappa-Β ligand (RANK-L) and osteoprotegerin (OPG) induced by ovariectomy (OVX) remain comparable between WT and BDNF+/- mice, R13 treatment significantly elevates OPG in both mice without altering RANKL, blocking trabecular bone loss. Strikingly, both R13 and anti-RANK-L exhibit equivalent therapeutic efficacy. Moreover, OVX increases RANK-L and OPG in WT and AEP KO mice with RANK-L/OPG ratio lower in the latter than the former, attenuating bone turnover. 7,8-DHF, released from R13, activates TrkB and its downstream effector CREB, which is critical for OPG augmentation. Consequently, 7,8-DHF represses C/EBPβ/AEP pathway, inhibiting RANK-L-induced RAW264.7 osteoclastogenesis. Therefore, our findings support that R13 exerts its therapeutic efficacy toward osteoporosis via inhibiting AEP and escalating OPG.


Conflict of interest statement

The authors declare no competing interests.

Figures

Fig. 1
Fig. 1. AEP knockout improves trabecular bone density in ovariectomy female mice.
Femoral bone structures were assessed by in vitro μCT in AEP wild-type, AEP knockout (AEP KO) mice with or without ovariectomy. a Representative images of the femoral indices of trabecular bone structure measured by in vitro μCT scan. b μCT scanning measurements of trabecular bone volume fraction (BV/TV), connectivity density (Conn.D), structure model index (SMI), trabecular number (Tb.N), trabecular spacing (Tb.Sp), trabecular thickness (Tb.Th). Data are shown as mean ± SEM, n = 5 mice per group for AEP WT sham group, n = 6 mice per group for AEP KO group and n = 7 mice per group for AEP WT and AEP KO OVX group, one-way ANOVA. c μCT scanning measurements of cortical bone cortical area (Ct.Ar), average cortical thickness (Ct.Th) and relative cortical bone area to tissue area (Ct.Ar/Tt.Ar). Data are shown as mean ± SEM, n = 5 mice per group for AEP WT sham goup, n = 6 mice per group for AEP KO group and n = 7 mice per group for AEP WT and AEP KO OVX group, one-way ANOVA. d Serum levels of osteocalcin (a marker of bone formation), C-terminal telopeptide (CTX) (a marker of bone resorption), RANK-L, OPG, RANK-L/OPG ratio and serum BDNF level in wild-type and AEP knock out mice with and without ovariectomy. Data are shown as mean ± SEM, left to right: n = 5, 5, 7, 7 mice per group for osteocalcein and CTX measurement, n = 5 mice per group for BDNF, RANK-L, and OPG measurement, one-way ANOVA.
Fig. 2
Fig. 2. AEP knockout inhibits the bone turnover induced by ovariectomy in female mice.
a Representative images of hematoxylin and eosin (H&E) staining of the distal femur bone in wild-type (AEP WT) and AEP knockout (AEP KO) mice with (OVX) or without (Sham) ovariectomy (n = 5 mice per group). (Scale bar, 500 μm). b Representative images of tartrate resistant acid phosphatase-stained (TRAP-stained) sections of the distal femur bone in AEP WT sham, AEP KO sham, AEP WT OVX and AEP KO OVX group at low magnification (upper panel) and a selected area (shown as the boxed region in the top row of images) at higher magnification (lower panel) (n = 5 mice per group). (Scale bar, 500 μm (upper panel), 20 μm (lower panel)). c Mice were injected subcutaneously with calcein at day 10 and day 3 before sacrifice. Trabecular calcein double-fluorescence labeling images (green) of the representative sections in AEP WT sham, AEP KO sham, AEP WT OVX and AEP KO OVX group (n = 6 mice per group). (Scale bar, 30 μm). d Histomorphometric indices of bone turnover (mineral apposition rate (MAR), bone formation rate per bone surface (BFR/BS), osteoblast surface per bone surface (ObS/BS), number of osteoblasts per bone surface (N.Ob/BS), number of osteoclasts per bone surface (N.Oc/BS), osteoclast surface per bone surface (OcS/BS), and mineralizing surface/bone surface (MS/BS)) in AEP WT and AEP KO mice with or without ovariectomy. MAR = mineral apposition rate; BFR/BS = bone formation rate; Ob.s/BS = percentage of bone surface covered by osteoblasts; N.Ob/BS = number of osteoblasts per mm bone surface; Oc.S/BS = percentage of bone surface covered by osteoclasts; N.Oc/BS = number of osteoclasts per mm bone surface. MS/BS = mineralizing surface/bone surface (%). Data are shown as mean ± SEM, n = 6 mice per group, one-way ANOVA.
Fig. 3
Fig. 3. R13 treatment increases serum OPG level and blocks trabecular bone loss induced by ovariectomy in both WT and BDNF+/− female mice.
Femoral bone structures were assessed by in vitro μCT in wild-type and BDNF+/− mice which were with (OVX) or without (sham) ovariectomy at 12 weeks old, and some of which administrated R13 (21.8 mg/kg) or vehicle for 8 weeks (6 days per week) by oral gavage. a Representative images of the femoral indices of trabecular bone structure measured by in vitro μCT scan in WT sham, BDNF+/− sham, WT OVX, BDNF+/− OVX, and WT OVX + R13, BDNF+/− OVX + R13 group. b μCT scanning measurements of BV/TV, Conn.D., SMI, Tb.N, Tb.Sp, Tb.Th. Data are shown as mean ± SEM, n = 8 mice per group (n = 7 mice for BDNF+/− sham group), one-way ANOVA. c μCT scanning measurements of cortical bone Ct.Ar, Ct.Th and Ct.Ar/Tt.Ar. Data are shown as mean ± SEM, n = 8 mice per group (n = 7 mice per group for BDNF+/− sham group), one-way ANOVA. d Serum levels of osteocalcin, CTX, RANK-L, OPG, RANK-L/OPG ratio, and serum BDNF level. Data are shown as mean ± SEM, n = 5 mice per group for BDNF measurement, n = 6 mice per group for RANK-L and OPG measurement, n = 7 mice per group for osteocalcin and CTX measurement, one-way ANOVA.
Fig. 4
Fig. 4. R13 treatment blocks the changes in bone turnover induced by ovariectomy in female mice.
a Representative images of hematoxylin and eosin (H&E) staining of the distal femur bone in WT sham, BDNF+/− sham, WT OVX, BDNF+/− OVX, and WT OVX + R13, BDNF+/− OVX + R13 group (n = 5 mice per group). (Scale bar, 500 μm). b Representative images of tartrate resistant acid phosphatase-stained (TRAP-stained) sections of the distal femur bone in WT sham, BDNF+/− sham, WT OVX, BDNF+/− OVX, and WT OVX + R13, BDNF+/− OVX + R13 group shown at low magnification (upper panel) and higher magnification (lower panel) (n = 5 mice per group). (Scale bar, 500 μm (upper panels), 20 μm (lower panels)). c Mice were injected subcutaneously with calcein at day 10 and day 3 before sacrifice. Representative images of calcein double-fluorescence labeling images (green) of the trabecular bone in WT sham, BDNF+/− sham, WT OVX, BDNF+/− OVX, and WT OVX + R13, BDNF+/− OVX + R13 group (n = 6 mice per group) (Scale bar, 30 μm). d Histomorphometric indices of bone turnover in WT and BDNF+/− mice after OVX with or without R13 treatment. N.Oc/BS and Oc.S/BS are indices of bone resorption. N.Ob/BS, Ob.S/BS, MAR, BFR/BS and MS/BS are indices of bone formation. Data are shown as mean ± SEM, n = 6 mice per group, one-way ANOVA.
Fig. 5
Fig. 5. 7,8-DHF promotes MC3T3-E1 cells differentiation, mineralization and OPG secretion.
a Representative images of ALP staining in MC3T3-E1 cells treated with BDNF or 7,8-DHF combined with or without K252a for 14 days (n = 3 independent experiments) (Scale bar, 5 mm (upper panel), 200 μm (lower panel)). b Representative images of Alizarin Red S mediated calcium staining in MC3T3-E1 cells treated with BDNF or 7,8-DHF combined with or without K252a for 21 days showed that 7,8-DHF promoted MC3T3 cells mineralization (n = 3 independent experiments) (Scale bar, 5 mm (upper panel), 200 μm (lower panel)). c MC3T3 cells were cultured in complete medium or osteogenic induction medium (OIM) with BDNF or 7,8 DHF combined with or without K252a for 4 days. Western blotting results showed 7,8-DHF inhibited C/EBPβ/AEP pathway and increased OPG expression, and K252 inhibited the effect of 7,8-DHF. d Relative protein levels of C/EBPβ, p-C/EBPβ, AEP, RANKL, OPG, Osterix, p-TrkB/TrkB, and p-Akt/Akt in MC3T3 cells cultured in the complete medium or OIM with BDNF or 7,8-DHF combined with or without K252a for 4 days. Data are shown as mean ± SEM of three independent experiments, one-way ANOVA; e AEP enzymatic activity assay. BDNF and 7,8-DHF inhibit AEP activities, and K252a abolish BDNF and 7,8-DHF’s effects. Data are shown as mean ± SEM of three independent experiments, one-way ANOVA. f qPCR results show that OPG mRNA expression increases in MC3T3 cells after 7,8-DHF treatment for 4 days. Data are shown as mean ± SEM of three independent experiments, one-way ANOVA. g 7,8-DHF increases OPG level and decreases the RANK-L/OPG ratio. Levels of OPG and RANK-L secreted into the medium were measured by ELISA. Data are shown as mean ± SEM of 3 independent experiments, one-way ANOVA.
Fig. 6
Fig. 6. 7,8-DHF positively regulates OPG expression via activating CREB.
a MC3T3 cells cultured in OIM were treated with 7,8-DHF in different time points. Western blotting showed that 7,8-DHF inhibited C/EBPβ, increased Akt (S473), MAPK (p38), C-Jun, CREB phosphorylation. b Relative protein level of C/EBPβ, p- C/EBPβ, AEP, phosphorylated C-Jun, CREB, Akt, MAPK, and TrkB in MC3T3 cells treated with 7,8-DHF in different time points. Data are shown as mean ± SEM of three independent experiments, one-way ANOVA. c Western blotting showed that knockdown of CREB blunted 7,8-DHF-induced OPG expression. d Relative protein levels of RANKL, OPG, and RANKL/OPG ratio. Data are shown as mean ± SEM of three independent experiments, one-way ANOVA. e qPCR results showed that knockdown of CREB inhibited OPG mRNA expression induced by 7,8-DHF. Data are shown as mean ± SEM of three independent experiments, one-way ANOVA.
Fig. 7
Fig. 7. R13 and anti-Rank-L antibody treatments display the similar effect on blocking trabecular bone loss induced by ovariectomy in WT female mice.
Femoral bone structures were assessed by in vitro μCT in wild-type mice which were obtained ovariectomy at 12 weeks old, and some of which were treated with R13 (21.8 mg/kg, by oral gavage) or anti-RANK-L antibody. a Representive images of the femoral indices of trabecular bone structure measured by in vitro μCT scan. b μCT scanning measurements of BV/TV, Conn.D., SMI, Tb.N, Tb.Sp, Tb.Th. Data are shown as mean ± SEM, n = 8 mice per group, one-way ANOVA. c μCT scanning measurements of cortical bone Ct.Ar, Ct.Th and Ct.Ar/Tt.Ar. Data are shown as mean ± SEM, n = 8 mice per group, one-way ANOVA. d Serum levels of osteocalcin, CTX, RANK-L, OPG and RANK-L/OPG ratio. Data are shown as mean ± SEM, n = 6 mice per group, one-way ANOVA.
Fig. 8
Fig. 8. R13 and anti-RANK-L antibody treatments block the changes in bone turnover induced by ovariectomy in female mice.
a Representative images of hematoxylin and eosin (H&E) staining of the distal femur bone in WT mice with sham, OVX, OVX + IgG, OVX + R13, and OVX + anti-RANK-L antibody group (n = 5 mice per group). (Scale bar, 500 μm). b Representative images of tartrate resistant acid phosphatase-stained (TRAP-stained) sections of the distal femur bone were shown at low magnification (upper panel) and higher magnification (lower panel) (n = 5 mice per group). (Scale bar, 500 μm (upper panels), 20 μm (lower panels)). d Representive calcein double-fluorescence labeling images of the trabecular bone (n = 6 mice per group) (Scale bar, 30 μm). d Histomorphometric indices of distal femur. N.Oc/BS and Oc.S/BS are indices of bone resorption. N.Ob/BS, Ob.S/BS, MAR, BFR/BS, and MS/BS are indices of bone formation. Data are shown as mean ± SEM, n = 6 mice per group, one-way ANOVA. e The schematic diagram of R13 treatment on osteoporosis via elevating OPG and inhibiting AEP via activating BDNF/TrkB signaling.

Similar articles

Cited by

References

    1. Huang EJ, Reichardt LF. Neurotrophins: roles in neuronal development and function. Annu. Rev. Neurosci. 2001;24:677–736. doi: 10.1146/annurev.neuro.24.1.677. - DOI - PMC - PubMed
    1. Kaplan DR, Miller FD. Neurotrophin signal transduction in the nervous system. Curr. Opin. Neurobiol. 2000;10:381–391. doi: 10.1016/S0959-4388(00)00092-1. - DOI - PubMed
    1. Cartwright M, Mikheev AM, Heinrich G. Expression of neurotrophin genes in human fibroblasts: differential regulation of the brain-derived neurotrophic factor gene. Int. J. Dev. Neurosci. 1994;12:685–693. doi: 10.1016/0736-5748(94)90048-5. - DOI - PubMed
    1. Labouyrie E, et al. Expression of neurotrophins and their receptors in human bone marrow. Am. J. Pathol. 1999;154:405–415. doi: 10.1016/S0002-9440(10)65287-X. - DOI - PMC - PubMed
    1. Simao AP, et al. Involvement of BDNF in knee osteoarthritis: the relationship with inflammation and clinical parameters. Rheumatol. Int. 2014;34:1153–1157. doi: 10.1007/s00296-013-2943-5. - DOI - PubMed

Publication types