. 2022 Aug 16;7(1):39.
doi: 10.1038/s41536-022-00235-6.

Modeling PRPF31 retinitis pigmentosa using retinal pigment epithelium and organoids combined with gene augmentation rescue

Affiliations

Modeling PRPF31 retinitis pigmentosa using retinal pigment epithelium and organoids combined with gene augmentation rescue

Amélie Rodrigues et al. NPJ Regen Med. .

Abstract

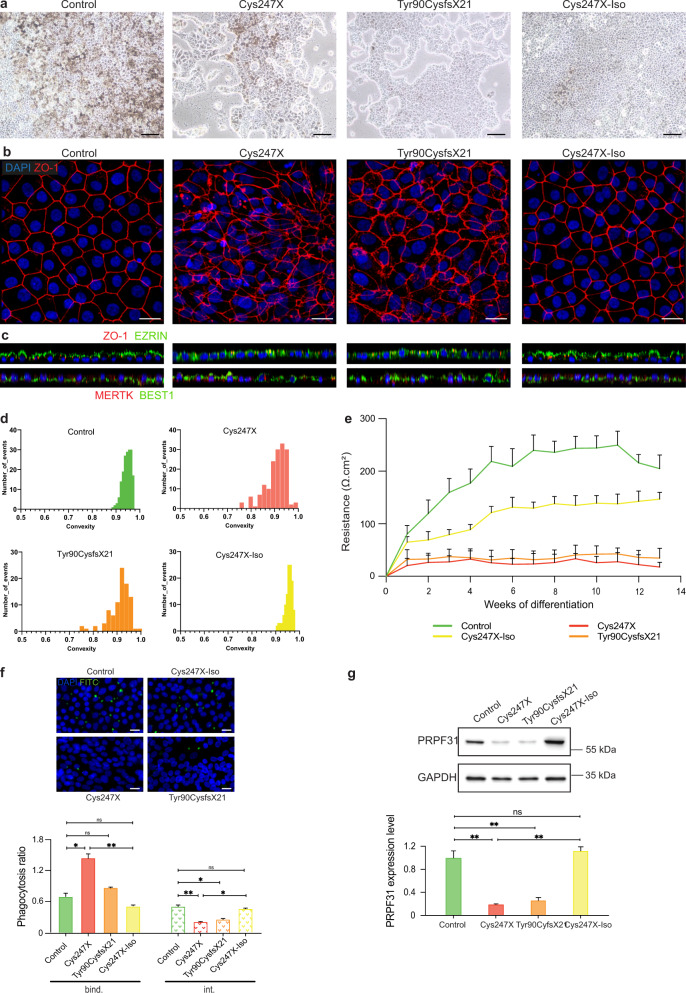
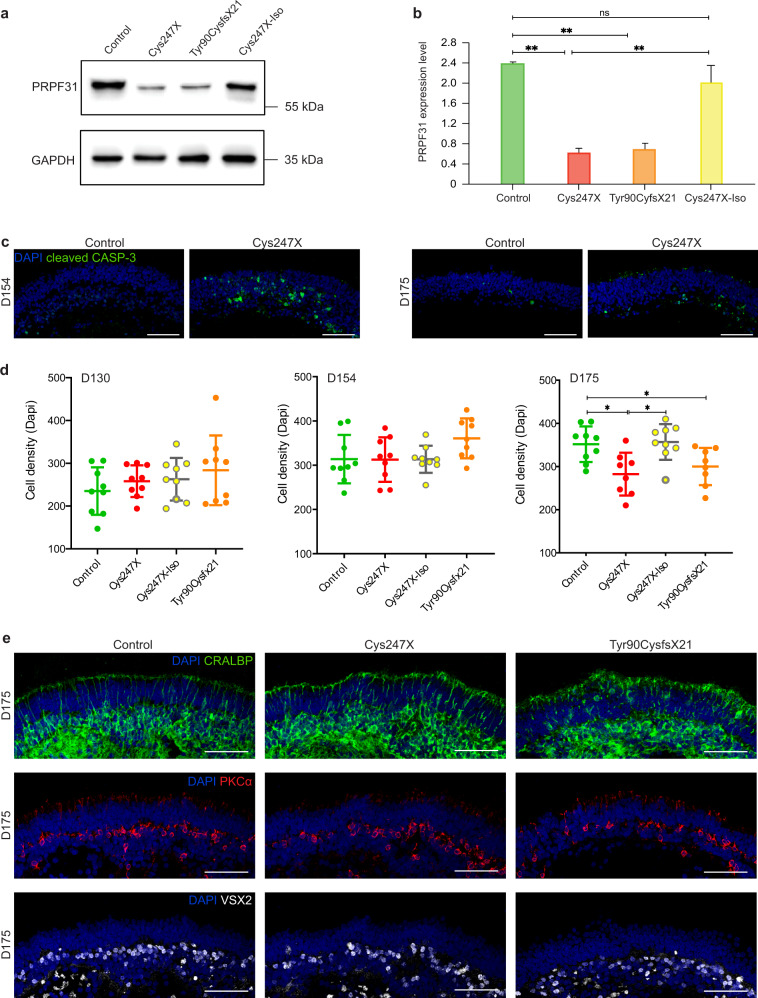
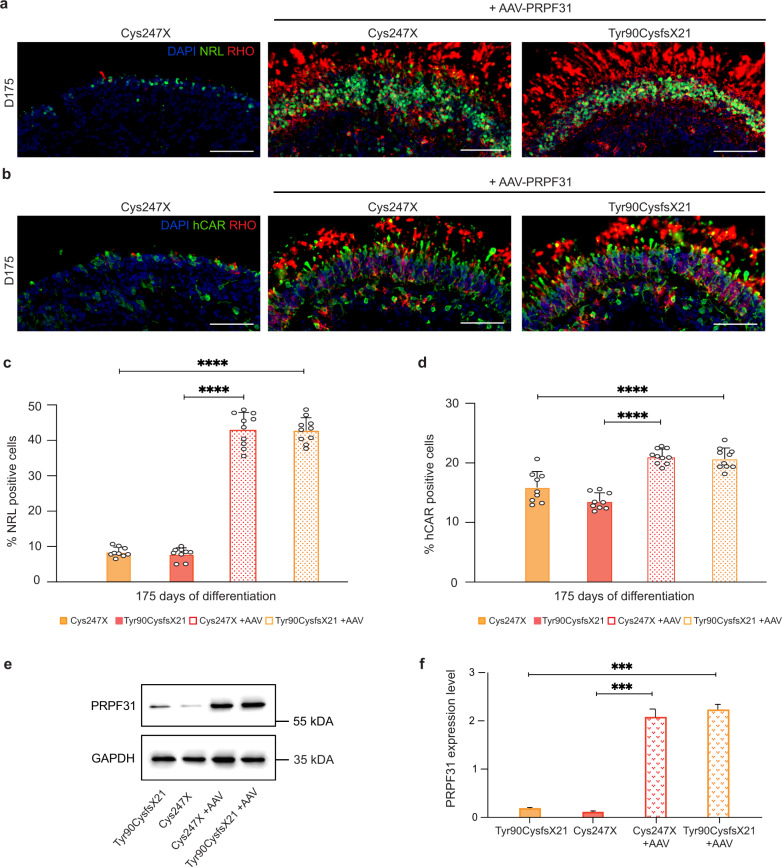
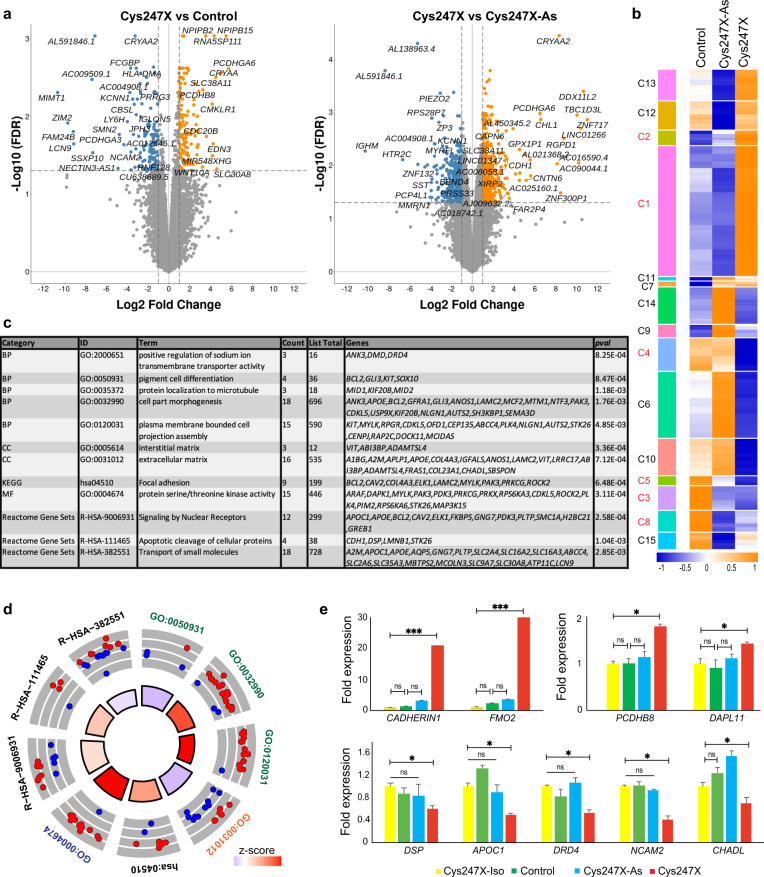
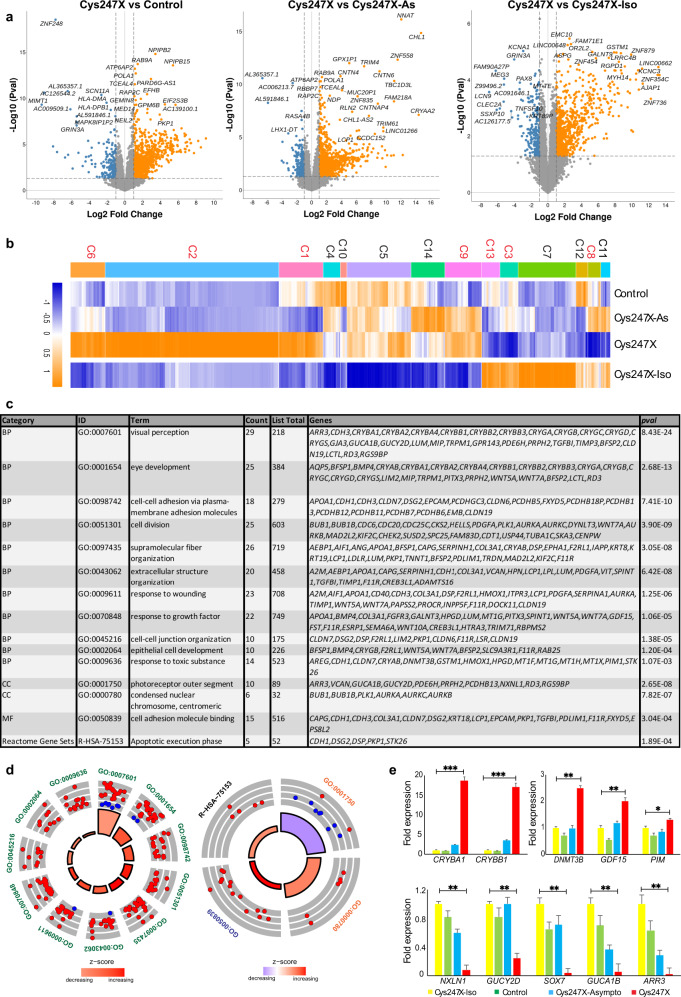
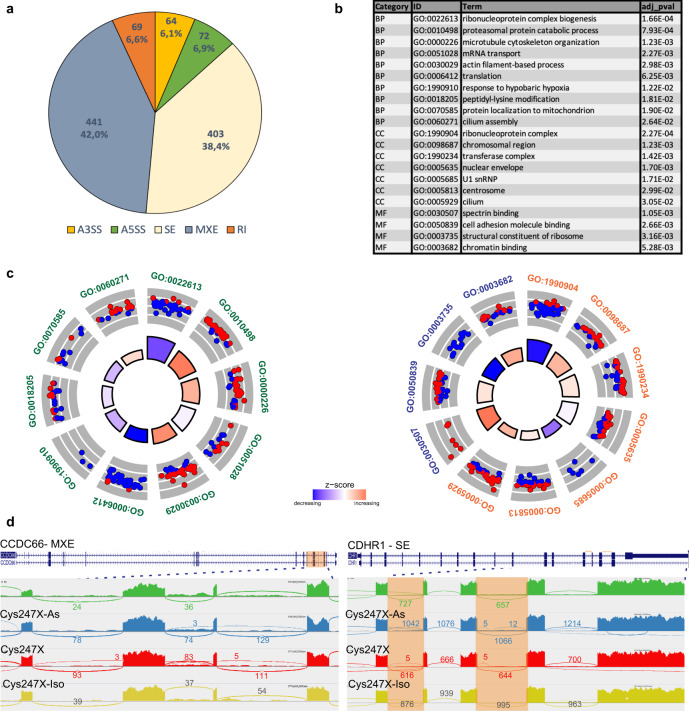
Mutations in the ubiquitously expressed pre-mRNA processing factor (PRPF) 31 gene, one of the most common causes of dominant form of Retinitis Pigmentosa (RP), lead to a retina-specific phenotype. It is uncertain which retinal cell types are affected and animal models do not clearly present the RP phenotype observed in PRPF31 patients. Retinal organoids and retinal pigment epithelial (RPE) cells derived from human-induced pluripotent stem cells (iPSCs) provide potential opportunities for studying human PRPF31-related RP. We demonstrate here that RPE cells carrying PRPF31 mutations present important morphological and functional changes and that PRPF31-mutated retinal organoids recapitulate the human RP phenotype, with a rod photoreceptor cell death followed by a loss of cones. The low level of PRPF31 expression may explain the defective phenotypes of PRPF31-mutated RPE and photoreceptor cells, which were not observed in cells derived from asymptomatic patients or after correction of the pathogenic mutation by CRISPR/Cas9. Transcriptome profiles revealed differentially expressed and mis-spliced genes belonging to pathways in line with the observed defective phenotypes. The rescue of RPE and photoreceptor defective phenotypes by PRPF31 gene augmentation provide the proof of concept for future therapeutic strategies.


Conflict of interest statement

A.S.-B., S.R., J.-A.S., and O.G. are inventors on patents on hiPSC retinal differentiation and on the use of hiPSC retinal derivatives to treat retinal degeneration, licensed to Gamut Cell Tx. L.C.B. is an inventor of patent applications for AAV capsid variants and AAV screening methods, and she is a founder of Avista Therapeutics and Vegavect.

Figures

Fig. 1
Fig. 1. Characterization of RPE cells derived from PRPF31-mutated hiPSCs revealed morphological and functional abnormalities related to a lower level of PRPF31 protein expression.
a Bright-field images of human iPSC-derived RPE cells from an unaffected family-related member (control), PRPF31-mutated (Cys247X and Tyr90CysfsX21), and isogenic controls (Cys247X-Iso) after 30 days of differentiation. Scale bar = 100 µm. b Immunostaining for tight-junction protein ZO-1. Nuclei were counterstained with DAPI. Scale bar = 10 µm. c Orthogonal projection of immunostaining for the apical protein Ezrin and the basolateral channel Bestrophin (BEST1). d Distribution of iRPE cells based on the convexity (ratio convex perimeter/perimeter) cell shape parameter from N = 3 independent differentiations. e Transepithelial resistance time course analysis of RPE cells between 1 and 13 weeks of culture on Transwell filters. f Representative images and quantitative analysis of iRPE cells phagocytic activity: ratios of FITC/DAPI fluorescence evaluated after 3-hour incubation with FITC-labeled POS. The fluorescence signal of bound particles (bind.) corresponds to the total fluorescence signal minus the fluorescence signal of internalized particles after quenching by trypan blue (int.). Values are mean ± SD, n = 9 samples from N = 3 independent differentiations. Statistical significance assessed using the Kruskal–Wallis test (*P < 0.05; **P < 0.01). Scale bar = 10 µm. g Representative image and quantitative analysis of western blots showing PRPF31 protein levels relative to GAPDH expression. Values are mean ± SD, n = 6 samples from N = 3 independent differentiations. Statistical significance assessed using Kruskal–Wallis test (**P < 0.01).
Fig. 2
Fig. 2. Electron microscopic analysis of control and PRPF31-mutated iRPE cells.
ad Transmission electronic microscopic images showed the presence of apical microvilli (a), basal nuclei (a), tight junctions (b, arrows) in both control (Ctr) and Cys247X iRPE cells, and the presence of desmosomes (c, arrow) and basal membranes (d, vertical line BM) only in Control iRPE cells. Scale bar = 1 µm. e Scanning electron microscopic images showed the presence of apical microvilli in both Control and Cys247X iRPE cells (upper panels) and the absence of basal membrane in Cys247X iRPE cells (lower panels). Scale bar = 10 µm.
Fig. 3
Fig. 3. Defective RPE phenotype due to PRPF31 mutations is not observed in an asymptomatic carrier and can be prevented by gene augmentation strategy.
a Bright-field images of human iPSC-derived RPE cells from an affected patient carrying PRPF31-mutation (Cys247X), an unaffected patient carrying the same mutation (Cys247X-Asympto), an affected patient carrying one PRPF31 mutation, and a supplementary WT copy of PRPF31 in the AAVS1 locus (Cys247X-KI and Tyr90CysfsX21-KI), after 30 days of differentiation. Scale bar = 100 µm. b Immunostaining for the tight-junction protein ZO-1. Nuclei were counterstained with DAPI. Scale bar = 10 µm. c Representative images and quantitative analysis of RPE cell phagocytic activity: ratios of FITC/DAPI fluorescence evaluated after a 3-hour incubation with FITC-labeled POS. The fluorescence signal of bound particles (bind.) corresponds to the total fluorescence signal minus the fluorescence signal of internalized particles (int.) after quenching by trypan blue. Values are mean ± SD, n = 9 samples from N = 3 independent differentiations. Statistical significance assessed using the Kruskal–Wallis test (*P < 0.05; **P < 0.01; ****P < 0.0001). Scale bar = 10 µm. d Transepithelial resistance time course analysis of RPE cells between 1 and 13 weeks of cultured on Transwell filters. e Representative image and quantitative analysis of western blots showing PRPF31 protein levels relative to GAPDH expression. Values are mean ± SD, n = 6 samples from N = 3 independent differentiations. Statistical significance assessed using Kruskal–Wallis test (**P < 0.01; ***P < 0.001).
Fig. 4
Fig. 4. Mutations in PRPF31 lead to a successive rod and cone photoreceptor degeneration in hiPSC-derived retinal organoids.
a Immunofluorescence staining of retinal organoid cryosections derived from unaffected family-related member (Control), PRPF31-mutated (Cys247X and Tyr90CysfsX21) and isogenic control (Cys247X-Iso) hiPSCs after 100, 130, 154, and 175 days of differentiation (D100, D130, D154, and D175) using rod photoreceptor markers NRL and Rhodopsin (RHO). Nuclei were counterstained with DAPI. Scale bar = 100 µm. b Higher magnification of one representative rod cell stained with the RHO marker of control (left) and PRPF31-mutated (right) retinal organoids at D154. c Quantification of the percentage of NRL-positive cells in retinal organoids after different differentiation times. Each data point represents counts of NRL-positive cells relative to DAPI-positive cells performed on one-quarter of a representative cross-section of one organoid. Values are mean ± SD for each time point, n = 9 independent retinal organoids from N ≥ 3 independent differentiations. Statistical significance assessed using the Kruskal–Wallis test (*P < 0.05; ***P < 0.001). d Immunofluorescence staining of cryosections from retinal organoids at D130, D154, D175, and D200 using rod (RHO) and cone (human cone arrestin: hCAR) markers. Nuclei were counterstained with DAPI. Scale bar = 100 µm. e Higher magnification of one representative cone cell stained with hCAR marker of control (left) and PRPF31-mutated (right) retinal organoids at D200. f Quantification of the percentage of hCAR-positive cells in retinal organoids after different differentiation times. Each data point represents counts of hCAR-positive cells relative to DAPI-positive cells performed on one-quarter of a representative cross-section of one organoid. Values are mean ± SD, for each time point n = 9 independent retinal organoids from N ≥ 3 independent differentiations. Statistical significance assessed using the Kruskal–Wallis test (**P < 0.01; ***P < 0.001).
Fig. 5
Fig. 5. PRPF31-related retinal degeneration is correlated with lower levels of PRPF31 protein expression and does not affect bipolar or Müller glial cells.
a, b Representative images and quantitative analysis of western blots showing PRPF31 protein levels relative to GAPDH expression in D130 retinal organoids. Values are mean ± SD, n = 6 samples from N = 3 independent differentiations. Statistical significance assessed using the Kruskal–Wallis test (**P < 0.01). c Immunofluorescence staining of cryosections from control and PRPF31-mutated (Cys247X) retinal organoids after 154 days of differentiation (D154) using a marker for the active form of the apoptotic factor Caspase-3 (cleaved CASP-3). Nuclei were counterstained with DAPI. Scale bar = 100 µm. d Quantification of the cell density of presumptive ONL in retinal organoids after different differentiation times. Each data point represents counts of DAPI-positive cells performed on one-quarter of a representative cross-section of one organoid. Values are mean ± SD, for each time, independent retinal organoids from N ≥ 3 independent differentiations. Statistical significance assessed using the One-way ANOVA test (*P < 0.05). e Immunolabeling of cryosections from D175 retinal organoids using markers for Müller glial (CRALBP) and bipolar (PKCα, VSX2) cells. Nuclei were counterstained with DAPI. Scale bar = 100 µm.
Fig. 6
Fig. 6. Photoreceptor degeneration is not observed in retinal organoids derived from an asymptomatic carrier and can be prevented by gene augmentation strategy.
a Immunofluorescence staining of retinal organoid cryosections derived from an affected patient carrying mutation (Cys247X), an unaffected patient carrying the same mutation (Cys247X-Asympto), and PRPF31-KI (Cys247X-KI and Tyr90CysfsX21-KI) iPSCs after 130 and 175 days of differentiation (D130, and D175) using rod photoreceptor markers NRL and Rhodopsin (RHO). Nuclei were counterstained with DAPI. Scale bar = 100 µm. b Immunofluorescence staining of retinal organoid cryosections at D130 and D175 using markers for rod (RHO) and cone (hCAR) photoreceptors. Nuclei were counterstained with DAPI. Scale bar = 100 µm. c Quantification of the percentage of NRL-positive cells in retinal organoids after different differentiation times (D100, D130, D154, and D175). d Quantification of the percentage of hCAR-positive cells in retinal organoids after different differentiation times (D130, D154, D175, and D200). Each data point represents counts of NRL or hCAR-positive cells relative to DAPI-positive cells performed on one-quarter of a representative cross-section of one organoid. Values are mean ± SD, for each time point n = 9 independent retinal organoids from N ≥ 3 independent differentiations. Statistical significance assessed using the Kruskal–Wallis test (*P < 0.05; **P < 0.01; ***P < 0.001; ****P < 0.0001). e Representative image and f quantitative analysis of western blots showing PRPF31 protein levels relative to GAPDH expression in retinal organoids at D130. Values are mean ± SD, n = 6 samples from N = 3 independent differentiations. Statistical significance assessed using the Kruskal–Wallis test (**P < 0.01; ***P < 0.001).
Fig. 7
Fig. 7. Photoreceptor degeneration phenotype can be rescued by AAV-driven PRPF31 overexpression.
a, b Immunofluorescence staining of cryosections of PRPF31-mutated (Cys247X) retinal organoids and PRPF31-mutated retinal organoids transduced with PRPF31-AAV (Cys247X + AAV-PRPF31) at D175 using markers for rod (NRL and RHO) and cone (hCAR) photoreceptors. Nuclei were counterstained with DAPI. Scale bar = 100 µm. c, d Quantification of the percentage of NRL or hCAR-positive cells in D175 retinal organoids. Each data point represents manual counts of NRL or hCAR-positive cells relative to DAPI-positive cells performed on one-quarter of a representative cross-section of one organoid. Values are mean ± SD, for each time point n ≥ 9 independent retinal organoids from N ≥ 3 independent differentiations. Statistical significance assessed using the Kruskal–Wallis test (****P < 0.0001). e Representative image and f quantitative analysis of western blots showing PRPF31 protein levels relative to GAPDH expression in retinal organoids at D130. Values are mean ± SD, n = 6 samples from N = 3 independent experiments. Statistical significance assessed using the Kruskal–Wallis test (***P < 0.001).
Fig. 8
Fig. 8. Identification of genes and pathways deregulated in hiPSC-derived RPE cells from PRPF31 patients using whole transcriptome analysis.
a Volcano plots of differentially expressed genes for Cys247X vs Control (left panel) and Cys247X vs Cys247X-As (right panel). Difference in gene expression (FC) is plotted on the x-axis (log2 scale), and False Discovery Rate (FDR) adjusted significance is plotted on the y-axis (log10 scale). Genes significantly up- or downregulated are indicated in orange and blue, respectively. b Hierarchical clustering analysis of the DEGs between all groups with genes up- or downregulated by a factor ≥2 with FDR ≤ 0.05 between Control, Cys247X-As and Cys247X patient-derived iRPE cells. The z score was derived from the average of the triplicates for each experimental group. Blue: low expression; orange: high expression. The left column represents the 15 clusters, and selected clusters used for further pathway analysis are in red. c Table of the over-represented GO pathways of interest identified with Metascape using the DEGs from the selected clusters. The different categories of pathways are BP, Biological Process; CC, Cell Compartment; KEGG, Kyoto Encyclopedia of Genes and Genomes; MF, Molecular Function. d Circular visualization of selected GO enriched pathways. Down- (blue dots) and up-regulated genes (red dots) within each GO pathway are plotted based on logFC. z score bars indicate if an entire biological process is more likely to be increased or decreased based on the genes it comprises. Green, Biological Process; orange, Cell Compartment; blue, Molecular Function. e Differential expression analysis by RT-qPCR of CADHERIN1, FMO2, PCDHB8, and DAPL11 (upper panel) and of DSP, APOC1, DRD4, NCAM2, and CHADL (lower panel) in Cys247X-Iso, Control, Cys247X-As and Cys247X iRPE cells. Fold expression is relative to Cys247X-Iso. Values are mean ± SD, n = 3 samples of 1 × 106 iRPE cells from N = 3 independent differentiations. Data were normalized against the geometric average ΔCt of the 18S housekeeping gene. Statistical significance assessed using the Kruskal–Wallis test (*P < 0.05; ***P < 0.001).
Fig. 9
Fig. 9. Identification of genes and pathways deregulated in D100 retinal organoids derived from PRPF31 patient hiPSCs using whole transcriptome analysis.
a Volcano plots of differentially expressed genes for Cys247X vs Control (left panel), Cys247X vs Cys247X-As (middle panel), and Cys247X vs Cys247X-Iso (right panel). Difference in gene expression (FC) is plotted on the x-axis (log2 scale), and P value (Pval) significance is plotted on the y-axis (log10 scale). Genes up- or downregulated are indicated in orange and blue, respectively. b Hierarchical clustering analysis of the DEGs between Cys247X-Iso and Cys247X with genes up- or downregulated by a factor ≥2 with P val ≤0.05 in D100 retinal organoids. The z score was derived from the average of the replicates for each experimental group. Blue: low expression; orange: high expression. The top row represents the 14 clusters, and selected clusters used for further pathway analysis are in red. c Table of the over-represented GO pathways of interest identified with Metascape using the DEGs from the selected clusters. The different categories of pathways are BP, Biological Process; CC, Cell Compartment; KEGG, Kyoto Encyclopedia of Genes and Genomes; MF, Molecular Function. d Circular visualization of selected GO enriched pathways. Downregulated genes (blue dots) and up-regulated genes (red dots) within each GO pathway of interest are plotted based on logFC. z score bars indicate if an entire biological process is more likely to be increased or decreased based on the genes it comprises. Green, Biological Process; orange, Cell Compartment; blue, Molecular Function. e Differential expression analysis by RT-qPCR of CRYBA1, CRYBB1, DNMT3B, GDF15, and PIM (upper panel) and of NXLN1, GUCY2D, SOX7, GUCA1B, and ARR3 (lower panel) in Cys247X-Iso, Control, Cys247X-As, and Cys247X iRPE cells. Fold expression is relative to Cys247X-Iso. Values are mean ± SD, n = 3 samples of 10-12 retinal organoids from N = 3 independent differentiations. Data were normalized against the geometric average ΔCt of 18S housekeeping gene. Statistical significance assessed using the Kruskal–Wallis test (*P < 0.05; **P < 0.01; ***P < 0.001).
Fig. 10
Fig. 10. Identification of alternate splicing in hiPSC-derived RPE cells from PRPF31 patients.
a Venn diagrams comparing alternate splicing changes identified in iRPE cells and considered as significant (deltaPSI ≥ 10%, FDR ≤ 0.05) between Cys247X vs Control, Cys247X vs Cys247X-As and Cys247X-As vs Control. The number of alternate splicing events of interest are indicated in red and occurred in 152 genes. b Pie chart from rMATs analysis showing that a majority of splicing events corresponded to skipped exons. A5SS and A3SS, alternative 5′ and 3′ splice sites; SE, skipped exons; RI, retained introns; MXE, mutually exclusive exons. c Circular visualization of selected GO enriched pathways from the identified 152 genes with alternative splicing events. Down- (blue dots) and up-regulated genes (red dots) within each GO pathway are plotted based on logFC. z score bars indicate if an entire biological process is more likely to be increased or decreased based on the genes it comprises. Green, Biological Process; orange, Cell Compartment; blue, Molecular Function. The table shows pathway identity number (ID), associated pathway name (Term), gene count from the analyzed dataset and the adjusted P value (adj_pval). The different categories of pathways are BP, Biological Process; CC, Cell Compartment; MF, Molecular Function. d Sashimi plots for the indicated genes representing the alternate splicing events in iRPE cells derived from Control (green), Cys247X-As (blue) and Cys247X (red). Data are representative of the replicates for each experimental group. Orange highlights in the sashimi plots indicate the alternative splicing events and numbers correspond to the number of junction reads for each event. ITG6A: Integrin Subunit Alpha 6; BEST1: Bestrophin 1; SCARB1: Scavenger Receptor Class B Member 1.
Fig. 11
Fig. 11. Identification of alternate splicing in D100 retinal organoids derived from PRPF31 patient hiPSCs.
a Pie chart from rMATs analysis showing that a majority of splicing events in retinal organoids corresponded to skipped exons and mutually exclusive exons. A5SS and A3SS, alternative 5′ and 3′ splice sites; SE, skipped exons; RI, retained introns; MXE, mutually exclusive exons. b Table showing pathway identity number (ID), associated pathway name (Term), gene count from pathways analysis and the adjusted P value (adj_pval). The different categories of pathways are BP, Biological Process; CC, Cell Compartment; MF, Molecular Function. c Circular visualization of selected GO enriched pathways from the identified 600 genes with alternative splicing events (total of 1049 splicing events) between Cys247X-Iso and Cys247X retinal organoids at D100. Down- (blue dots) and up-regulated genes (red dots) within each GO pathway are plotted based on logFC. z score bars indicate if an entire biological process is more likely to be increased or decreased based on the genes it comprises. Green, Biological Process; orange, Cell Compartment; blue, Molecular Function. d Sashimi plots for the indicated genes representing the alternate splicing events in retinal organoids at D100 derived from Control (green), Cys247X-As (blue), Cys247X (red) and Cys247X-Iso (yellow). Data are representative of the replicates for each experimental group. Orange highlights in the sashimi plots indicate the alternative splicing events and numbers correspond to the number of junction reads for each event. CCDC66: Coiled-Coil Domain Containing 66; CDHR1: Cadherin Related Family Member 1.

References

    1. Hartong DT, Berson EL, Dryja TP. Retinitis pigmentosa. Lancet. 2006;368:1795–1809. doi: 10.1016/S0140-6736(06)69740-7. - DOI - PubMed
    1. Verbakel SK, et al. Non-syndromic retinitis pigmentosa. Prog. Retin. Eye Res. 2018;66:157–186. doi: 10.1016/j.preteyeres.2018.03.005. - DOI - PubMed
    1. Daiger SP, Sullivan LS, Bowne SJ. Genes and mutations causing retinitis pigmentosa. Clin. Genet. 2013;84:132–141. doi: 10.1111/cge.12203. - DOI - PMC - PubMed
    1. Pan X, et al. Mutation analysis of pre-mRNA splicing genes in Chinese families with retinitis pigmentosa. Mol. Vis. 2014;20:770–779. - PMC - PubMed
    1. Saini S, Robinson PN, Singh JR, Vanita V. A novel 7 bp deletion in PRPF31 associated with autosomal dominant retinitis pigmentosa with incomplete penetrance in an Indian family. Exp. Eye Res. 2012;104:82–88. doi: 10.1016/j.exer.2012.09.010. - DOI - PubMed