. 2022 Aug 16;13(1):4827.
doi: 10.1038/s41467-022-32552-1.

A new gene set identifies senescent cells and predicts senescence-associated pathways across tissues

Affiliations

A new gene set identifies senescent cells and predicts senescence-associated pathways across tissues

Dominik Saul et al. Nat Commun. .

Abstract

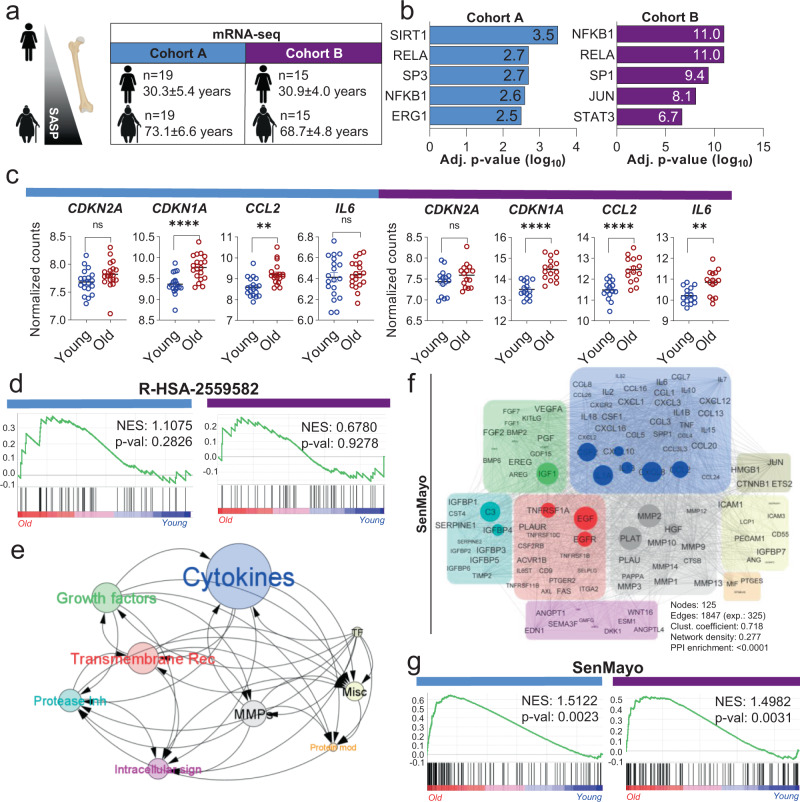
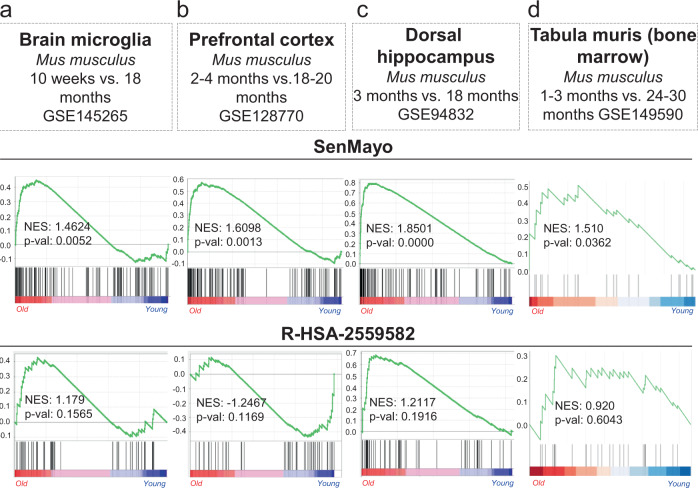
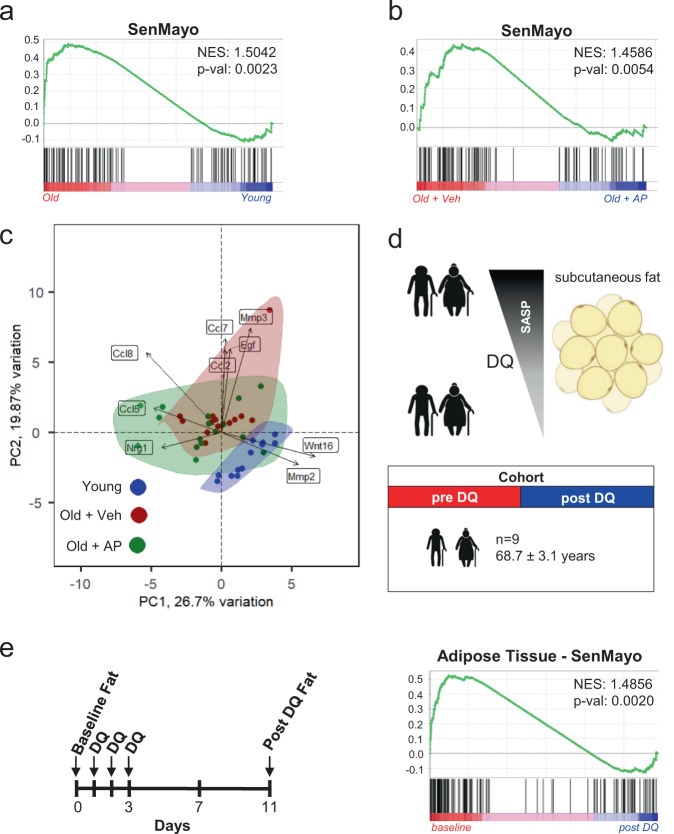
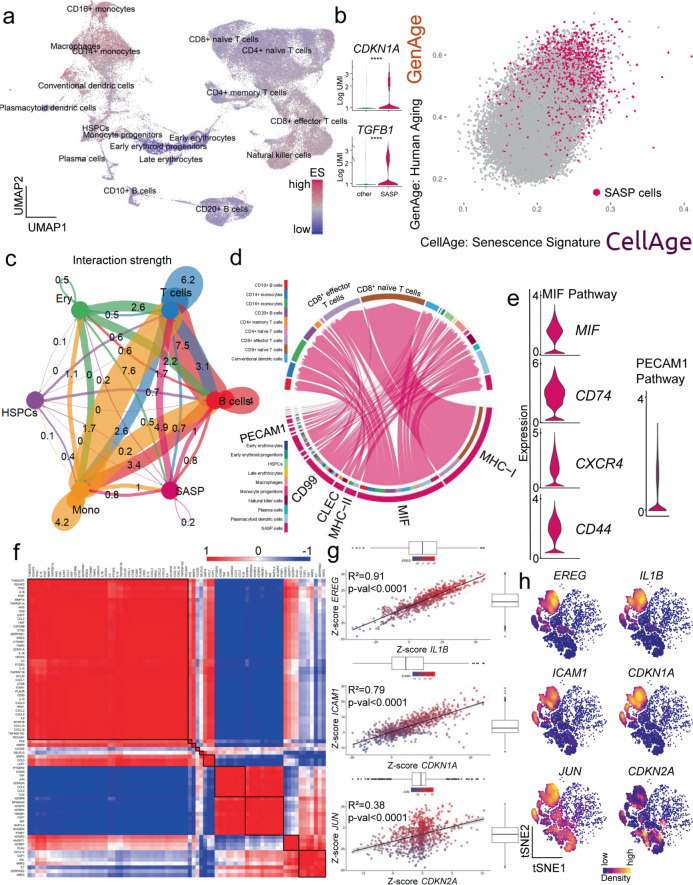
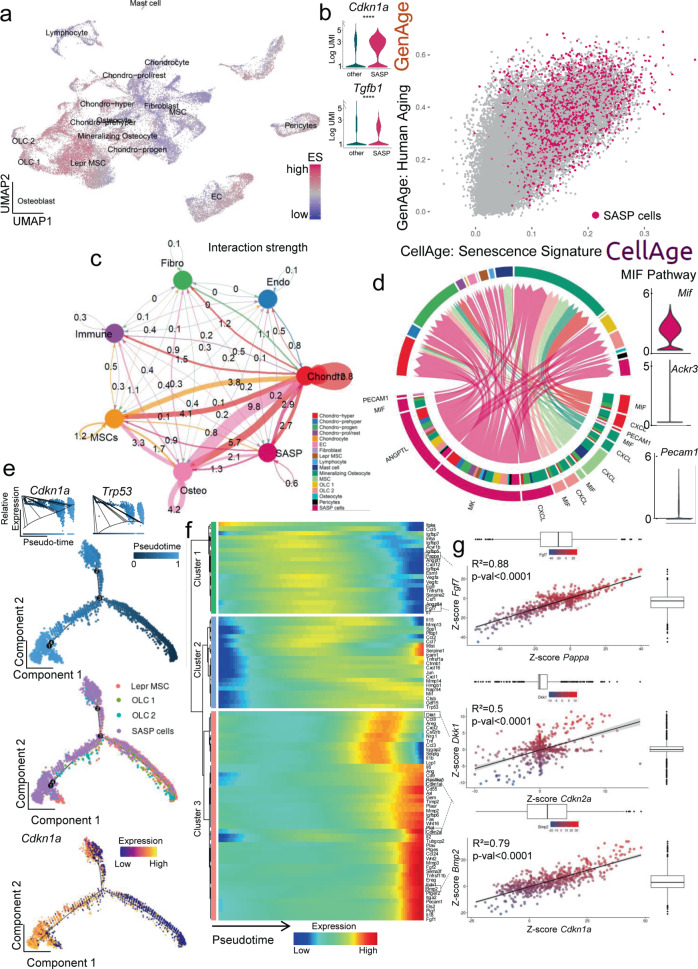
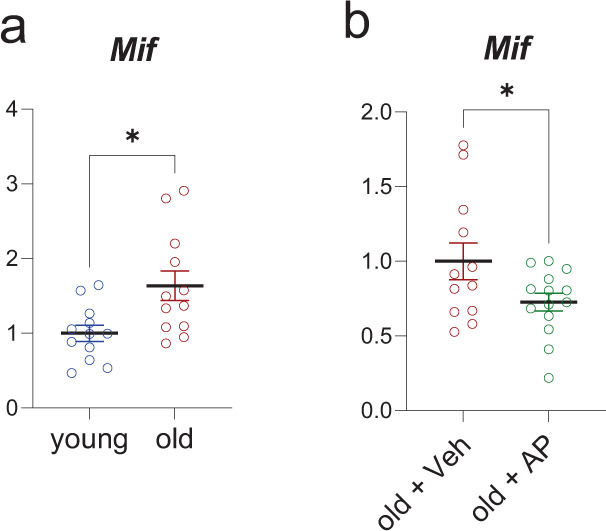
Although cellular senescence drives multiple age-related co-morbidities through the senescence-associated secretory phenotype, in vivo senescent cell identification remains challenging. Here, we generate a gene set (SenMayo) and validate its enrichment in bone biopsies from two aged human cohorts. We further demonstrate reductions in SenMayo in bone following genetic clearance of senescent cells in mice and in adipose tissue from humans following pharmacological senescent cell clearance. We next use SenMayo to identify senescent hematopoietic or mesenchymal cells at the single cell level from human and murine bone marrow/bone scRNA-seq data. Thus, SenMayo identifies senescent cells across tissues and species with high fidelity. Using this senescence panel, we are able to characterize senescent cells at the single cell level and identify key intercellular signaling pathways. SenMayo also represents a potentially clinically applicable panel for monitoring senescent cell burden with aging and other conditions as well as in studies of senolytic drugs.


Conflict of interest statement

J.L.K., T.T., and N.K.L. have a financial interest related to this research. Patents on senolytic drugs and their uses and SASP biomarkers are held by Mayo Clinic and the University of Minnesota. This research has been reviewed by the Mayo Clinic Conflict of Interest Review Board and was conducted in compliance with Mayo Clinic Conflict of Interest policies. The remaining authors declare no competing interests

Figures

Fig. 1
Fig. 1. Development and validation of the SenMayo gene set.
a Human samples from Cohort A (bone and bone marrow biopsies) and cohort B (highly enriched osteocyte fractions) were used for transcriptome-wide RNA-seq analyses; b Making use of TRRUST analyses, we found several inflammation- and stress-associated genes, including SIRT1 and NFKB1, to be upregulated in the elderly women; p values were adjusted according to Benjamini–Hochberg. c In both gene sets, CDKN1A/P21Cip1 and several SASP markers such as CCL2 and IL6 showed consistent upregulation with aging, while CDKN2A/p16Ink4a (due to comparatively low expression) did not change significantly. Two-sided unpaired t-tests except for CCL2, where a Kolmogorov–Smirnov test was used (cohort A: CDKN2A: p = 0.0834; CDKN1A: p < 0.0001; CCL2: p = 0.0034; IL6: p = 0.6391; cohort B: CDKN2A: p = 0.1658, CDKN1A: p < 0.0001; CCL2: p < 0.0001, IL6: p = 0.0017). d The commonly used senescence/SASP gene set (R-HSA-2559582) failed to predict the aging process in either human cohort. Nominal p value, calculated as two-sided t-test, no adjustment since only one gene set was tested; e The SenMayo gene set includes growth factors, transmembrane receptors, and cytokines/chemokines that are highly influenced by other members of the gene set. The circle size depicts groupwise interactions, arrows point the direction of these interactions. f SenMayo encodes a dense network of nine different protein classes within a strong interaction network. The size of each circle represents the connectivity with other members of the gene set, grey lines represent interactions; g Genes included in the SenMayo gene set were significantly enriched with aging in both human cohorts. Nominal p value, calculated as two-sided t-test, no adjustment since only one gene set was tested Cohort A: n = 38 (19 young, 19 old, all ♀), Cohort B: n = 30 (15 young, 15 old, all ♀). **p < 0.01, ****p < 0.0001. Fig. 1a was designed using Biorender.com. Depicted are mean ± SEM. Source data are provided as a Source Data file.
Fig. 2
Fig. 2. The SenMayo gene set predicts aging across tissues and species.
a Compared to the conventional gene set, the SenMayo list is significantly enriched during the aging process in murine brain microglia (p = 0.1565 vs. p = 0.0052; GSE145265), n = 4 (2 young, 2 aged, all ♂), b murine prefrontal cortex (p = 0.1169 vs. p = 0.0013; GSE128770), n = 48 (24 young, 24 aged, all ♂), and (c) murine dorsal hippocampus (p = 0.1916 vs. p < 0.001; GSE94832), n = 12 (6 young (3 ♀), 6 aged (2♀). Likewise, the murine bone marrow (d) within the tabula muris senis (GSE149590) has a higher enrichment of the SenMayo genes within the old cohort (p = 0.6043 vs. p = 0.0362), n = 11 (4 young (2 ♂, 2 ♀), 7 old (7 ♂, 0 ♀). Nominal p values were calculated as two-sided t-test, no adjustment since only one gene set was tested. Source data are provided as a Source Data file.
Fig. 3
Fig. 3. The SenMayo gene set tracks genetic and pharmacologic clearance of senescent cells.
a The SenMayo panel successfully indicated aging in bone in mice (p value = 0.0023), n = 25 (12 young, 13 old (all ♀). Nominal p value, calculated as two-sided t-test, no adjustment since only one gene set was tested; b The elimination of p16Ink4a-expressing senescent cells by AP20187 administration was shown previously to reverse the aging bone phenotype. The SenMayo gene set successfully demonstrated the significant reversal of the aging phenotype at the gene expression level upon the elimination of p16Ink4a-expressing senescent cells (p = 0.0054), n = 29 (13 Veh, 16 AP (all ♀). Nominal p value, calculated as two-sided t-test, no adjustment since only one gene set was tested; c By specifically using the expression patterns of the SenMayo gene set, our bone RNA-seq revealed no similarities in gene expression patterns between young (blue) and old + veh (red) treated mice, and a substantial overlap of expression profiles of old + AP (green) mice with young mice. The highlighted genes represent variables, and the arrows drawn from the origin indicate their “weight” in different directions, according to the theories of Gabriel; d We used a previously published mRNA-seq dataset from human adipose tissue of our group, , to evaluate changes in SenMayo following D + Q treatment. Adipose tissue was collected before and 11 days after three days of oral D + Q treatment. Figure was designed using Biorender.com; e Using SenMayo, there was a reduction of SenMayo (p = 0.002) in the subcutaneous fat samples in the subjects treated with D + Q, consistent with a reduction in senescent cell burden following D + Q treatment (n = 9 (7 ♂, 2 ♀)). Nominal p value, calculated as two-sided t-test, no adjustment since only one gene set was tested. Source data are provided as a Source Data file.
Fig. 4
Fig. 4. SASP-associated hematopoietic cells in human bone marrow are mainly of monocytic origin and communicate via the MIF pathway.
a Using a previously published scRNA-seq dataset from human bone marrow (GSE120446, n = 68,478 cells), we performed GSEA at the single cell level to uncover cells responsible for senescence/SASP-associated gene expression. The highest enrichment score (ES) for the SenMayo gene set (purple) occurred within the CD14+ and CD16+ monocytic cell cluster, represented in a Uniform Manifold Approximation and Projection (UMAP). We selected the top 10% of senescence/SASP-expressing cells to form the “SASP cells” (n = 6850 cells) cluster displaying an (b) independent enrichment of canonical senescence genes including CDKN1A/p21CIP1 and TGFB1 and which was likewise enriched for two aging signatures (GenAge: genes associated with aging in model organisms; and CellAge: positively regulated genes associated with aging in human cells (SASP cells are marked purple). T-test with adjustment for multiple testing according to the hurdle model from MAST package (CDKN1A: p < 0.0001; TGFB1: p < 0.0001). c The SASP cells showed the highest interaction strength with T cells in the bone marrow, the numbers represent the relative interaction strength as sum of interaction weights. Edge weights are proportional to interaction strength, and a thicker line refers to a stronger signal ; d Among the interaction targets of SASP cells, T cells were predominantly targeted via the MHC-I, MIF, and PECAM1 pathways; e Members of the MIF and PECAM1 signaling pathways showed high expression patterns within the SASP population; f SASP cells were characterized by distinct co-expression patterns predicting functional clusters (e.g., JUN and CDKN2A), potentially overcoming difficulties of low expression of specific senescence-associated genes such as CDKN2A/P16ink4A. These strong indicators of co-expression were mathematically isolated by z-scores (Spearman correlation) (g) and spatially summarized (h) in sub-cell populations within the SASP cluster, as indicated by kernel gene-weighted density estimation in a t-distributed Stochastic Neighbor Embedding (tSNE) representation (EREGIL1B: p < 0.0001, ICAM1CDKN1A: p < 0.0001, JUNCDKN2A: p < 0.0001). ****p < 0.0001, n = 22 (10 ♂, 12 ♀). The error bands show a confidence interval level of 0.95. Boxplot minimum is the smallest value within 1.5 times interquartile range below 25th percentile, maximum is the largest value within 1.5 times interquartile range above 75th percentile. Centre is the 50th percentile (median), box bounds 25th and 75th percentile. Source data are provided as a Source Data file.
Fig. 5
Fig. 5. In murine bone and bone marrow mesenchymal cells, osteolineage cells constitute the largest proportion of SASP cells and communicate with osteolineage and chondrocytic cells via the MIF and PECAM1 pathways and show characteristics of terminal differentiation.
a We analyzed a publicly available murine bone and bone marrow gene set (GSE128423), and enriched 35,368 cells for the SenMayo gene set; b The top 10% senescence/SASP gene-expressing cells (n = 3537) were assigned to the “SASP cells” cluster. They displayed an increase in canonical markers of senescence including Cdkn1a/p21Cip1 and Tgfb1, and were enriched in the GenAge and CellAge gene sets (GenAge, CellAge); T-test with adjustment for multiple testing according to the hurdle model from MAST package (Cdkn1a: p < 0.0001, Tgfb1: p < 0.0001). c The strongest interaction of the SASP cells was narrowed down to chondrocytic cells, while the osteolineage cells were another important crosstalk neighbor, the numbers represent the relative interaction strength as sum of interaction weights. Edge weights are proportional to interaction strength, and a thicker line refers to a stronger signal. Two-sided unpaired t-test except for CCL2 in Cohort A: Kolmogorov–Smirnov test. d Outgoing interaction patterns of SASP cells (pink, left bottom quarter) indicated the importance of several signaling pathways that resulted in a significant enrichment of Mk, Angptl, Mif and Pecam1; (e) In pseudotime, the SASP cluster was most abundant in the terminal branches, and overexpressed Cdkn1a/p21Cip1 in terminal states (top-left inlay: the solid line represents the expression values as a function of pseudotime-progress, bottom red color on the left, terminal branch); f In their terminal differentiation, the SASP cluster was enriched in several factors, out of which distinct co-expressional patterns were extracted (Spearman correlation); g While the terminal differentiation was marked by a simultaneous loss of Pappa and Fgf7 (cluster 1, green in f), a significant correlation of Dkk1 with Cdkn2a/p16Ink41, likewise Bmp2 and Cdkn1a/p21Cip1, was mathematically predicted (cluster 2, pink in f). Fgf7–Pappa: p < 0.0001, Dkk1–Cdkn2a: p < 0.0001, Bmp2–Cdkn1a: p < 0.0001. ****p < 0.0001, n = 8 (4 bone, 4 bone marrow, all male). Depicted are mean ± SEM. The error bands show a confidence interval level of 0.95. Boxplot minimum is the smallest value within 1.5 times interquartile range below 25th percentile, maximum is the largest value within 1.5 times interquartile range above 75th percentile. Centre is the 50th percentile (median), box bounds 25th and 75th percentile. Source data are provided as a Source Data file.
Fig. 6
Fig. 6. The in silico predicted importance of the Mif pathway is reflected in the aged INK-ATTAC mouse model.
a We compared young (n = 12) and old vehicle-treated mice (n = 13), and old mice treated with AP (n = 16). a Upregulation of Mif was confirmed by RT-qPCR (n = 24 young (12 Veh, 12 old (all female), p = 0.0102)); b The clearance of senescent cells in the aged cohort by AP treatment reduced this Mif expression (n = 26 old [12 Veh, 14 AP, all female], p = 0.0459). *p < 0.05. Two-sided unpaired t-tests. Source data are provided as a Source Data file.

References

    1. Tchkonia T, Zhu Y, van Deursen J, Campisi J, Kirkland JL. Cellular senescence and the senescent secretory phenotype: therapeutic opportunities. J. Clin. Investig. 2013;123:966–972. doi: 10.1172/JCI64098. - DOI - PMC - PubMed
    1. LeBrasseur NK, Tchkonia T, Kirkland JL. Cellular senescence and the biology of aging, disease, and frailty. Nestle Nutr. Inst. workshop Ser. 2015;83:11–18. doi: 10.1159/000382054. - DOI - PMC - PubMed
    1. Swanson EC, Manning B, Zhang H, Lawrence JB. Higher-order unfolding of satellite heterochromatin is a consistent and early event in cell senescence. J. cell Biol. 2013;203:929–942. doi: 10.1083/jcb.201306073. - DOI - PMC - PubMed
    1. Zhu Y, Armstrong JL, Tchkonia T, Kirkland JL. Cellular senescence and the senescent secretory phenotype in age-related chronic diseases. Curr. Opin. Clin. Nutr. Metab. care. 2014;17:324–328. doi: 10.1097/MCO.0000000000000065. - DOI - PubMed
    1. Campisi J. Senescent cells, tumor suppression, and organismal aging: good citizens, bad neighbors. Cell. 2005;120:513–522. doi: 10.1016/j.cell.2005.02.003. - DOI - PubMed

Publication types