. 2022 Aug 16;5(1):116.
doi: 10.1038/s41746-022-00657-y.

A systems approach towards remote health-monitoring in older adults: Introducing a zero-interaction digital exhaust

Affiliations

A systems approach towards remote health-monitoring in older adults: Introducing a zero-interaction digital exhaust

Narayan Schütz et al. NPJ Digit Med. .

Abstract

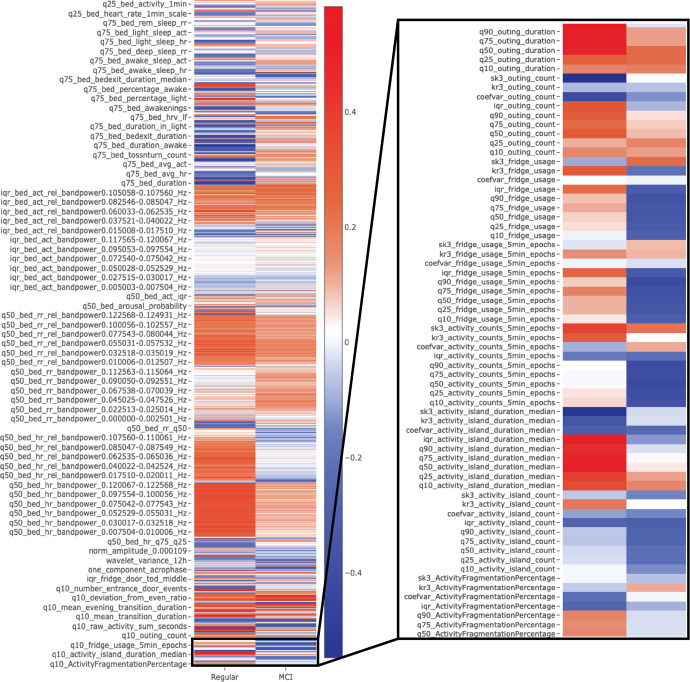
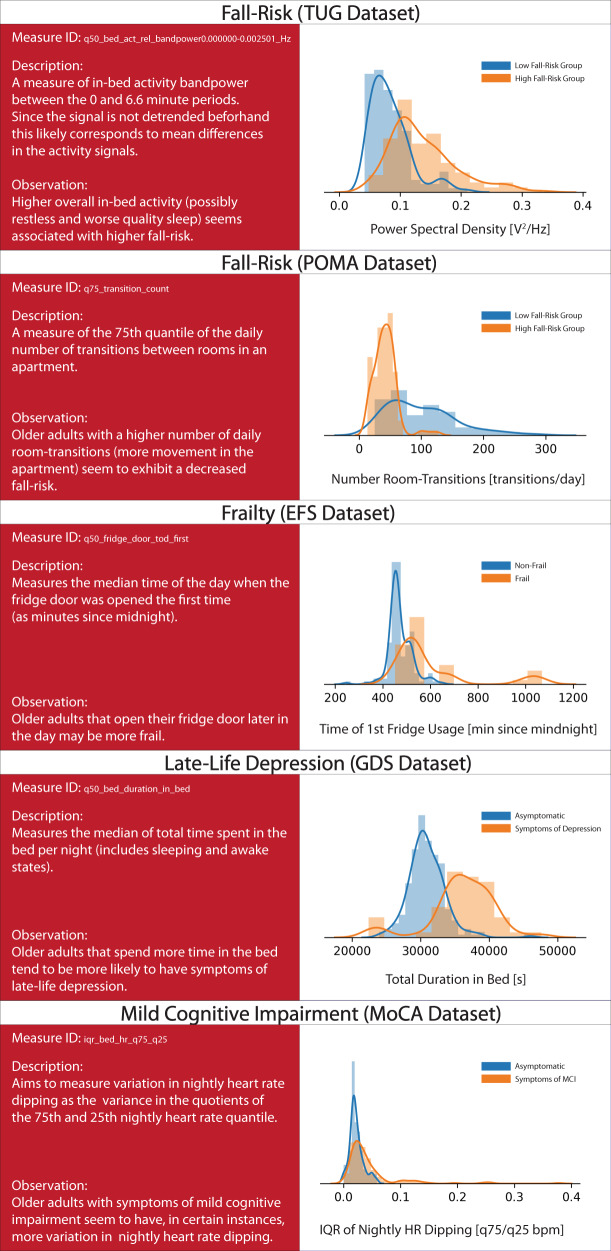
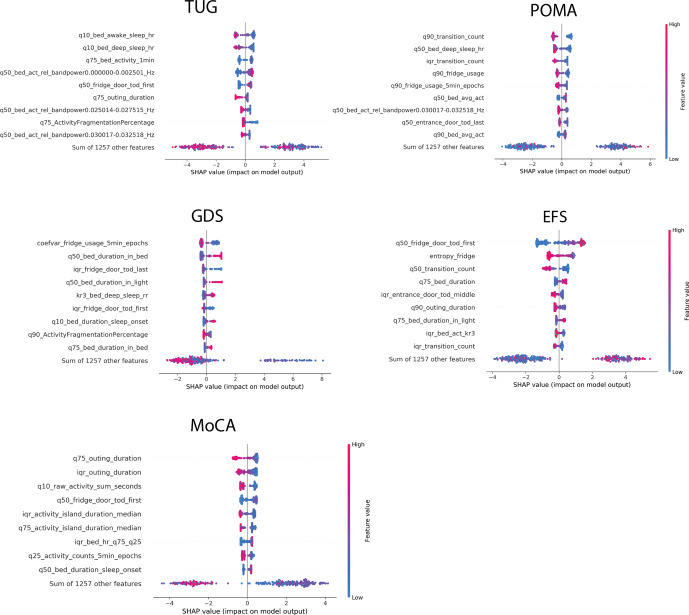
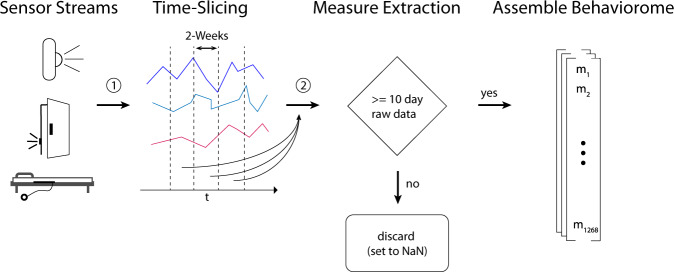
Using connected sensing devices to remotely monitor health is a promising way to help transition healthcare from a rather reactive to a more precision medicine oriented proactive approach, which could be particularly relevant in the face of rapid population ageing and the challenges it poses to healthcare systems. Sensor derived digital measures of health, such as digital biomarkers or digital clinical outcome assessments, may be used to monitor health status or the risk of adverse events like falls. Current research around such digital measures has largely focused on exploring the use of few individual measures obtained through mobile devices. However, especially for long-term applications in older adults, this choice of technology may not be ideal and could further add to the digital divide. Moreover, large-scale systems biology approaches, like genomics, have already proven beneficial in precision medicine, making it plausible that the same could also hold for remote-health monitoring. In this context, we introduce and describe a zero-interaction digital exhaust: a set of 1268 digital measures that cover large parts of a person's activity, behavior and physiology. Making this approach more inclusive of older adults, we base this set entirely on contactless, zero-interaction sensing technologies. Applying the resulting digital exhaust to real-world data, we then demonstrate the possibility to create multiple ageing relevant digital clinical outcome assessments. Paired with modern machine learning, we find these assessments to be surprisingly powerful and often on-par with mobile approaches. Lastly, we highlight the possibility to discover novel digital biomarkers based on this large-scale approach.


Conflict of interest statement

Dr. Philipp Buluschek and Dr. Narayan Schütz (effectively only after writing the article) were employed by DomoHealth SA, which is the manufacturer of one of the used sensor systems (PIR and door sensors). The remaining authors declare no competing financial or non-financial interests.

Figures

Fig. 1
Fig. 1. Exemplary visualizations of averaged digital exhausts.
Depicts an example of z-normalised, averaged digital exhausts of participants with mild cognitive impairment (MCI) (based on a Montreal Cognitive Assessment screening < 23 points). Digital measures > 0 (in blue) indicate above-average values for that group, while < 0 (red) indicates below-average values. Many digital measures visually differ in both examples. It should be noted that this is a down-scaled visualisation, as not all measures would fit in the figure. For the complete and interactive version, see the supplementary online version (Note the zoom-in functionality).
Fig. 2
Fig. 2. Most important digital measure for each outcome.
Displays descriptions and density plots of the most important digital measure for each outcome. Across all density plots, blue indicates a positive/neutral outcome, while orange indicates a negative outcome. It should be noted that the proposed associations reflect correlation and not causation and should be interpreted accordingly.
Fig. 3
Fig. 3. Beeswarm plot indicating digital measure importances across outcomes.
Shows beeswarm plots of the 9 most important digital measures based on SHAP values on all outcome datasets: TUG (Timed Up and Go) & POMA (Performance Oriented Mobility Assessment = fall risk, GDS (Geriatric Depression Scale) = late-life depression, EFS (Edmonton Frail Scale) = frailty, MoCA (Montreal Cognitive Assessment) = mild cognitive impairment. Finally, the contributions of the sum of the remaining measures is displayed. Digital measures are ordered according to their importance, from top to bottom. The x-axis represents log odds, where values above zero indicate relevance for a negative outcome. Colouring further shows the direction of this association, where blue indicates lower values of a given measure and red indicates higher respective measure values. Detailed explanations of the individual measure names are given in the supplementary material or on the supplementary website. Note that these plots are based on models trained on the whole respective dataset and are therefore slightly different from the global importances shown in Supplementary Table 3, which are based on 100 simulation iterations.
Fig. 4
Fig. 4. Digital measure extraction flowchart.
Shows a broad summary of how digital measures were calculated, starting with raw sensor data from PIR sensors, door sensors, and bed sensors. Raw data streams were first segmented into non-overlapping bi-weekly segments. Then, for each bi-weekly segment, digital measures were calculated. If, for a given measure, less than 10 days of data were present, the measure was encoded as missing, which eventually left 1268 dimensional vectors - one per bi-weekly segment.
Fig. 5
Fig. 5. Dataset creation overview.
Highlights the workflow of creating datasets, subsequently used for the creation of digital clinical outcome assessments. First, digital measures were separately calculated for the PIR + door and bed sensors and segmented into non-overlapping, bi-weekly segments. After that, the measures from bi-weekly segments, where the percentage of missing digital measures from either sensor system was < 30%, were combined. Next, the clinical assessments from each participant were matched with the respective bi-weekly digital measure vectors to combine 5 datasets --- one for each assessment.

References

    1. Bloom DE, Canning D, Lubet A. Global population aging: Facts, challenges, solutions & perspectives. Daedalus. 2015;144:80–92. doi: 10.1162/DAED_a_00332. - DOI
    1. Morley JE, Vellas B. Patient-centered (p4) medicine and the older person. J. American Med. Directors Asso. 2017;18:455–459. doi: 10.1016/j.jamda.2017.04.001. - DOI - PubMed
    1. Au R, Ritchie M, Hardy S, Ang TFA, Lin H. Aging well: Using precision to drive down costs and increase health quality. Adv Geriatric Med. Res. 2019;1:e190003. - PMC - PubMed
    1. Hood L. Systems biology and p4 medicine: past. Rambam Maimonides Med. J. 2013;4:e0012. doi: 10.5041/RMMJ.10112. - DOI - PMC - PubMed
    1. Flores M, Glusman G, Brogaard K, Price ND, Hood L. P4 medicine: How systems medicine will transform the healthcare sector and society. Personalized Med. 2013;10:565–576. doi: 10.2217/pme.13.57. - DOI - PMC - PubMed