. 2022 Nov;59(11):6613-6631.
doi: 10.1007/s12035-022-02987-0. Epub 2022 Aug 17.

AIF Overexpression Aggravates Oxidative Stress in Neonatal Male Mice After Hypoxia-Ischemia Injury

Affiliations

AIF Overexpression Aggravates Oxidative Stress in Neonatal Male Mice After Hypoxia-Ischemia Injury

Tao Li et al. Mol Neurobiol. 2022 Nov.

Abstract

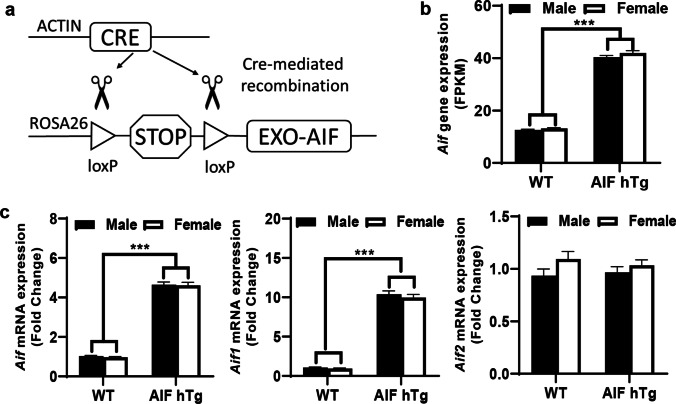
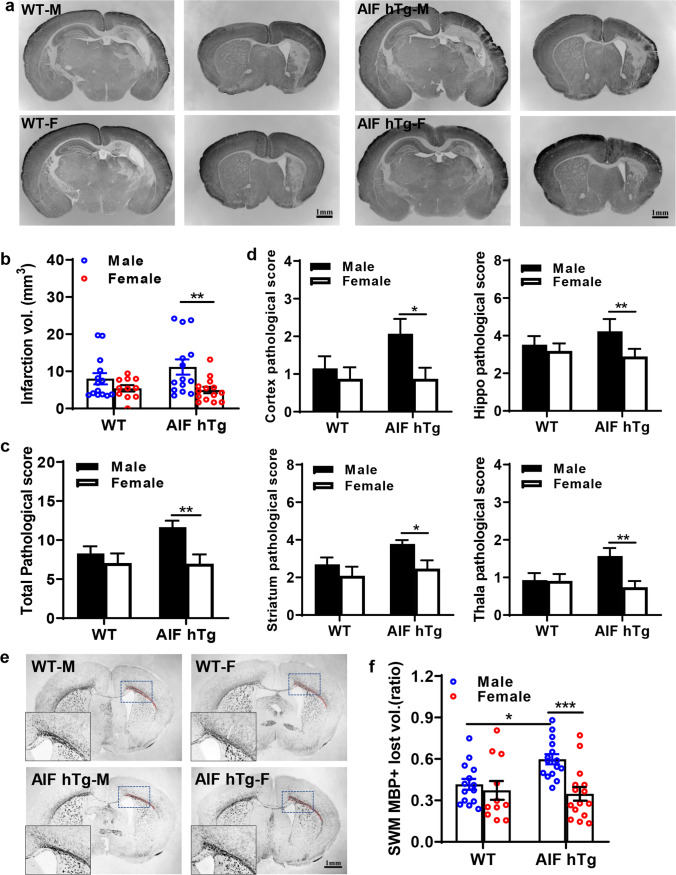
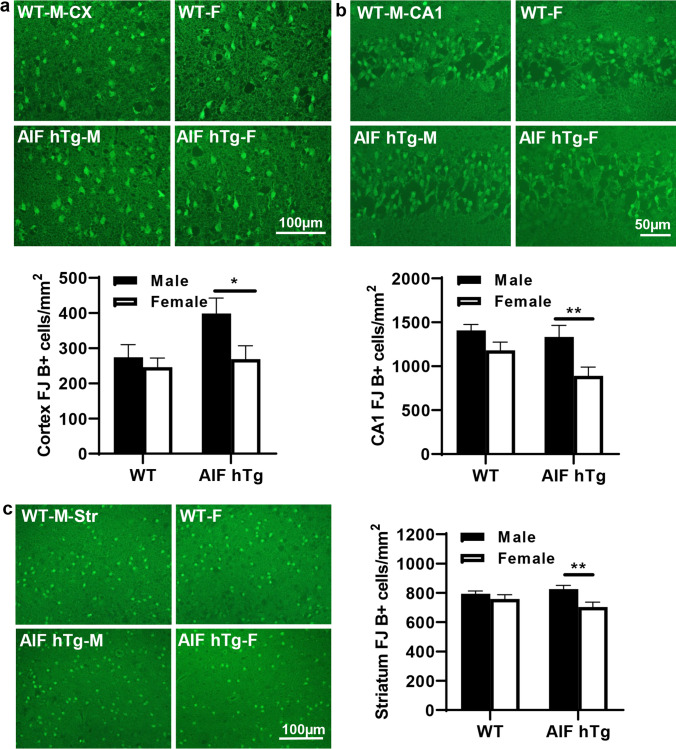
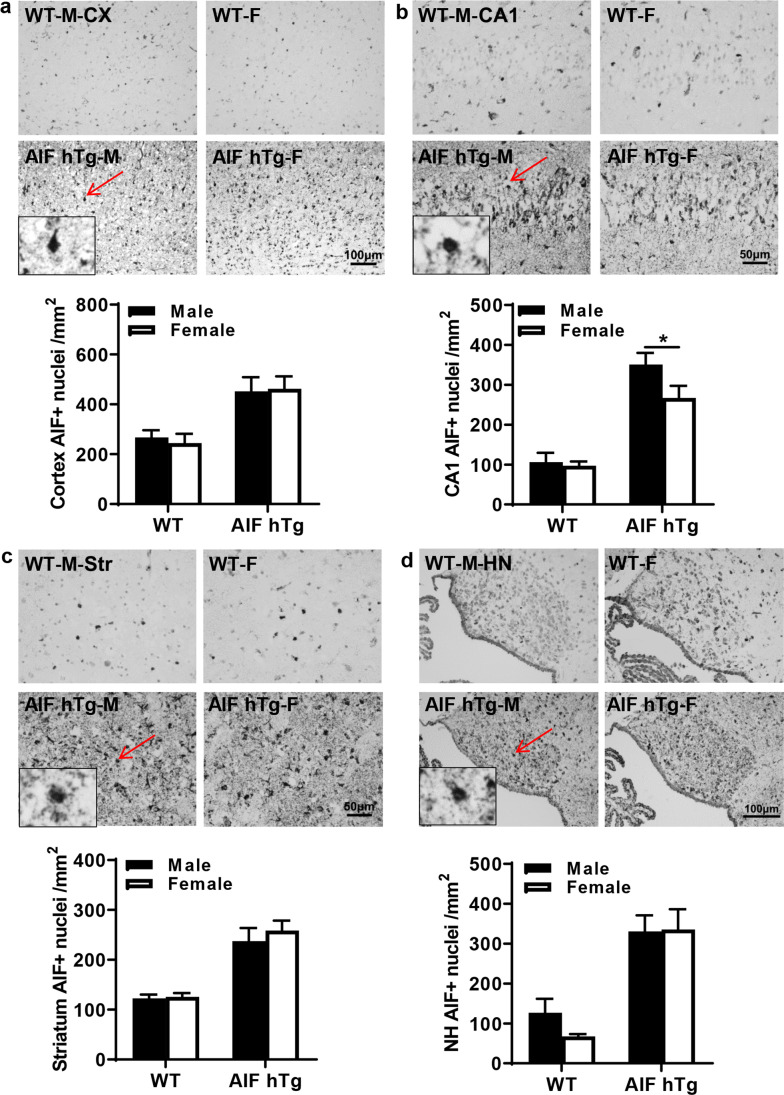
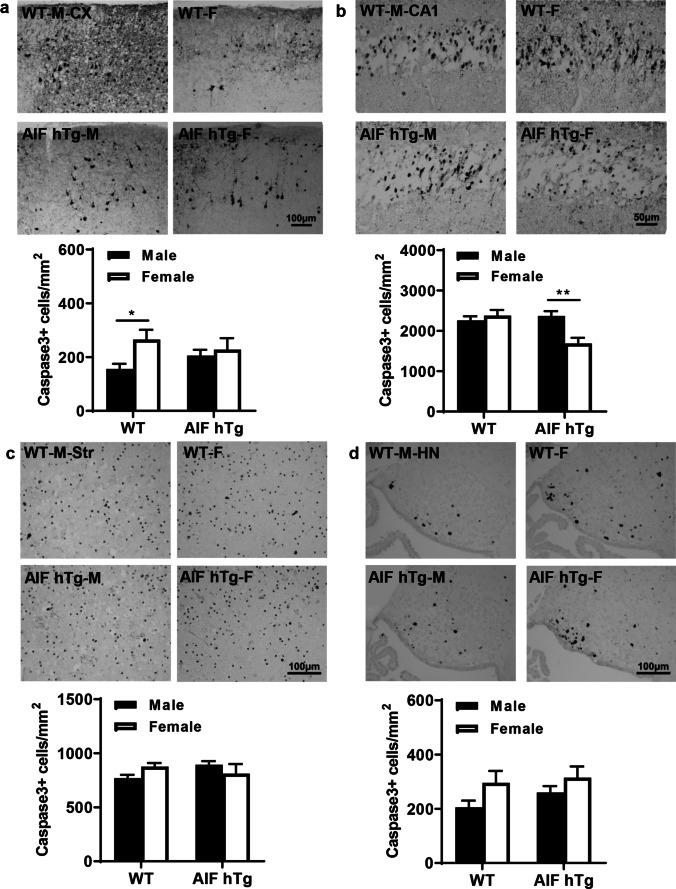
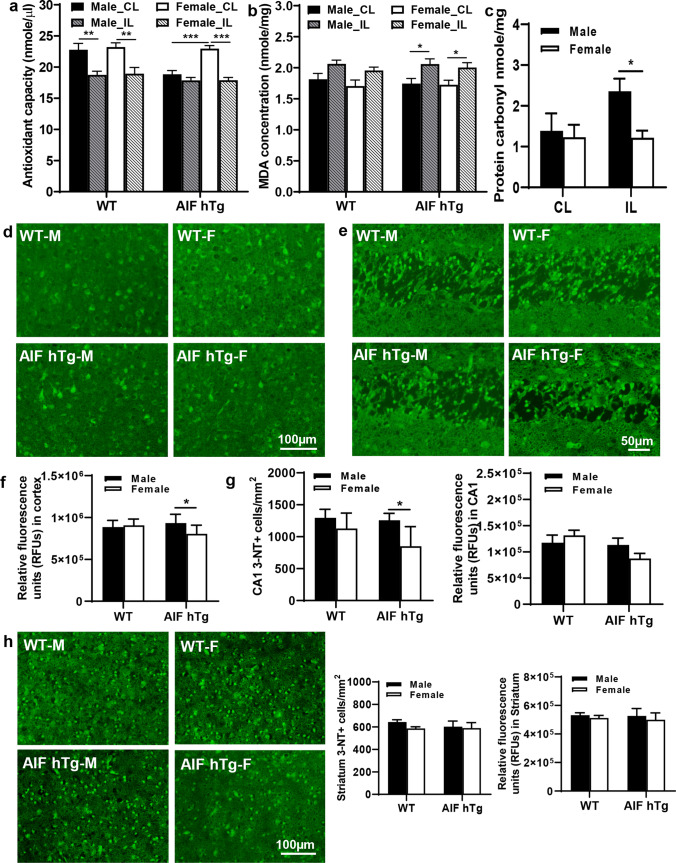
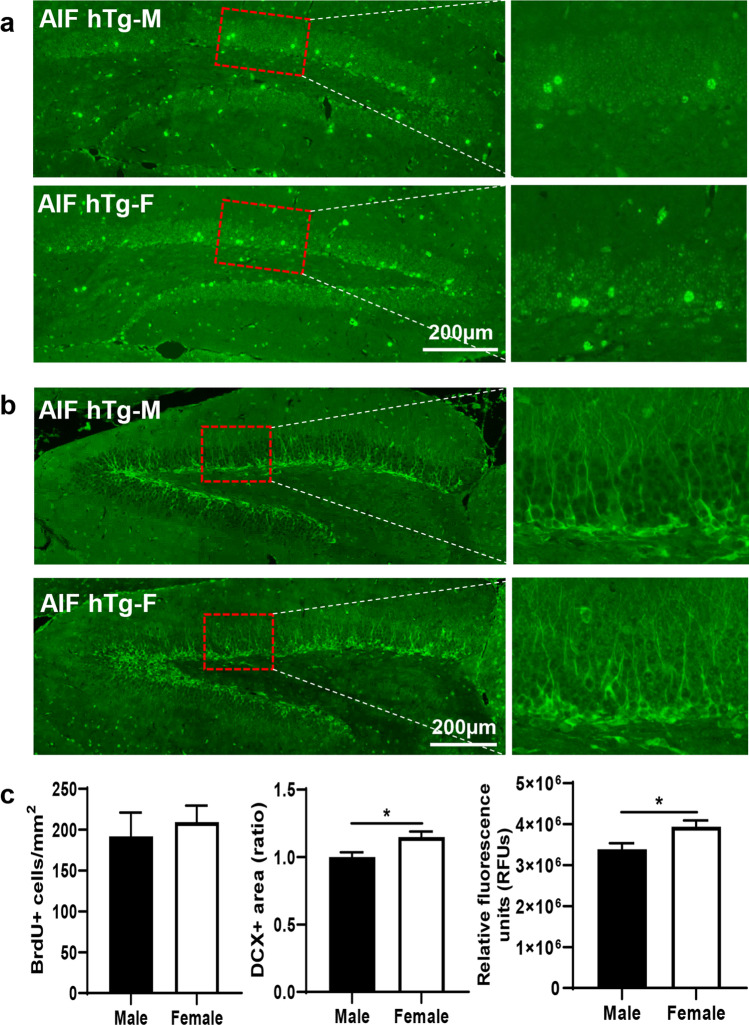
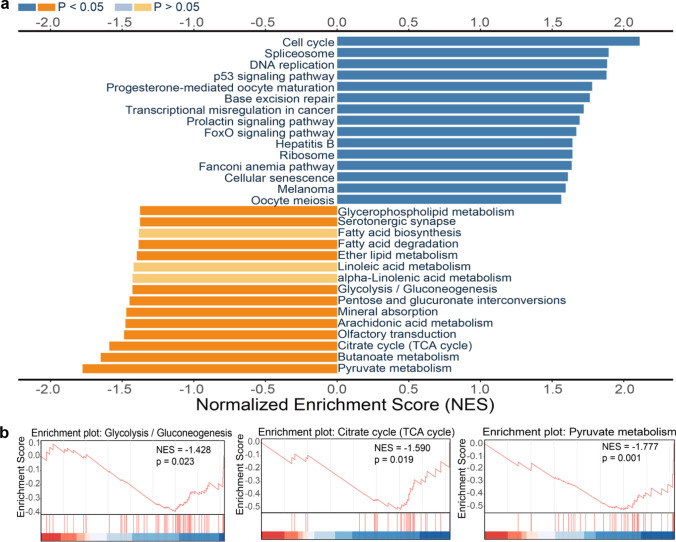
There are sex differences in the severity, mechanisms, and outcomes of neonatal hypoxia-ischemia (HI) brain injury, and apoptosis-inducing factor (AIF) may play a critical role in this discrepancy. Based on previous findings that AIF overexpression aggravates neonatal HI brain injury, we further investigated potential sex differences in the severity and molecular mechanisms underlying the injury using mice that overexpress AIF from homozygous transgenes. We found that the male sex significantly aggravated AIF-driven brain damage, as indicated by the injury volume in the gray matter (2.25 times greater in males) and by the lost volume of subcortical white matter (1.71 greater in males) after HI. As compared to females, male mice exhibited more severe brain injury, correlating with reduced antioxidant capacities, more pronounced protein carbonylation and nitration, and increased neuronal cell death. Under physiological conditions (without HI), the doublecortin-positive area in the dentate gyrus of females was 1.15 times larger than in males, indicating that AIF upregulation effectively promoted neurogenesis in females in the long term. We also found that AIF stimulated carbohydrate metabolism in young males. Altogether, these findings corroborate earlier studies and further demonstrate that AIF is involved in oxidative stress, which contributes to the sex-specific differences observed in neonatal HI brain injury.

Keywords: Apoptosis; Apoptosis-inducing factor; Hypoxia ischemia; Neonate; Oxidative stress; Sex difference.


Conflict of interest statement

The authors declare no competing interests.

Figures

Fig. 1
Fig. 1
Determination of AIF overexpression in AIF hTg mice. a Schematic figure of AIF-Tgflox/flox-actin-Cre mice. b Based on the FPKM data from the RNA-seq analysis, Aif expression was significantly increased in AIF hTg mice compared to WT mice under physiological conditions (n = 6/group). c The mRNA expression of different variants was determined at 24 h post-HI using RT-qPCR (n = 6/group). The total transcription of the Aif gene in AIF hTg mice was significantly higher than in WT mice, and this upregulation only existed for Aif1 and not for Aif2. Data are presented as the mean ± SEM and were analyzed using two-way ANOVA followed by Sidak’s post hoc test. ***p < 0.001
Fig. 2
Fig. 2
AIF overexpression leads to more severe brain injury in male mice after HI compared to female mice. a Representative MAP2 staining of coronal brain Sects. 72 h after HI in both sexes of WT and AIF hTg mice. The upper and lower left panels are the WT male and WT female groups at the dorsal and striatum level, respectively, and the upper and lower right panels are the AIF hTg male and AIF hTg female groups at the dorsal and striatum level, respectively. b The infarction volume was measured, and the total pathological score (c) and scores of different brain regions d, including the cortex (Cx), hippocampus (Hip), striatum (Str), and thalamus (Tha), were evaluated in both sexes of WT mice (n = 25, 14 males and 11 females) and AIF hTg mice (n = 28, 14 males and 14 females). e, f Representative MBP staining of coronal brain sections revealed the SWM area (surrounded by the red dashed line) in the IL hemisphere, and the tissue loss ratio in the SWM was quantified in both sexes of WT mice (n = 25, 14 males and 11 females) and AIF hTg mice (n = 30, 15 males and 15 females). Data are presented as the mean ± SEM and were analyzed using two-way ANOVA followed by Sidak’s post hoc test. *p < 0.05, **p < 0.01, ***p < 0.001
Fig. 3
Fig. 3
Neuronal cell death in both sexes of WT and AIF hTg mice after HI. Representative images of a the cortex, b the hippocampal CA1, and c the striatum by Fluoro-Jade staining at 24 h post-HI (upper panels), and quantification of Fluoro-Jade-positive cells in both sexes of WT and AIF hTg mice (lower panels) (n = 8/group). Cx = cortex, CA1 = cornus ammonis 1, Str = striatum. Data are presented as the mean number of Fluoro-Jade-positive cells ± SEM and were analyzed using two-way ANOVA followed by Sidak’s post hoc test. *p < 0.05, **p < 0.01
Fig. 4
Fig. 4
AIF nuclear translocation in different brain regions in both sexes of WT and AIF hTg mice after HI. Representative images of a the cortex, b the hippocampal CA1, c the striatum, and d the habenular nuclei by AIF staining at 24 h post-HI (upper panels) and quantification of AIF-positive nuclei in both sexes of WT and AIF hTg mice (lower panels) (n = 8/group). Cx, cortex; CA1, cornus ammonis 1; Str, striatum; HN, habenular nuclei. Data are presented as the mean number of AIF-positive nuclei ± SEM and were analyzed using two-way ANOVA followed by Sidak’s post hoc test. *p < 0.05
Fig. 5
Fig. 5
Caspase-3-positive cells in different brain regions in both sexes of WT and AIF hTg mice after HI. Representative images of a the cortex, b the hippocampal CA1, c the striatum, and d the habenular nuclei by active caspase-3 staining at 24 h post-HI (upper panels), and quantification of active caspase-3-positive cells in both sexes of WT and AIF hTg mice (lower panels) (n = 8/group). Cx, cortex CA1, cornus ammonis 1; Str, striatum; HN, habenular nuclei. Data are presented as the mean number of active caspase-3-positive cells ± SEM and were analyzed using two-way ANOVA followed by Sidak’s post hoc test. *p < 0.05, **p < 0.01
Fig. 6
Fig. 6
Oxidative stress responses were different between male and female AIF hTg mice after HI. The concentrations of total antioxidants (a) and MDA (b) in homogenates of cortical brain tissues were measured in males and females of both WT and AIF hTg mice using an ELISA kit (n = 6/group). The protein carbonylation (c) was determined further in both the CL hemisphere and IL hemisphere in both male and female AIF hTg mice using an ELISA kit (n = 6/group). Immunofluorescence staining was performed to determine the number of 3-NT-positive cells and RFUs of the 3-NT-positive area. d, f Representative 3-NT staining in the cortex in both sexes of WT and AIF hTg mice at 24 h post-HI and quantification of the RFUs of the 3-NT-positive area (n = 8/group). Representative 3-NT staining in CA1 (e, g) and the striatum (h) in both sexes of WT and AIF hTg mice at 24 h post-HI and quantification of the 3-NT-positive cells and RFUs of the 3-NT-positive area (n = 8/group). Data are presented as the mean ± SEM and were analyzed using two-way ANOVA followed by Sidak’s post hoc test. *p < 0.05, **p < 0.01, ***p < 0.001
Fig. 7
Fig. 7
Changes in neuronal proliferation between male and female AIF hTg mice under physiological conditions. Representative panoramic images of BrdU (a) and DCX (b) staining showing the dentate gyrus in male and female AIF hTg mice at P30. The number of BrdU-positive cells was quantified in the granular layer of the dentate gyrus, and the DCX-positive area and the RFUs of this area were quantified (n = 6/group). Data are presented as the mean ± SEM and were analyzed using Student’s t-test. *p < 0.05
Fig. 8
Fig. 8
GSEA in the cortex of AIF hTg mice under physiological conditions. a Based on the p-value, the top 15 positively and negatively enriched KEGG pathways were selected to plot against the normalized enrichment score. Dark blue and deep orange represent p < 0.05, and light blue and light orange represent pathways with p > 0.05. b Energy metabolism-related pathways—including glycolysis (gluconeogenesis), the citrate cycle (TCA cycle), and pyruvate metabolism—were enriched according to GSEA, and the normalized enrichment scores and p-values are shown in the enrichment plot

Similar articles

Cited by

References

    1. Greco P, Nencini G, Piva I, Scioscia M, Volta CA, Spadaro S, Neri M, Bonaccorsi G, et al. Pathophysiology of hypoxic-ischemic encephalopathy: a review of the past and a view on the future. Acta Neurol Belg. 2020;120(2):277–288. doi: 10.1007/s13760-020-01308-3. - DOI - PubMed
    1. Bano S, Chaudhary V, Garga UC. Neonatal hypoxic-ischemic encephalopathy: a radiological review. J Pediatr Neurosci. 2017;12(1):1–6. doi: 10.4103/1817-1745.205646. - DOI - PMC - PubMed
    1. Rocha-Ferreira E, Hristova M. Plasticity in the neonatal brain following hypoxic-ischaemic injury. Neural Plast. 2016;2016:4901014. doi: 10.1155/2016/4901014. - DOI - PMC - PubMed
    1. Sequeira A, Gil J, Sampaio I, Moniz C, Graca A. Therapeutic hypothermia for neonatal hypoxic-ischemic encephalopathy: 10-year experience. Revista Portuguesa de Pediatria. 2021;52:21–29. doi: 10.25754/pjp.2021.20006. - DOI
    1. Rocha-Ferreira E, Vincent A, Bright S, Peebles DM, Hristova M. The duration of hypothermia affects short-term neuroprotection in a mouse model of neonatal hypoxic ischaemic injury. PLoS One. 2018;13(7):e0199890. doi: 10.1371/journal.pone.0199890. - DOI - PMC - PubMed

LinkOut - more resources