. 2022 Aug 16;22(1):401.
doi: 10.1186/s12870-022-03762-y.

Integrative analysis of transcriptome and metabolome reveals flavonoid biosynthesis regulation in Rhododendron pulchrum petals

Affiliations

Integrative analysis of transcriptome and metabolome reveals flavonoid biosynthesis regulation in Rhododendron pulchrum petals

Xi Xia et al. BMC Plant Biol. .

Abstract

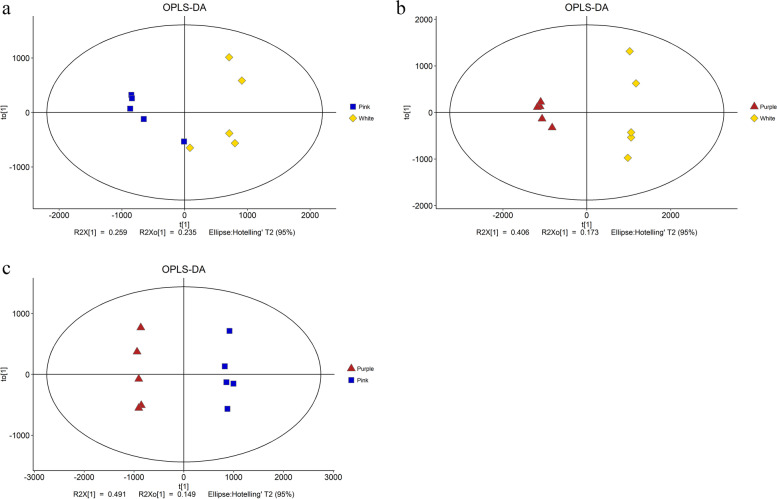
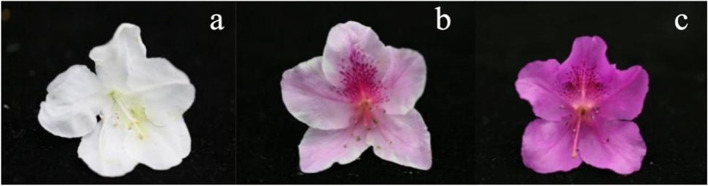
Background: Color is the major ornamental feature of the Rhododendron genus, and it is related to the contents of flavonoid in petals. However, the regulatory mechanism of flavonoid biosynthesis in Rhododendron pulchrum remains unknown. The transcriptome and metabolome analysis of Rhododendron pulchrum with white, pink and purple color in this study aimed to reveal the mechanism of flavonoid biosynthesis and to provide insight for improving the petal color.

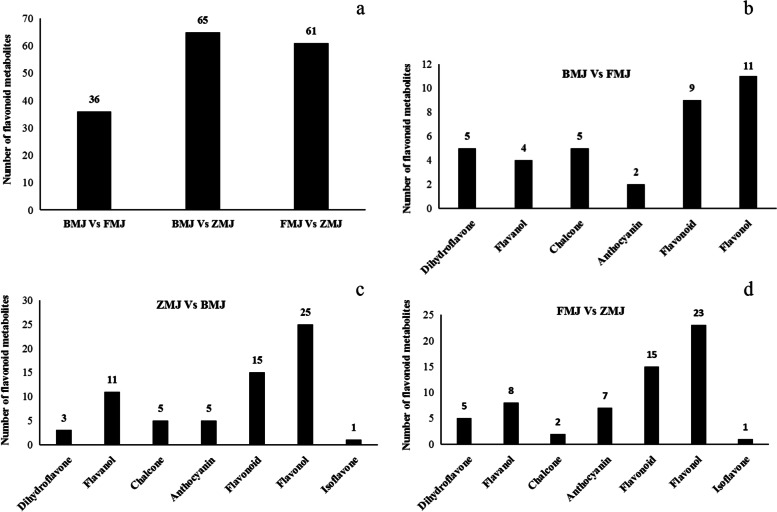
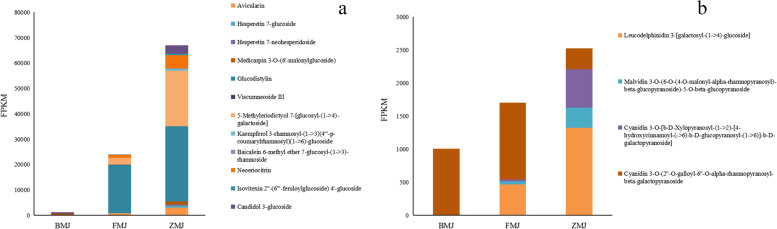
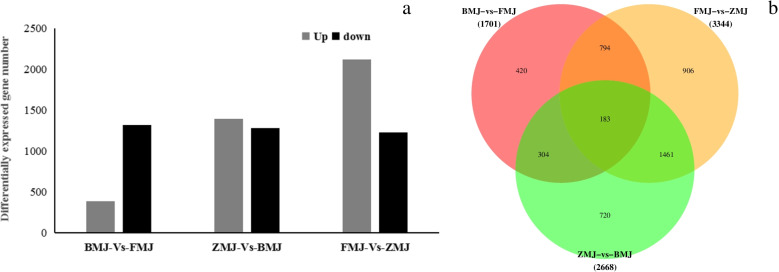
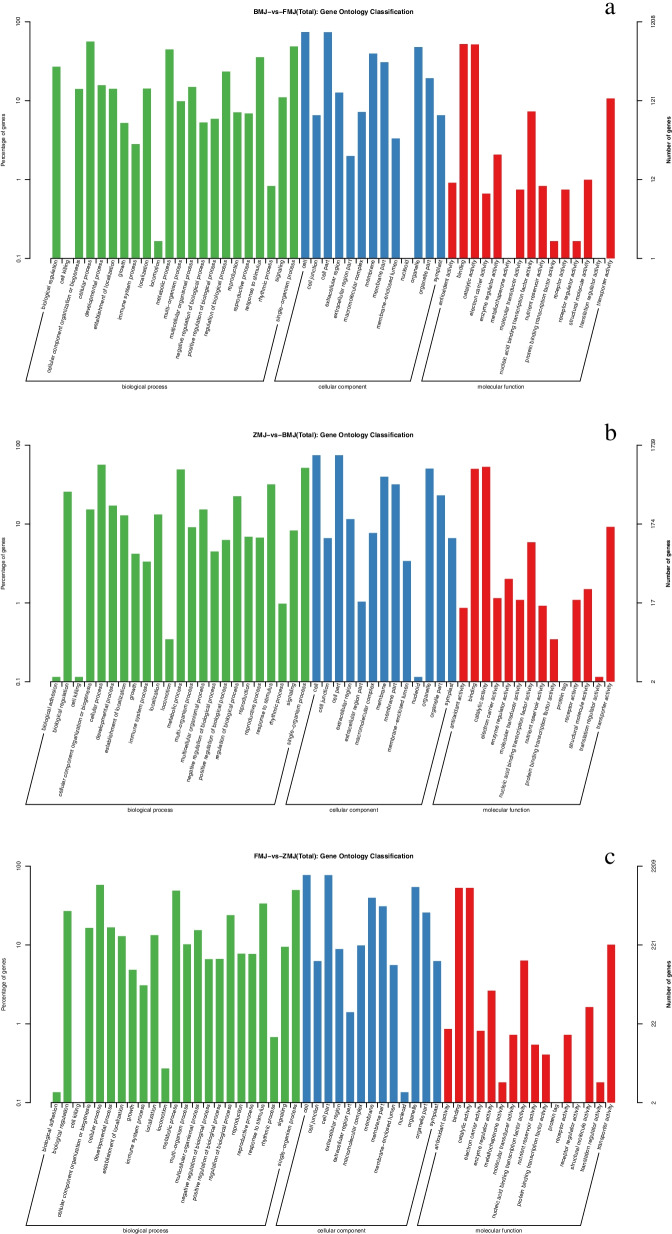
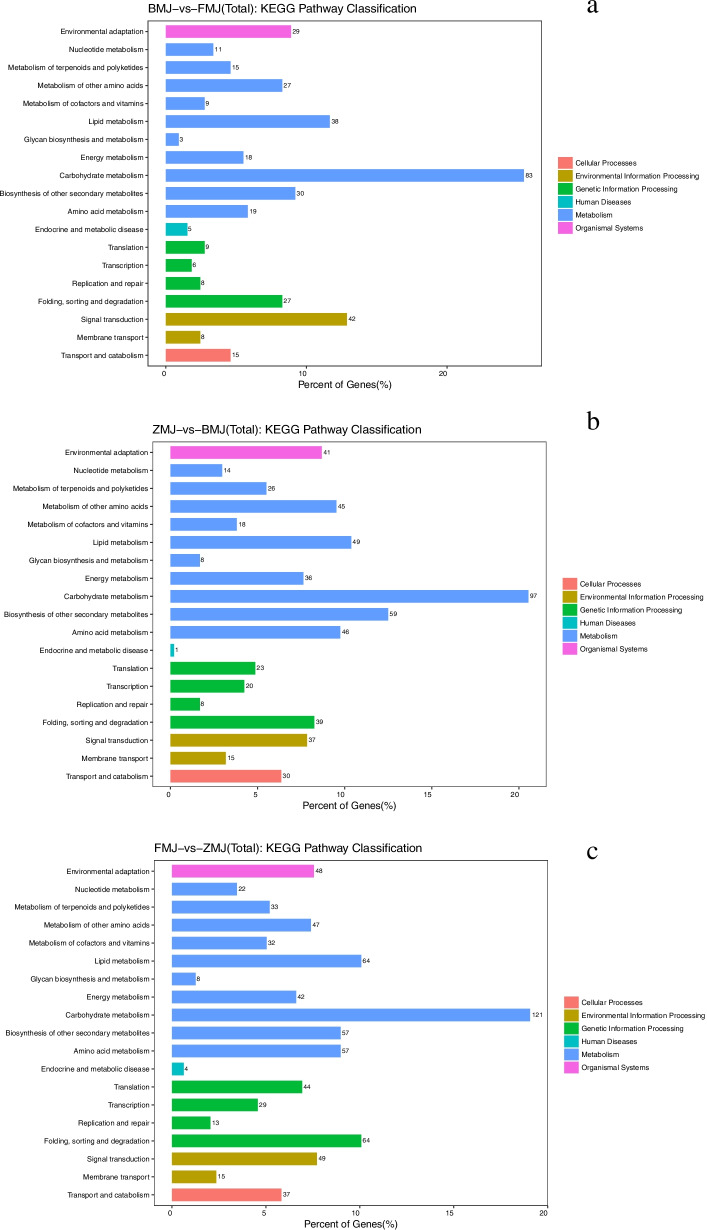
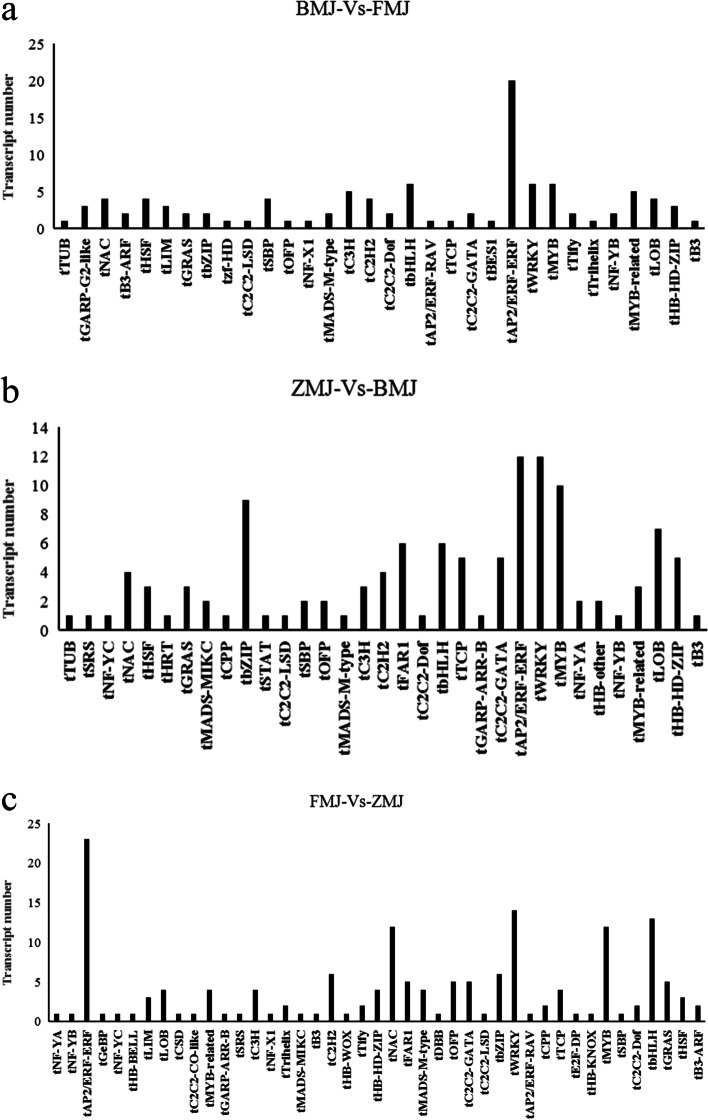
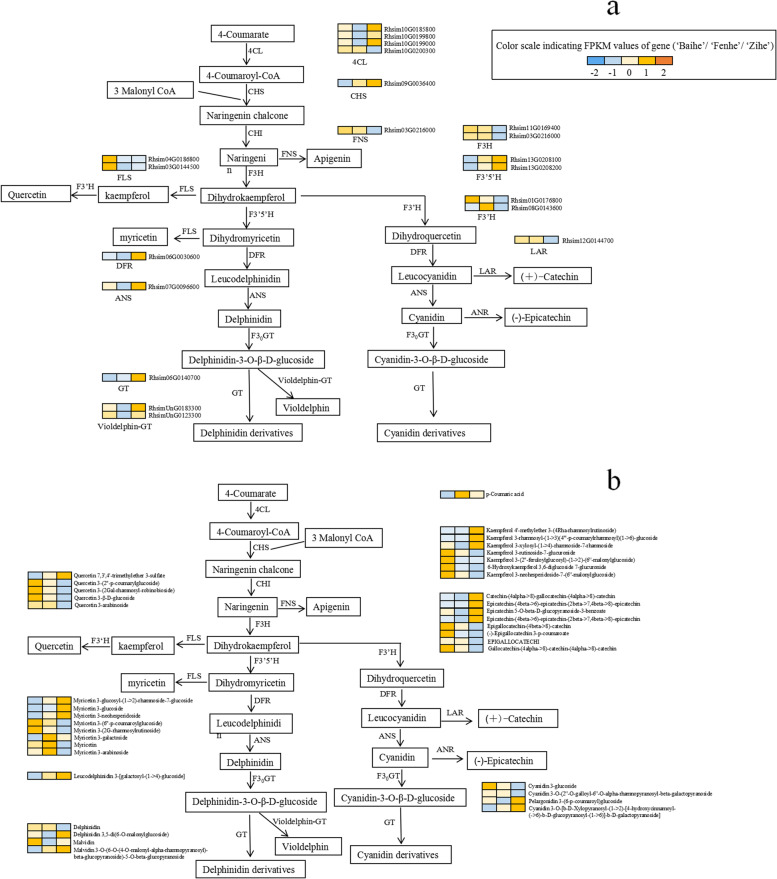
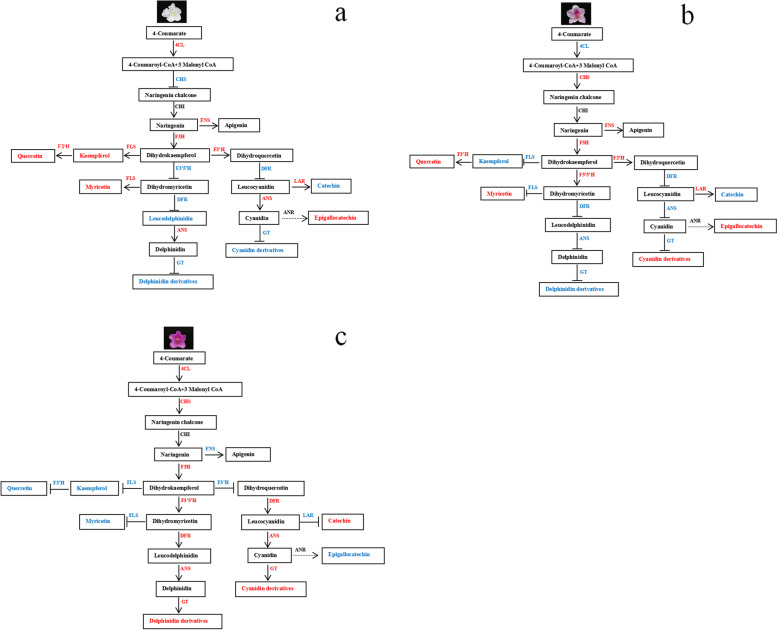
Results: Flavonoids and flavonols are the major components of flavonoid metabolites in R.pulchrum, such as laricitrin, apigenin, tricin, luteolin, isoorientin, isoscutellarein, diosmetin and their glycosides derivatives. With transcriptome and metabolome analysis, we found CHS, FLS, F3'H, F3'5'H, DFR, ANS, GT, FNS, IFR and FAOMT genes showed significantly differential expression in cultivar 'Zihe'. FNS and IFR were discovered to be associated with coloration in R.pulchrum for the first time. The FNS gene existed in the form of FNSI. The IFR gene and its related metabolites of medicarpin derivatives were highly expressed in purple petal. In cultivar 'Fenhe', up-regulation of F3'H and F3'5'H and down-regulation of 4CL, DFR, ANS, and GT were associated with pink coloration. With the transcription factor analysis, a subfamily of DREBs was found to be specifically enriched in pink petals. This suggested that the DREB family play an important role in pink coloration. In cultivars 'Baihe', flavonoid biosynthesis was inhibited by low expression of CHS, while pigment accumulation was inhibited by low expression of F3'5'H, DFR, and GT, which led to a white coloration.

Conclusions: By analyzing the transcriptome and metabolome of R.pulchrum, principal differential expression genes and metabolites of flavonoid biosynthesis pathway were identified. Many novel metabolites, genes, and transcription factors associated with coloration have been discovered. To reveal the mechanism of the coloration of different petals, a model of the flavonoid biosynthesis pathway of R.pulchrum was constructed. These results provide in depth information regarding the coloration of the petals and the flavonoid metabolism of R.pulcherum. The study of transcriptome and metabolome profiling gains insight for further genetic improvement in Rhododendron.

Keywords: Flavonoid biosynthesis; Metabolome; Rhododendron pulchrum; Transcriptome.


Conflict of interest statement

The authors declare that they have no competing interests.

Figures

Fig. 1
Fig. 1
OPLS-DA score plot of three materials and numbers of potential markers for each color petals. Note: a OPLS-DA score plot of ‘Baihe’ and ‘Fenhe’ petals; b OPLS-DA score plot of ‘Zihe’ and ‘Baihe’ petals; c OPLS-DA score plot of ‘Fenhe’ and ‘Zihe’ petals
Fig. 2
Fig. 2
Flavonoid metabolites in R.pulchrum with different colors. Note: BMJ, cultivar ‘Baihe’; FMJ, cultivar ‘Fenhe’; ZMJ, cultivar ‘Zihe’. a Measurement of total flavonoids in R.pulchrum with different colors. b Flavonoid metabolites in ‘Baihe’ and ‘Fenhe’. c Flavonoid metabolites in ‘Zihe’ and ‘Baihe’. d Flavonoid metabolites in ‘Fenhe’ and ‘Zihe’
Fig. 3
Fig. 3
Fold change of the flavonoid and anthocyanin metabolites in R.pulchrum with different colors. Note: BMJ, cultivar ‘Baihe’; FMJ, cultivar ‘Fenhe’; ZMJ, cultivar ‘Zihe’. a Flod change of the flavonoid metabolites. b Fold change of the anthocyanin metabolites
Fig. 4
Fig. 4
Differently expressed genes in R.pulchrum with different colors. Note: a Statistic of differently expressed gene in cultivars 'Baihe'(BMJ),'Fenhe'(FMJ) and 'Zihe'(ZMJ). b The Venn diagram of differently expressed gene between three R.pulchrum cultivars
Fig.5
Fig.5
Transcript GO annotation classification statistics graph in three comparison groups. Note: BMJ, cultivar ‘Baihe’; FMJ, cultivar ‘Fenhe’; ZMJ, cultivar ‘Zihe’. a Transcript GO annotation classification between BMJ and FMJ; b Transcript GO annotation classification between ZMJ and BMJ; c Transcript GO annotation classification between FMJ and ZMJ
Fig. 6
Fig. 6
KEGG pathway classification statistics graph in three comparison groups. Note: BMJ, cultivar ‘Baihe’; FMJ, cultivar ‘Fenhe’; ZMJ, cultivar ‘Zihe’. a KEGG pathway classification statistics between BMJ and FMJ; b KEGG pathway classification statistics between ZMJ and BMJ; c KEGG pathway classification statistics between FMJ and ZMJ
Fig. 7
Fig. 7
Distribution of transcription factor types in three comparison groups. Note: BMJ, cultivar ‘Baihe’; FMJ, cultivar ‘Fenhe’; ZMJ, cultivar ‘Zihe’. a Distribution of transcription factor types in BMJ and FMJ group; b Distribution of transcription factor types in ZMJ and BMJ group; a Distribution of transcription factor types in FMJ and ZMJ group
Fig. 8
Fig. 8
Biosynthesis pathway of flavonoid in three different color petals of R.pulchrum Sweet. Note: a Key structural genes and their expression level of involved in flavonoid biosynthesis pathway in R.pulchrum Sweet with different colors. b The expression levels of differential metabolites in flavonoid synthesis pathway
Fig. 9
Fig. 9
A model for the flavonoid biosynthesis pathway in three different color petals of R.pulchrum Sweet. Note: a cultivar ‘Baihe’. b cultivar ‘Fenhe’. c cultivar ‘Zihe’. The red color indicates genes and metabolites with high expression, and the blue color indicates genes and metabolites with low expression
Fig. 10
Fig. 10
WGCNA of genes in three different color petals of R.pulchrum Sweet. a Hierarchical clustering tree (cluster dendrogram) results showed 12 expression modules, labeled with different colors. b Module–sample association. Each row corresponds to a module, labeled with a color as in (a). The number of genes in each module is indicated on the left
Fig. 11
Fig. 11
Coexpression network analysis in three different color petals of R.pulchrum Sweet. (a), (c), (e), (g), and (i) Heatmaps showing genes in cyan, midnightblue, mediumpurple3, lightcyan1, and grey60 modules that were significantly over-represented in BMJ, FMJ, and ZMJ, respectively. (b), (d), (f), (h), and (j) The correlation networks in the module corresponding to (a), (c), (e), (g), and (i), respectively. Candidate hub genes are shown in red
Fig. 12
Fig. 12
Three different colors of Rhododendron pulchrum Sweet. Note: a. ‘Baihe’; b.‘Fenhe’; c.‘Zihe’

Similar articles

Cited by

References

    1. Yoshida K, Toyama-Kato Y, Kameda K, Kondo T. Sepal color variation of Hydrangea macrophylla and vacuolar pH measured with a proton-selective microelectrode. Plant Cell Physiol. 2003;44:262–268. doi: 10.1093/pcp/pcg033. - DOI - PubMed
    1. Liu L, Zhang LY, Wang SL, Niu XY. Analysis of anthocyanins and flavonols in petals of 10 Rhododendron species from the Sygera Mountains in Southeast Tibet. Plant Physiol Biochem. 2016;104:250–256. doi: 10.1016/j.plaphy.2016.03.036. - DOI - PubMed
    1. Hang NTT, Miyajima I, Ureshino K, Masuda JI, Okubo H. Comparison of morphological characteristics of Rhododendron simsii. Planch distributed in Vietnam and Japan. J Faculty of Agriculture Kyushu Univ. 2010;55(2):233–237. doi: 10.5109/18835. - DOI
    1. Dong XK, Chen W, Wang WS, Zhang HY, Liu XQ, Luo J. Comprehensive profiling and natural variation of flavonoids in rice. J Integr Plant Biol. 2014;56:876–886. doi: 10.1111/jipb.12204. - DOI - PubMed
    1. Jiang T, Zhang MD, Wen CX, Xie XL, Tian W, Wen SQ, Lu RK, Liu LD. Integrated metabolomic and transcriptomic analysis of the anthocyanin regulatory networks in Salvia miltiorrhiza Bge. flowers. BMC Plant Biol. 2020;20(1):349. doi: 10.1186/s12870-020-02553-7. - DOI - PMC - PubMed

LinkOut - more resources