. 2022 Aug 16;10(1):113.
doi: 10.1186/s40478-022-01417-5.

Modeling the early stages of Alzheimer's disease by administering intracerebroventricular injections of human native Aβ oligomers to rats

Affiliations

Modeling the early stages of Alzheimer's disease by administering intracerebroventricular injections of human native Aβ oligomers to rats

Eva Baerends et al. Acta Neuropathol Commun. .

Abstract

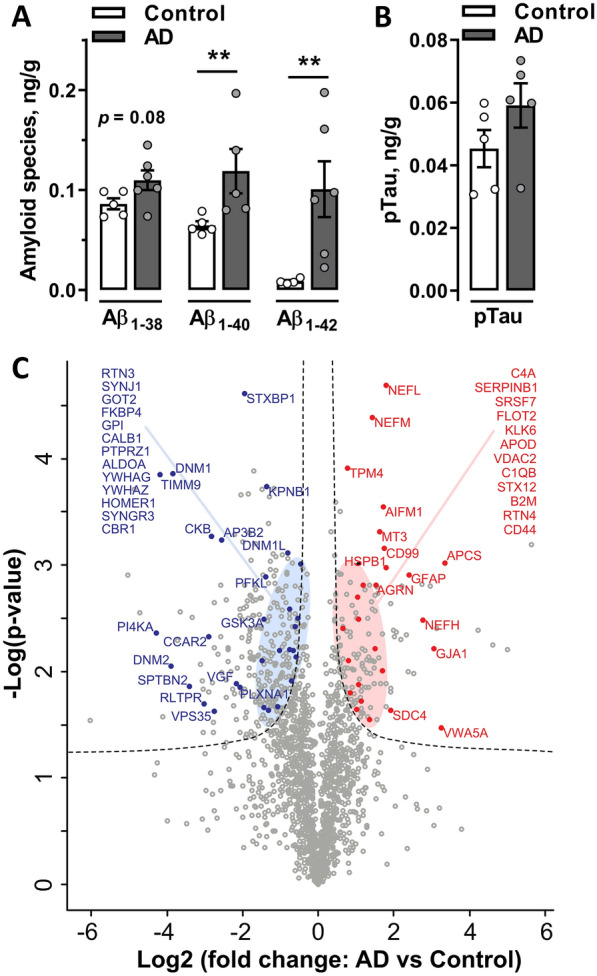
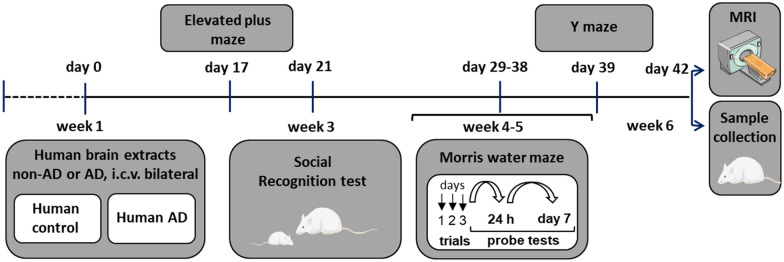
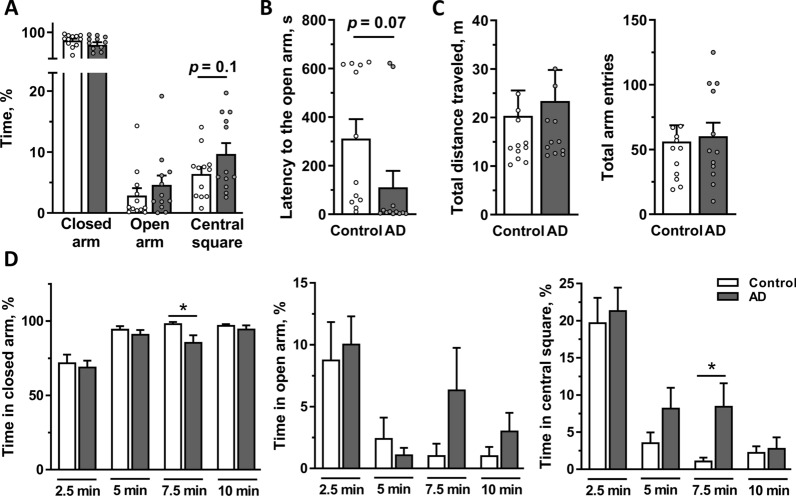
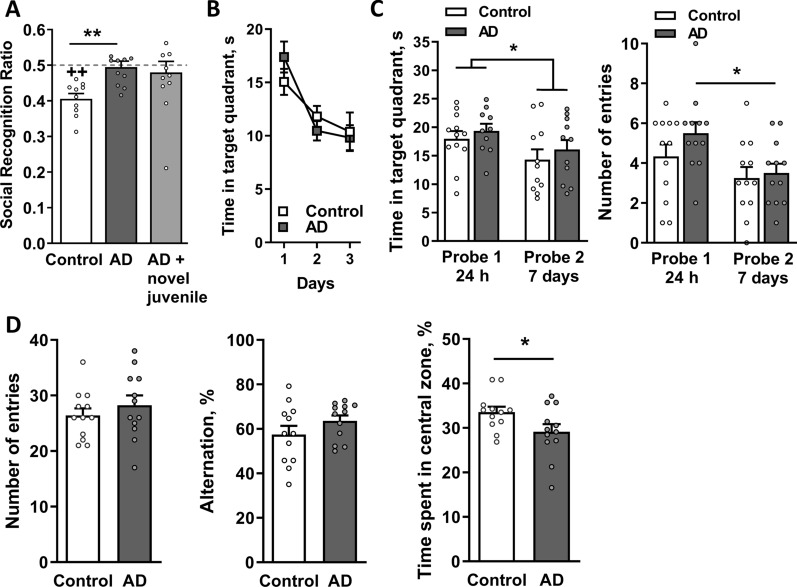
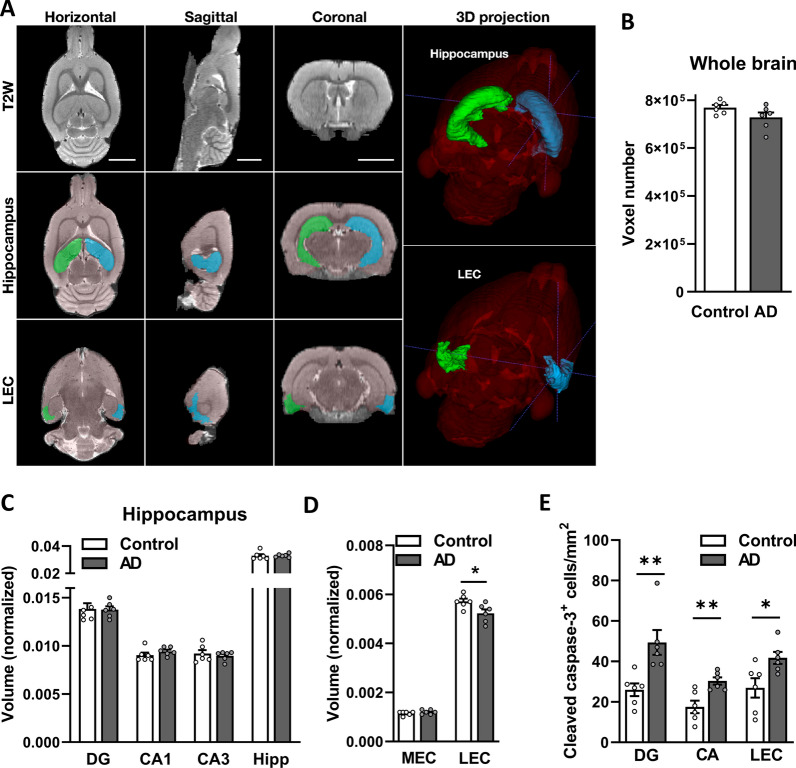
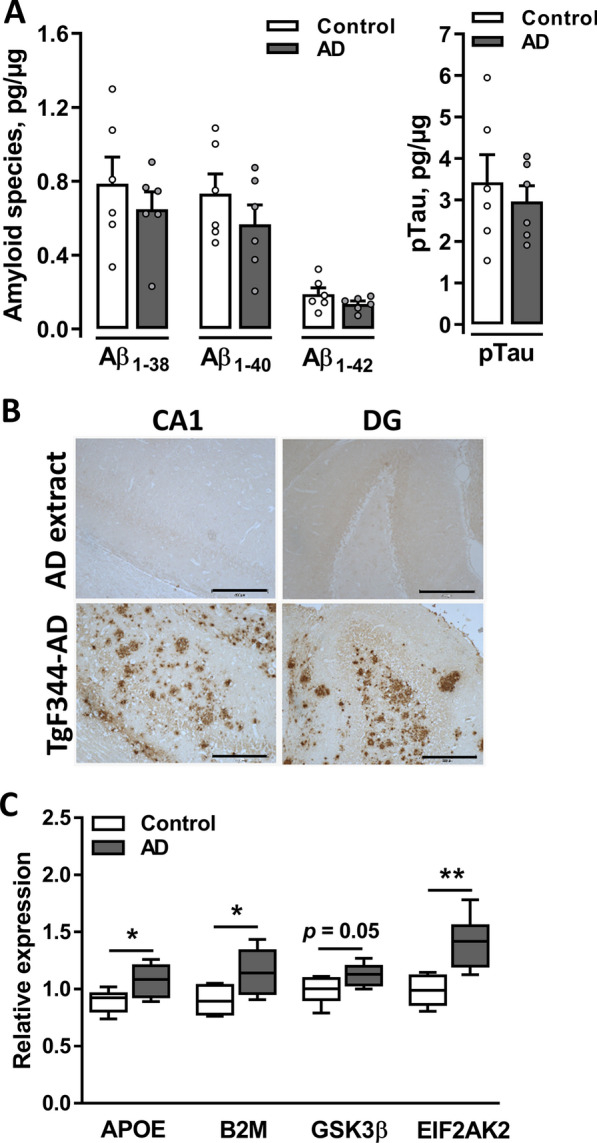
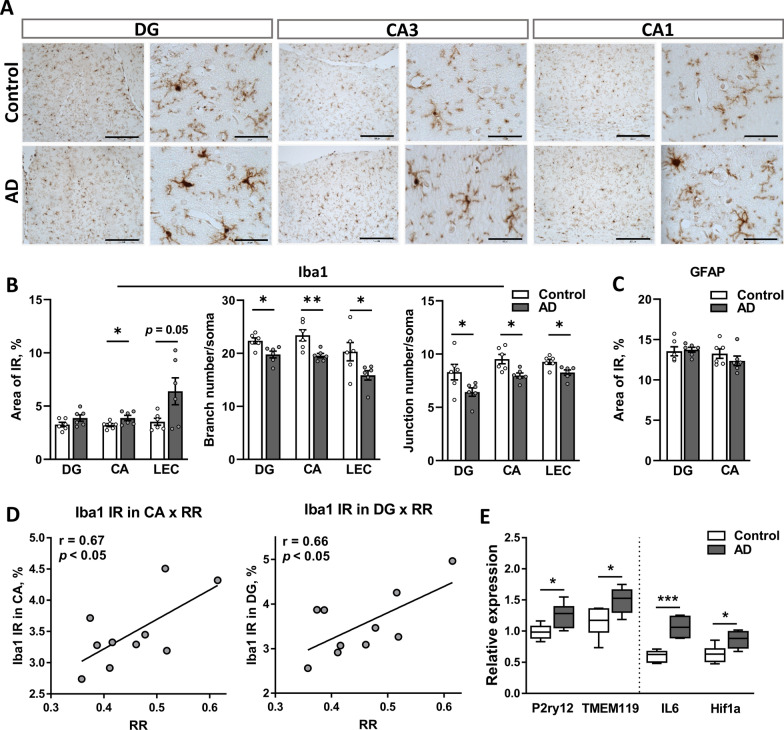
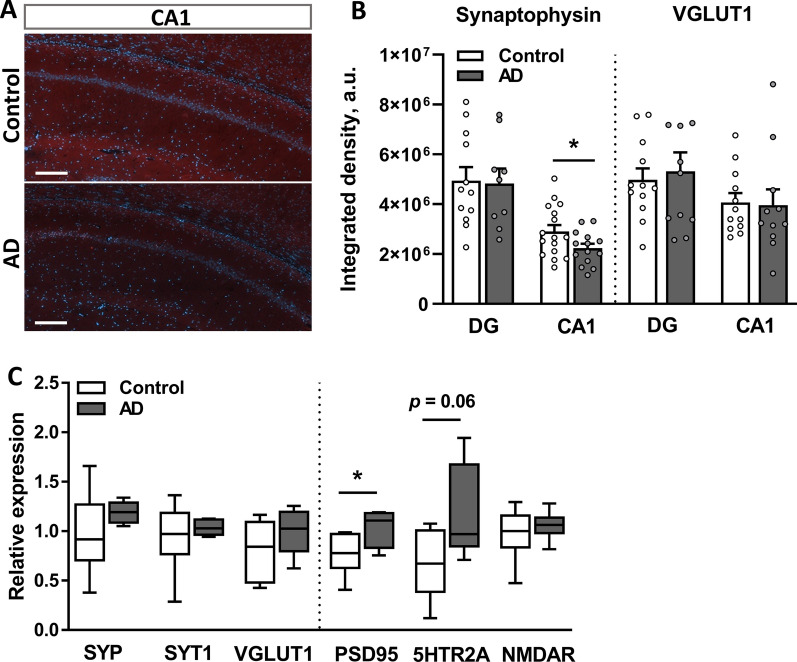
Alzheimer's disease (AD) is a progressive and irreversible neurodegenerative disease characterized by the accumulation of aggregated amyloid beta (Aβ) and hyperphosphorylated tau along with a slow decline in cognitive functions. Unlike advanced AD, the initial steps of AD pathophysiology have been poorly investigated, partially due to limited availability of animal models focused on the early, plaque-free stages of the disease. The aim of this study was to evaluate the early behavioral, anatomical and molecular alterations in wild-type rats following intracerebroventricular injections of human Aβ oligomers (AβOs). Bioactive human AD and nondemented control brain tissue extracts were characterized using ELISA and proteomics approaches. Following a bilateral infusion, rats underwent behavioral testing, including the elevated plus maze, social recognition test, Morris water maze and Y-maze within 6 weeks postinjection. An analysis of brain structure was performed with manganese-enhanced MRI. Collected brain tissues were analyzed using stereology, immunohistochemistry, ELISA and qPCR. No sensorimotor deficits affecting motor performance on different maze tasks were observed, nor was spatial memory disturbed in AD rats. In contrast, a significant impairment of social memory became evident at 21 days postinjection. This deficit was associated with a significantly decreased volume of the lateral entorhinal cortex and a tendency toward a decrease in the total brain volume. Significant increase of cleaved caspase-3-positive cells, microglial activation and proinflammatory responses accompanied by altered expression of synaptic markers were observed in the hippocampus of AD rats with immunohistochemical and qPCR approaches at 6 weeks postinjection. Our data suggest that the social memory impairment observed in AβO-injected rats might be determined by neuroinflammatory responses and synaptopathy. An infusion of native oligomeric Aβ in the rat brain represents a feasible tool to model early plaque-free events associated with AD.

Keywords: Alzheimer’s disease; Hippocampus; Lateral entorhinal cortex; Neuroinflammation; Social recognition.


Conflict of interest statement

All authors have no conflicts of interest to declare.

Figures

Fig. 1
Fig. 1
Characterization of water-soluble proteins eluted from AD and non-AD human brain tissues. A The eluted soluble fraction from human brains were enriched in Aβ1–40 and Aβ1–42 and showed a tendency toward Aβ1–38 enrichment in individual AD extracts (n = 6) compared to non-AD control samples (n = 5). **p < 0.01. B The levels of pTau were not significantly different between AD and control protein extracts (n = 5 per group). Data are presented as the means ± SEM. C Volcano plot visualizing up- and downregulated proteins (FDR < 0.01 and s0 = 0.1). The plot shows − log10 transformed p values versus log2-transformed fold changes in mean protein intensities between AD and control pooled extracts. Selected functionally relevant proteins are highlighted in the plot, showing less abundant (left panel, blue) or more abundant (right panel, red) proteins in AD extracts compared to non-AD control extracts
Fig. 2
Fig. 2
Timeline of the experimental protocol. Rats were i.c.v. injected with AD or non-AD human brain tissue extracts and, after a recovery period, subjected to a battery of behavioral tests and scanned with MRI before sample collection
Fig. 3
Fig. 3
Anxiety-related behaviors assessed using the EPM test. Rats were i.c.v. injected with AD or non-AD control extracts (n = 12 per group) and tested in the EPM for 10 min on Day 17 postinjection. A Time spent in the closed and open arms and in the central square expressed as percentage of total time. B Latency to the first entry into an open arm. C Total distance traveled and total number of arm entries were similar between the AD and control groups. D Percentage of time spent in the closed and open arms and the central square analyzed for each 2.5 min time interval. Data are presented as the means ± SEM. *p < 0.05
Fig. 4
Fig. 4
AD rats have a deficit in the retention of social memory but have no short- or long-term spatial memory deficits. Rats were i.c.v. injected with AD or non-AD control extracts (n = 12 per group) and tested for A social memory on Day 21 after the infusion. Data were analyzed using Student’s t-test to compare social recognition ratios (RRs) between groups and one sample t-test to compare each group to a chance value of 0.5. Data are presented as the means ± SEM. **p < 0.01 compared with control rats,  ++p < 0.01 compared to the hypothetical chance value of 0.5 (dashed line). B Control and AD rats started acquisition training in the MWM on Day 29 after the i.c.v. infusion, and C reference memory was tested 24 h and 7 days after the last training session. During the 3 days of acquisition training, the time spent in the target quadrant decreased, indicating spatial learning and memory formation in both groups. (C, left panel) Rats from both groups spent significantly less time in the target quadrant and (C, right panel) made fewer entries into the platform zone during the second probe trial (Day 7) compared to the first probe trial (24 h). Data were analyzed using two-way-ANOVA, *p < 0.05. D The Y-maze test, which was performed on Day 39 postinjection, revealed no difference in either the number of entries (D, left panel) or the percentage of alternations (D, center panel) between the AD and control groups. (D, right panel) The AD rats spent a significantly lower percentage of time spent in the central zone of the Y-maze than control rats. Data were analyzed using Student’s t-test, *p < 0.05. AD n = 12 rats per group
Fig. 5
Fig. 5
Measurements of the volume of different brain regions using MRI. Rats were scanned using MRI (n = 6 per group) to measure the volumes of different brain regions as the number of voxels in the ROI. A Representative horizontal, sagittal, and coronal T2-weighted RARE images are shown. 3D-reconstructed images were registered and segmented with a template image from the SIGMA rat brain atlas. The scale bar in each panel represents 5 mm. Representative ROIs used in volume measurements, such as hippocampi and LEC (blue—right; green—left), are highlighted on the three orthogonal slices and the 3D projection. Volume was measured in B the whole brain, C regions of the hippocampus and D regions of the EC. Data from the EC and the hippocampus were normalized to total brain volume. Data are presented as the means ± SEM. *p < 0.05. DG: dentate gyrus. CA cornu ammonis, MEC medial entorhinal cortex, LEC lateral entorhinal cortex, EC entorhinal cortex
Fig. 6
Fig. 6
Molecular alterations in the rat brain following the AβO infusion. A Quantification of the levels of amyloid peptides (left panel) and pTau (right panel) in rat hippocampal tissues from AD and control animals (n = 6 per group) using ELISAs. B IHC with the 6E10 antibody showed no plaques in the brains of AD rats. The same antibody strongly stained Aβ plaques in the brains of 28-month-old TgF344-AD rat, which were used as a positive control. Representative images of CA1 and DG regions of WT rats injected with AD human brain tissue extract (top panels) and Tg rats (bottom panels) are shown. Scale bar, 300 µm. C The relative mRNA expression of early AD markers in AD and control animals (n = 6 per group) measured using qPCR. Data were normalized to two reference genes: ACTB and RPL13A. Data are presented as the means ± SEM. *p < 0.05, **p < 0.01
Fig. 7
Fig. 7
The i.c.v. injection of AβOs induces brain inflammation. A Representative images of IBA-positive microglial cells at low and high resolutions (scale bar 300 and 50 µm, respectively) in the hippocampal CA1, CA3 and DG showing higher IR in the AD group. B Analysis of microglia altered morphology. Left panel: quantification of the IBA1-positive area in the DG and CA regions of the hippocampus and LEC. The number of branches (middle panel) and junctions (right panel) in microglial cell process per IBA1-positive cell was quantified in three regions (DG, CA and LEC). C Quantification of the GFAP-positive area in the CA and DG regions of the hippocampus. D Pearson’s correlation analysis indicates a strong positive correlation between the RR index and the level of IBA1-IR in the CA (E, left panel) and DG (E, right panel). E The relative mRNA expression of multiple inflammatory markers measured using qPCR. Data were normalized to two reference genes: ACTB and RPL13A. Data are presented as the means ± SEM. BC and D n = 6 rats per group. *p < 0.05, ***p < 0.001. AD Alzheimer’s disease, DG dentate gyrus, CA cornu ammonis, IBA1 ionized calcium binding adaptor molecule 1, P2RY12 purinergic receptor P2Y12, TMEM119 transmembrane protein 119, IL6 interleukin 6, HIF1α hypoxia-inducible factor 1 α
Fig. 8
Fig. 8
The i.c.v. injection of AβOs alters synaptic plasticity in the hippocampus. A Representative images of immunofluorescence staining for synaptophysin within the CA1 and DG of AD and control rats. Scale bar, 200 µm. B Quantification of synaptophysin- and VGLUT1-positive IR areas in the DG and CA1 regions of the hippocampus, which are reported as integrated densities. Data are from two–three sections per rat, 6 rats per group. C The relative mRNA expression of synaptic markers measured using qPCR. Data were normalized to two reference genes: ACTB and RPL13A. BC Data are presented as the means ± SEM. *p < 0.05. n = 6 rats per group

Similar articles

Cited by

References

    1. Drummond E, Wisniewski T. Alzheimer's disease: experimental models and reality. Acta Neuropathol. 2017;133(2):155–175. doi: 10.1007/s00401-016-1662-x. - DOI - PMC - PubMed
    1. Selkoe DJ, Hardy J. The amyloid hypothesis of Alzheimer's disease at 25 years. EMBO Mol Med. 2016;8(6):595–608. doi: 10.15252/emmm.201606210. - DOI - PMC - PubMed
    1. Coronel R, Bernabeu-Zornoza A, Palmer C, Muniz-Moreno M, Zambrano A, Cano E, Liste I. Role of amyloid precursor protein (APP) and its derivatives in the biology and cell fate specification of neural stem cells. Mol Neurobiol. 2018;55(9):7107–7117. doi: 10.1007/s12035-018-0914-2. - DOI - PubMed
    1. Leyssen M, Ayaz D, Hebert SS, Reeve S, De Strooper B, Hassan BA. Amyloid precursor protein promotes post-developmental neurite arborization in the Drosophila brain. EMBO J. 2005;24(16):2944–2955. doi: 10.1038/sj.emboj.7600757. - DOI - PMC - PubMed
    1. Priller C, Bauer T, Mitteregger G, Krebs B, Kretzschmar HA, Herms J. Synapse formation and function is modulated by the amyloid precursor protein. J Neurosci. 2006;26(27):7212–7221. doi: 10.1523/JNEUROSCI.1450-06.2006. - DOI - PMC - PubMed

Publication types

Substances