. 2022 Jul 15;55(Pt 4):1045-1054.
doi: 10.1107/S1600576722005854. eCollection 2022 Aug 1.

Gwaihir: Jupyter Notebook graphical user interface for Bragg coherent diffraction imaging

Affiliations

Gwaihir: Jupyter Notebook graphical user interface for Bragg coherent diffraction imaging

David Simonne et al. J Appl Crystallogr. .

Abstract

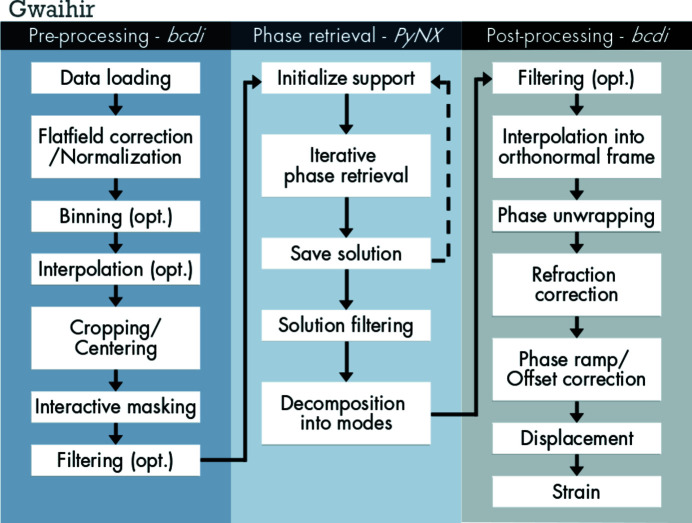
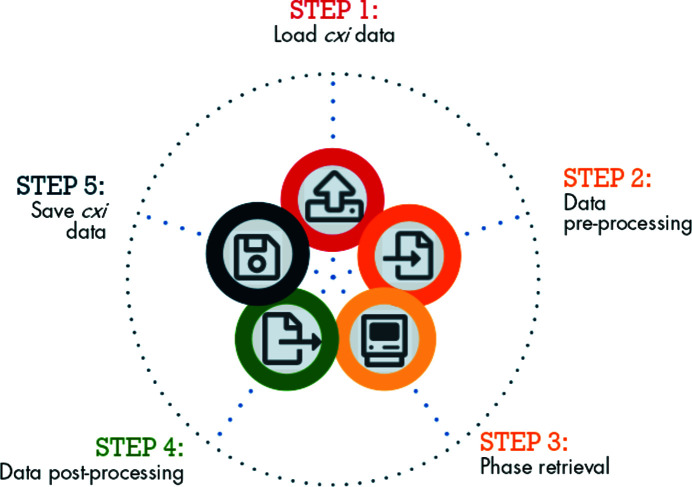
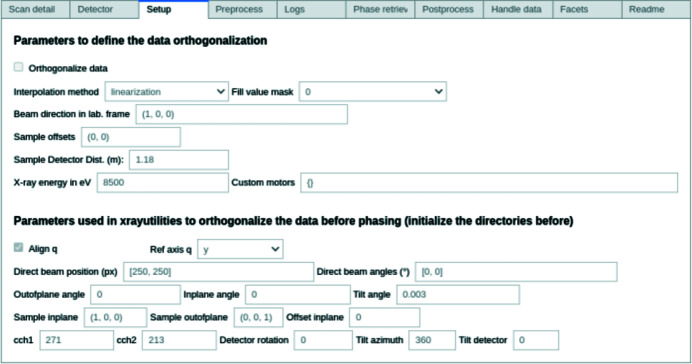
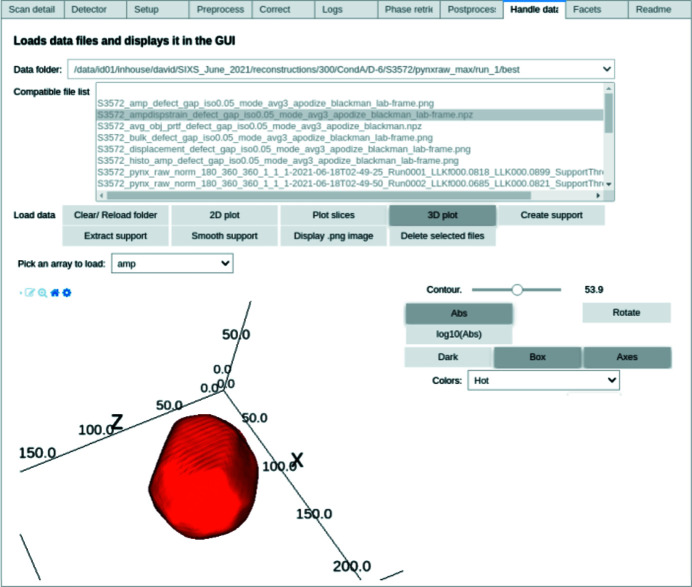
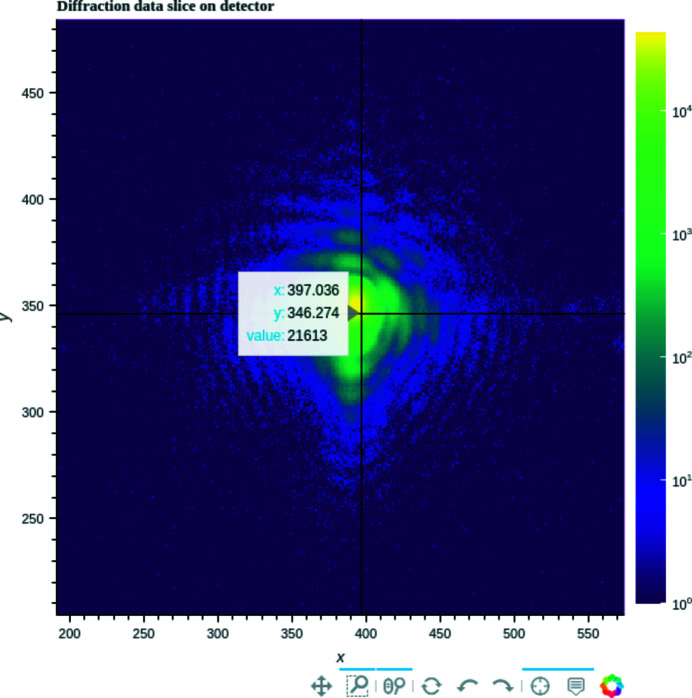
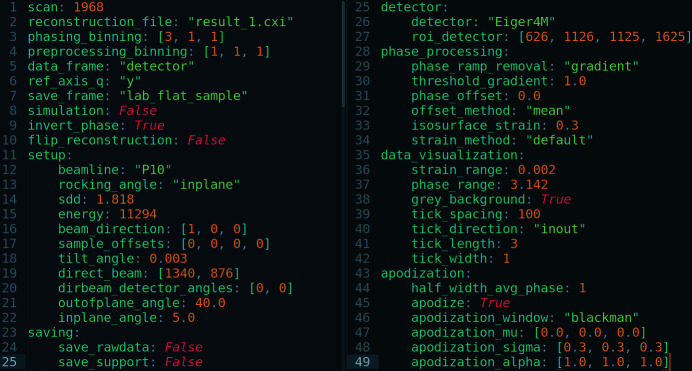
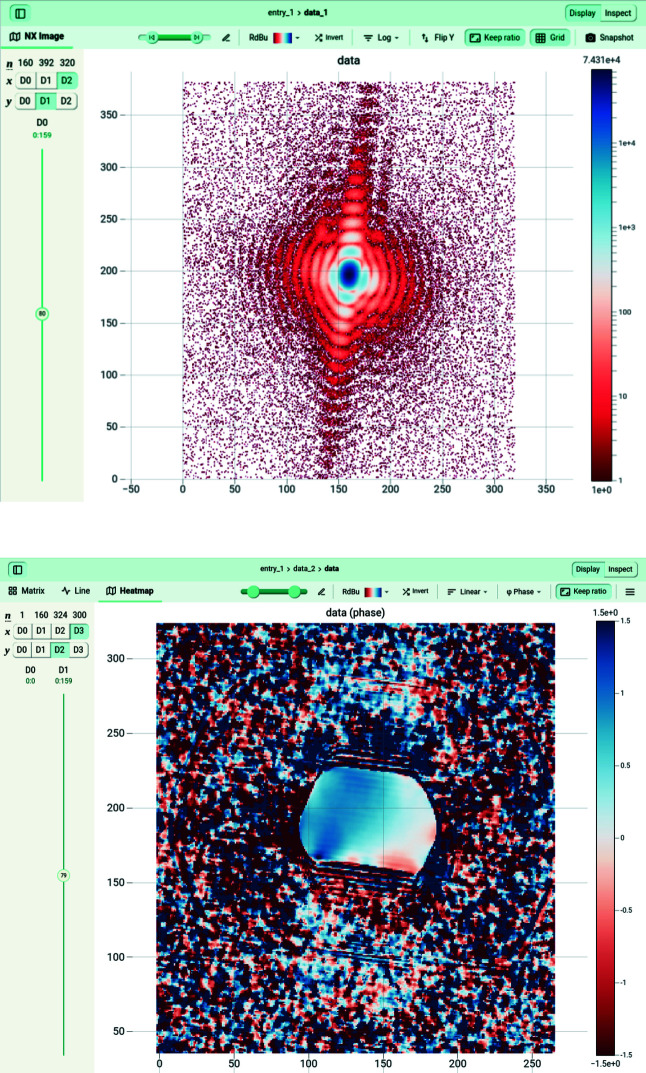
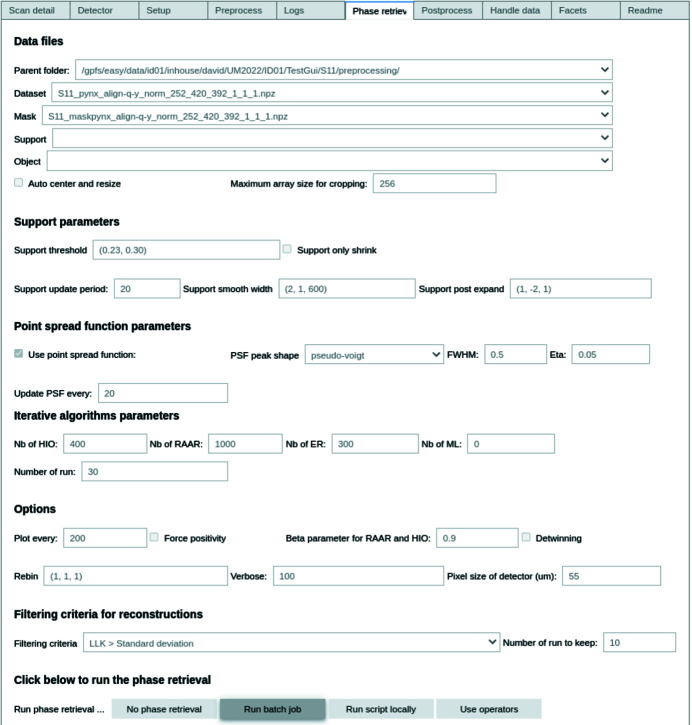
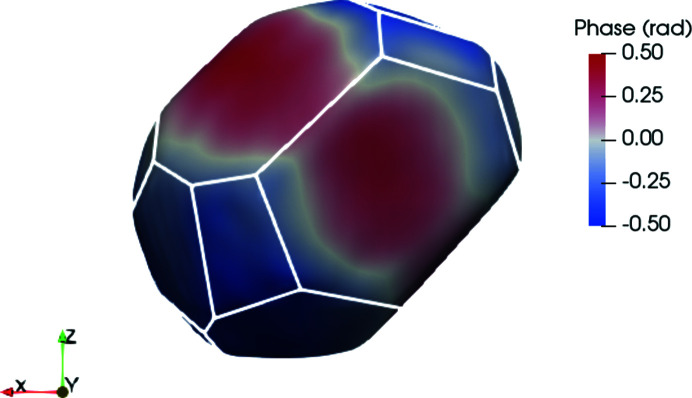
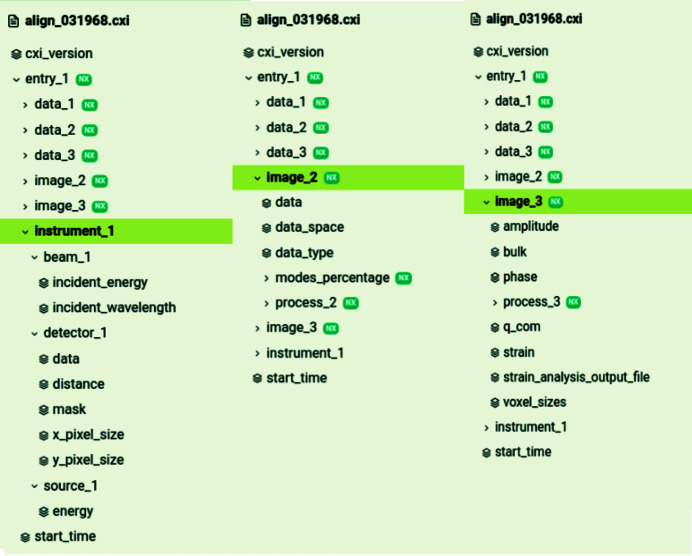
Bragg coherent X-ray diffraction is a nondestructive method for probing material structure in three dimensions at the nanoscale, with unprecedented resolution in displacement and strain fields. This work presents Gwaihir, a user-friendly and open-source tool to process and analyze Bragg coherent X-ray diffraction data. It integrates the functionalities of the existing packages bcdi and PyNX in the same toolbox, creating a natural workflow and promoting data reproducibility. Its graphical interface, based on Jupyter Notebook widgets, combines an interactive approach for data analysis with a powerful environment designed to link large-scale facilities and scientists.

Keywords: Jupyter Notebook; X-ray diffraction; coherence; graphical user interfaces; phase retrieval.


Figures

Figure 1
Figure 1
Flow chart of the main steps in the BCDI data analysis workflow. Gwaihir links the bcdi and PyNX packages via its GUI and command line scripts, resulting in a complete and easy to understand data analysis workflow (opt: optional).
Figure 2
Figure 2
Workflow steps taken in Gwaihir; the circular workflow illustrates data reproducibility, a key concept, facilitated by the CXI architecture. The user may start the analysis directly from phase retrieval or post-processing, after reloading the CXI file.
Figure 3
Figure 3
Screenshot of Gwaihir GUI displayed in Jupyter Notebook. Jupyter Notebook can be used on computing clusters via JupyterHub or on any machine for local use.
Figure 4
Figure 4
Widgets can be used to select folders and files and to tune the values of input parameters in functions. The selection of the data array, the color map and the contour of the resulting 3D object are performed through different widgets.
Figure 5
Figure 5
Detector images can be viewed interactively with Bokeh, to zoom in on the data, and visualize, for example, the intensity collected on each pixel.
Figure 6
Figure 6
Configuration file in YAML, a human-readable data-serialization language with a minimalist syntax. Each parameter used for the analysis methods is stored. A configuration file is generated for the pre-processing and post-processing scripts, as well as for the phase retrieval.
Figure 7
Figure 7
Here a 2D slice of a 3D coherent diffraction pattern is shown (top), with the phase of the electron density (radiants) of the reconstructed object in which the facets are clearly visible (bottom). The data array is displayed via JupyterHub, a browser-based data analysis platform available on the SLURM computer cluster for the ESRF and the GRADES computing cluster at SOLEIL.
Figure 8
Figure 8
Phase retrieval tab in Gwaihir. Parameters are separated into groups (files, support, point-spread function, algorithms etc.) and detailed in the README tab. The object can be reconstructed through a batch job, submitted to the computing cluster in the back-end, or with operators that will plot the evolution of the reconstruction object in the Notebook.
Figure 9
Figure 9
In this screenshot taken from Paraview, the particle facets are identified by the white contours. The coloring represents the phase of the reconstructed object, proportional to the lattice displacement. This particle has a diameter of about 800 nm.
Figure 10
Figure 10
Each parameter used during the data analysis is stored in the same .cxi file, along with the results, in a nested architecture: ‘instrument_1’ regroups parameters associated with the instrumental setup; ‘data_1’ is the diffraction pattern collected; ‘image_2’ regroups the parameters associated with phase retrieval; ‘data_2’ is the reconstructed Bragg electronic density chosen for post-processing; ‘image_3’ regroups parameters linked to data processing, as well as the processed amplitude, phase and resulting strain; ‘data_3’ is a link to the processed phase of the object. The file structure is displayed via JupyterHub.

References

    1. Ahrens, J., Geveci, B. & Law, C. (2005). ParaView: An End-User Tool for Large Data Visualization, The Visualization Handbook, Vol. 717. Munich: Elsevier.
    1. Baker, M. (2016). Nature, 533, 452–454. - PubMed
    1. Bokeh Development Team (2018). Bokeh, https://bokeh.pydata.org/en/latest/.
    1. Boulle, A. & Kieffer, J. (2019). J. Appl. Cryst. 52, 882–897.
    1. Breddeld, M. (2021). ipyvolume, version 0.6.0, https://github.com/maartenbreddels/ipyvolume.