. 2022 Aug 4;4(4):fcac197.
doi: 10.1093/braincomms/fcac197. eCollection 2022.

Electrophysiological biomarkers of brain function in CDKL5 deficiency disorder

Affiliations

Electrophysiological biomarkers of brain function in CDKL5 deficiency disorder

Joni N Saby et al. Brain Commun. .

Abstract

CDKL5 deficiency disorder is a debilitating developmental and epileptic encephalopathy for which no targeted treatment exists. A number of promising therapeutics are under development for CDKL5 deficiency disorder but a lack of validated biomarkers of brain function and clinical severity may limit the ability to objectively assess the efficacy of new treatments as they become available. To address this need, the current study quantified electrophysiological measures in individuals with CDKL5 deficiency disorder and the association between these parameters and clinical severity. Visual and auditory evoked potentials, as well as resting EEG, were acquired across 5 clinical sites from 26 individuals with CDKL5 deficiency disorder. Evoked potential and quantitative EEG features were calculated and compared with typically developing individuals in an age- and sex-matched cohort. Baseline and Year 1 data, when available, were analysed and the repeatability of the results was tested. Two clinician-completed severity scales were used for evaluating the clinical relevance of the electrophysiological parameters. Group-level comparisons revealed reduced visual evoked potential amplitude in CDKL5 deficiency disorder individuals versus typically developing individuals. There were no group differences in the latency of the visual evoked potentials or in the latency or amplitude of the auditory evoked potentials. Within the CDKL5 deficiency disorder group, auditory evoked potential amplitude correlated with disease severity at baseline as well as Year 1. Multiple quantitative EEG features differed between CDKL5 deficiency disorder and typically developing participants, including amplitude standard deviation, 1/f slope and global delta, theta, alpha and beta power. Several quantitative EEG features correlated with clinical severity, including amplitude skewness, theta/delta ratio and alpha/delta ratio. The theta/delta ratio was the overall strongest predictor of severity and also among the most repeatable qEEG measures from baseline to Year 1. Together, the present findings point to the utility of evoked potentials and quantitative EEG parameters as objective measures of brain function and disease severity in future clinical trials for CDKL5 deficiency disorder. The results also underscore the utility of the current methods, which could be similarly applied to the identification and validation of electrophysiological biomarkers of brain function for other developmental encephalopathies.

Keywords: CDKL5 deficiency disorder; biomarkers; developmental encephalopathies; evoked potentials; quantitative EEG.


Figures

Graphical abstract
Graphical abstract
Figure 1
Figure 1
Exclusions and demographics. Exclusions and demographics for CDD participants included in the baseline and Year 1 VEP, AEP and qEEG analyses. Age and severity data are presented as median (inter-quartile range). CSS, Clinical Severity Score; MBA, Motor-Behavioral Assessment.
Figure 2
Figure 2
Group comparison of VEP and AEP. Grand average VEP waveforms for the TD (shown in grey) and CDD (shown in white) groups at electrode Oz (A). Box plots showing the median value and inter-quartile range for the amplitude and latency of the VEP components in TD (shown in grey) and CDD (shown in white) participants (B and C). VEP N1 (U = 216.0, P = 0.038), N1–P1 (U = 63.0, P = 0.002) and P1–N2 (U = 90.0, P = 0.038) amplitudes were reduced in participants with CDD compared with TD participants. Box plots showing the median value and inter-quartile range for the AEP components in TD (shown in grey) and CDD (shown in white) participants (D and E). There were no differences in the amplitude or latency of the AEP components between the two groups. The grand average AEP is not pictured due to age-related changes in peak latency, which obscured comparisons of peak amplitudes. For AEPs from individual participants, see Fig. 6. Statistical analyses were performed using the Mann–Whitney U-tests. **P < 0.01, *P < 0.05.
Figure 3
Figure 3
Associations between AEP amplitude and clinical severity. Associations between clinical severity and AEP P1–N1 and N1–P2 amplitudes at baseline (n = 15; A) and Year 1 (n = 8; B). Statistical analyses were performed using linear regression. Dotted lines represent 95% confidence intervals.
Figure 4
Figure 4
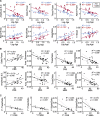
Group comparison of qEEG parameters. Box plots showing the median value and inter-quartile range for qEEG parameters for TD (shown in grey) and CDD (shown in white) participants. CDD participants had higher amplitude standard deviation (U = 376.0, P < 0.001) (A), and higher delta, theta, alpha and beta power (U = 364.0, 372.0, 328.0, 328.0, respectively, all P ≤ 0.001) compared with the TD group (B). CDD participants also had more negative 1/f slopes (U = 111.0, P = 0.012) (C), and lower alpha/delta, beta/delta, alpha/theta and beta/theta power ratios compared with TD participants (U = 64.0, 96.0, 33.0, 93.0, respectively, all P < 0.005) (D). Statistical analyses were performed using the Mann–Whitney U-tests. (***P < 0.001, **P < 0.01, *P < 0.05).
Figure 5
Figure 5
Associations of qEEG with age and clinical severity. Associations between qEEG features and age (A), qEEG features and clinical severity at baseline (B) and qEEG features and clinical severity at Year 1 (C). Power is expressed as log μV2. Statistical analyses were performed using linear regression. Dotted lines represent 95% confidence intervals. (***P < 0.001, **P < 0.01, *P < 0.05.)
Figure 6
Figure 6
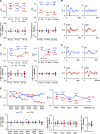
Change and stability of EP and qEEG features from baseline to Year 1. ICCs and change plots illustrating change in VEP (A), AEP (C) and qEEG (E) parameters from baseline to Year 1. Change plots represent the difference in Baseline–Year 1 for each TD (blue-left or top graphs) and CDD (red-right or bottom graphs) participant contributing follow-up data. Example VEP (B) and AEP (D) waveforms for individual TD and CDD participants demonstrating consistency in the EPs, particularly for TD participants.

References

    1. Olson HE, Demarest ST, Pestana-Knight EM, et al. . Cyclin-dependent kinase-like 5 deficiency disorder: Clinical review. Pediatr Neurol. 2019;97:18–25. - PMC - PubMed
    1. Demarest ST, Olson HE, Moss A, et al. . CDKL5 deficiency disorder: Relationship between genotype, epilepsy, cortical visual impairment, and development. Epilepsia. 2019;60(8):1733–1742. - PMC - PubMed
    1. Symonds JD, Zuberi SM, Stewart K, et al. . Incidence and phenotypes of childhood-onset genetic epilepsies: A prospective population-based national cohort. Brain. 2019;142(8):2303–2318. - PMC - PubMed
    1. Muller A, Helbig I, Jansen C, et al. . Retrospective evaluation of low long-term efficacy of antiepileptic drugs and ketogenic diet in 39 patients with CDKL5-related epilepsy. Eur J Paediatr Neurol. 2016;20(1):147–151. - PubMed
    1. Benke TA, Kind PC. Proof-of-concept for a gene replacement approach to CDKL5 deficiency disorder. Brain. 2020;143(3):716–718. - PMC - PubMed

LinkOut - more resources