

Inflammatory and immune markers in HIV-infected older adults on long-term antiretroviral therapy: Persistent elevation of sCD14 and of proinflammatory effector memory T cells
- PMID: 35975357
- PMCID: PMC9470897
- DOI: 10.1111/acel.13681
Inflammatory and immune markers in HIV-infected older adults on long-term antiretroviral therapy: Persistent elevation of sCD14 and of proinflammatory effector memory T cells
Abstract
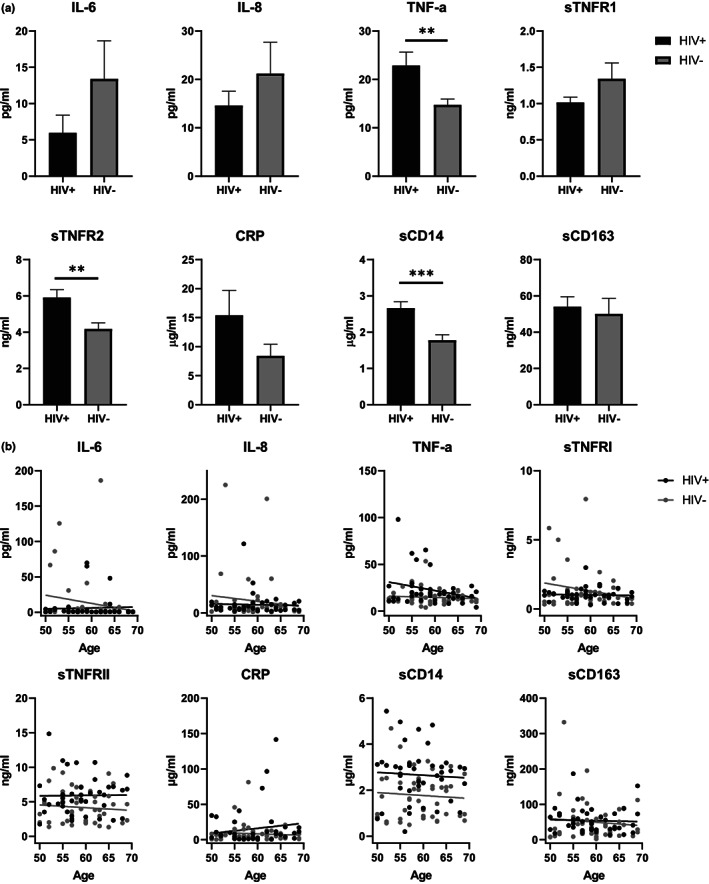
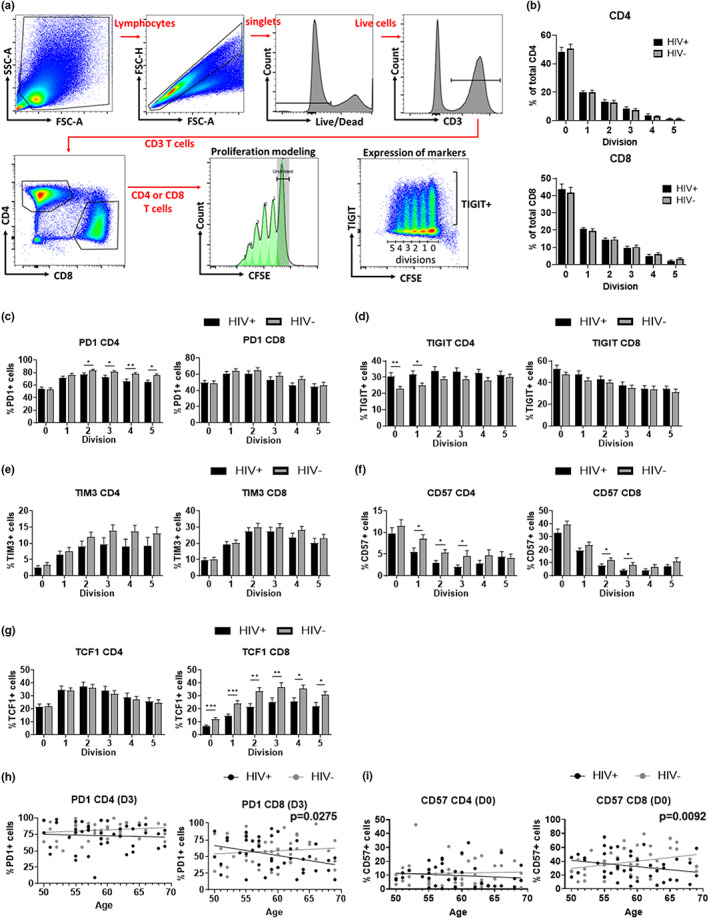
HIV-positive patients whose viral loads are successfully controlled by active antiretroviral therapy (ART) show no clinical signs of AIDS. However, their lifespan is shorter compared with individuals with no HIV infection and they prematurely exhibit a multitude of chronic diseases typically associated with advanced age. It was hypothesized that immune system aging may correlate with, and provide useful biomarkers for, this premature loss of healthspan in HIV-positive subjects. Here, we tested whether the immune correlates of aging, including cell numbers and phenotypes, inflammatory status, and control of human cytomegalovirus (hCMV) in HIV-positive subjects on long-term successful ART (HIV+) may reveal increased "immunological age" compared with HIV-negative, age-matched cohort (HIV-) in participants between 50 and 69 years of age. Specifically, we expected that younger HIV+ subjects may immunologically resemble older individuals without HIV. We found no evidence to support this hypothesis. While T cells from HIV+ participants displayed differential expression in several differentiation and/or inhibitory/exhaustion markers in different T cell subpopulations, aging by a decade did not pronounce these changes. Similarly, while the HIV+ participants exhibited higher T cell responses and elevated inflammatory marker levels in plasma, indicative of chronic inflammation, this trait was not age-sensitive. We did find differences in immune control of hCMV, and, more importantly, a sustained elevation of sCD14 and of proinflammatory CD4 and CD8 T cell responses across age groups, pointing towards uncontrolled inflammation as a factor in reduced healthspan in successfully treated older HIV+ patients.
Keywords: HIV; antiretroviral therapy; immune aging; sCD14.
© 2022 The Authors. Aging Cell published by Anatomical Society and John Wiley & Sons Ltd.
Conflict of interest statement
The authors declare that there is no conflict of interest.
Figures


Similar articles
-
Structured treatment interruptions (STI) in chronic unsuppressed HIV infection in adults.Cochrane Database Syst Rev. 2006 Jul 19;2006(3):CD006148. doi: 10.1002/14651858.CD006148. Cochrane Database Syst Rev. 2006. PMID: 16856117 Free PMC article.
-
Antiretrovirals for reducing the risk of mother-to-child transmission of HIV infection.Cochrane Database Syst Rev. 2011 Jul 6;(7):CD003510. doi: 10.1002/14651858.CD003510.pub3. Cochrane Database Syst Rev. 2011. PMID: 21735394
-
Systemic pharmacological treatments for chronic plaque psoriasis: a network meta-analysis.Cochrane Database Syst Rev. 2021 Apr 19;4(4):CD011535. doi: 10.1002/14651858.CD011535.pub4. Cochrane Database Syst Rev. 2021. Update in: Cochrane Database Syst Rev. 2022 May 23;5:CD011535. doi: 10.1002/14651858.CD011535.pub5. PMID: 33871055 Free PMC article. Updated.
-
Antiretrovirals for reducing the risk of mother-to-child transmission of HIV infection.Cochrane Database Syst Rev. 2007 Jan 24;(1):CD003510. doi: 10.1002/14651858.CD003510.pub2. Cochrane Database Syst Rev. 2007. Update in: Cochrane Database Syst Rev. 2011 Jul 06;(7):CD003510. doi: 10.1002/14651858.CD003510.pub3. PMID: 17253490 Updated.
-
Antiretroviral post-exposure prophylaxis (PEP) for occupational HIV exposure.Cochrane Database Syst Rev. 2007 Jan 24;2007(1):CD002835. doi: 10.1002/14651858.CD002835.pub3. Cochrane Database Syst Rev. 2007. PMID: 17253483 Free PMC article.
Cited by
-
Assessing intrinsic capacity for person-centred HIV care: a cross-sectional study in ageing populations in Malaysia and Hong Kong.J Int AIDS Soc. 2025 Jan;28(1):e26404. doi: 10.1002/jia2.26404. J Int AIDS Soc. 2025. PMID: 39724272 Free PMC article.
-
Immunoaging at Early Ages Could Drive a Higher Comorbidity Burden in People with HIV on Antiretroviral Therapy Compared with the Uninfected Population.Int J Mol Sci. 2024 Oct 11;25(20):10930. doi: 10.3390/ijms252010930. Int J Mol Sci. 2024. PMID: 39456715 Free PMC article.
-
Immune activation and inflammation in lactating women on combination antiretroviral therapy: role of gut dysfunction and gut microbiota imbalance.Front Immunol. 2023 Nov 16;14:1280262. doi: 10.3389/fimmu.2023.1280262. eCollection 2023. Front Immunol. 2023. PMID: 38045684 Free PMC article.
-
A Perfect Storm: The Convergence of Aging, Human Immunodeficiency Virus Infection, and Inflammasome Dysregulation.Curr Issues Mol Biol. 2024 May 15;46(5):4768-4786. doi: 10.3390/cimb46050287. Curr Issues Mol Biol. 2024. PMID: 38785555 Free PMC article. Review.
References
-
- Althoff, K. N. , McGinnis, K. A. , Wyatt, C. M. , Freiberg, M. S. , Gilbert, C. , Oursler, K. K. , Rimland, D. , Rodriguez‐Barradas, M. C. , Dubrow, R. , Park, L. S. , Skanderson, M. , Shiels, M. S. , Gange, S. J. , Gebo, K. A. , Justice, A. C. , & Study Veterans Aging Cohort . (2015). Comparison of risk and age at diagnosis of myocardial infarction, end‐stage renal disease, and non‐AIDS‐defining cancer in HIV‐infected versus uninfected adults. Clinical Infectious Diseases, 60, 627–638. - PMC - PubMed
-
- Appay, V. , Almeida, J. R. , Sauce, D. , Autran, B. , & Papagno, L. (2007). Accelerated immune senescence and HIV‐1 infection. Experimental Gerontology, 42, 432–437. - PubMed
-
- Brenchley, J. M. , Price, D. A. , & Douek, D. C. (2006). HIV disease: Fallout from a mucosal catastrophe? Nature Immunology, 7, 235–239. - PubMed
Publication types
MeSH terms
Substances
Grants and funding
LinkOut - more resources
Full Text Sources
Medical
Research Materials
