. 2022 Aug 31;289(1981):20221180.
doi: 10.1098/rspb.2022.1180. Epub 2022 Aug 17.

Blue whales increase feeding rates at fine-scale ocean features

Affiliations

Blue whales increase feeding rates at fine-scale ocean features

James A Fahlbusch et al. Proc Biol Sci. .

Abstract

Marine predators face the challenge of reliably finding prey that is patchily distributed in space and time. Predators make movement decisions at multiple spatial and temporal scales, yet we have a limited understanding of how habitat selection at multiple scales translates into foraging performance. In the ocean, there is mounting evidence that submesoscale (i.e. less than 100 km) processes drive the formation of dense prey patches that should hypothetically provide feeding hot spots and increase predator foraging success. Here, we integrated environmental remote-sensing with high-resolution animal-borne biologging data to evaluate submesoscale surface current features in relation to the habitat selection and foraging performance of blue whales in the California Current System. Our study revealed a consistent functional relationship in which blue whales disproportionately foraged within dynamic aggregative submesoscale features at both the regional and feeding site scales across seasons, regions and years. Moreover, we found that blue whale feeding rates increased in areas with stronger aggregative features, suggesting that these features indicate areas of higher prey density. The use of fine-scale, dynamic features by foraging blue whales underscores the need to take these features into account when designating critical habitat and may help inform strategies to mitigate the impacts of human activities for the species.

Keywords: Lagrangian coherent structures; baleen whale; biologging; finite-time Lyapunov exponent; habitat resource selection; movement ecology.


Conflict of interest statement

We declare we have no competing interests.

Figures

Figure 1.
Figure 1.
(a) A blue whale tagged in 2017 with a high-resolution, intermediate-duration multi-sensor tag (Wildlife Computers TRD10-F modified with a dart attachment). (b) Dive profile for a portion of the deployment from the blue whale in (a) (Bm170622-TDR12), with lunges shown by red circles and feeding states highlighted. (c,d) A non-feeding and feeding dive, respectively, with high-resolution data shown. Lunges (red) were identified by the stereotypical kinematic signature (e.g. changes in pitch and roll as well as a precipitous drop in speed at the time of mouth-opening); (d) highlights the dive duration (blue) and post-dive surface duration (magenta) used in the calculation of feeding rates.
Figure 2.
Figure 2.
(a) Deployment tracks and hourly feeding summaries for 10 blue whales along the California coast, showing the HF radar coverage footprint and receiver locations (200 m isobaths shown in grey). (b) Locations of simulated particle tracers for 28 September 2017 14.00 (local time) after a 48 h integration (particle tracers initially seeded in an evenly spaced grid). (c) FTLE was calculated from the particle trajectories in (b), with the track from a 4-day blue whale deployment shown in green (grey 100 and 200 m isobaths). Black diamond represents the mean hourly location and number of lunges for the specific hour of FTLE data shown. (Black dashed area in (a) represents the spatial extent of (b,c).)
Figure 3.
Figure 3.
FTLE values were significantly greater at blue whale locations (black; D = 0.0617, p < 0.000001) than the background distribution (grey). Lines represent density distributions of FTLE for all animal locations (n = 7791, black), feeding locations only (n = 3875, red) and background samples (n = 77 910, grey); all distributions weighted by individual to account for varying deployment lengths.
Figure 4.
Figure 4.
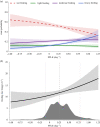
(a) The probability of feeding increased with FTLE (black with CI shaded, n = 10 individuals, 7791 dives, slope 0.45, p = 0.0025). The slope of the relationship was significantly greater than the CRW null model (blue with CI shaded, n = 100 simulated tracks, slope −0.066, p = 0.156). (b) The slope of the feeding rate–FTLE relationship decreased when tracks were time-shifted, with a greater decrease for larger time shifts. Dashed lines in (b) represent p-values greater than 0.05 (i.e. the predicted slope was not significantly different from 0).
Figure 5.
Figure 5.
(a) The stationary state probabilities for the four-state feeding rate HMM; (b) the estimated overall feeding rates using the modelled stationary state probabilities in (a) and the mean feeding rates for each state for an average blue whale in our study; a histogram rug plot (dark grey) shows the distribution of encountered FTLE by all individuals in our study (weighted by individual) with vertical lines at the 5th, 50th and 95th percentiles.

Similar articles

Cited by

References

    1. Levin SA. 1992. The problem of pattern and scale in ecology. Ecology 73, 1943-1967. (10.2307/1941447) - DOI
    1. Sawyer SC, Brashares JS. 2013. Applying resource selection functions at multiple scales to prioritize habitat use by the endangered Cross River gorilla. Divers. Distrib. 19, 943-954. (10.1111/ddi.12046) - DOI
    1. Abrahms B, Scales KL, Hazen EL, Bograd SJ, Schick RS, Robinson PW, Costa DP. 2018. Mesoscale activity facilitates energy gain in a top predator. Proc. R. Soc. B 285, 20181101. (10.1098/rspb.2018.1101) - DOI - PMC - PubMed
    1. Johnson DH. 1980. The comparison of usage and availability measurements for evaluating resource preference. Ecology 61, 65-71. (10.2307/1937156) - DOI
    1. Levin SA. 1976. Population dynamic models in heterogeneous environments. Annu. Rev. Ecol. Syst. 7, 287-310. (10.1146/annurev.es.07.110176.001443) - DOI

Publication types