. 2022 Aug 31;289(1981):20220812.
doi: 10.1098/rspb.2022.0812. Epub 2022 Aug 17.

Matched function of the neuropil processing optic flow in flies and crabs: the lobula plate mediates optomotor responses in Neohelice granulata

Affiliations

Matched function of the neuropil processing optic flow in flies and crabs: the lobula plate mediates optomotor responses in Neohelice granulata

Yair Barnatan et al. Proc Biol Sci. .

Abstract

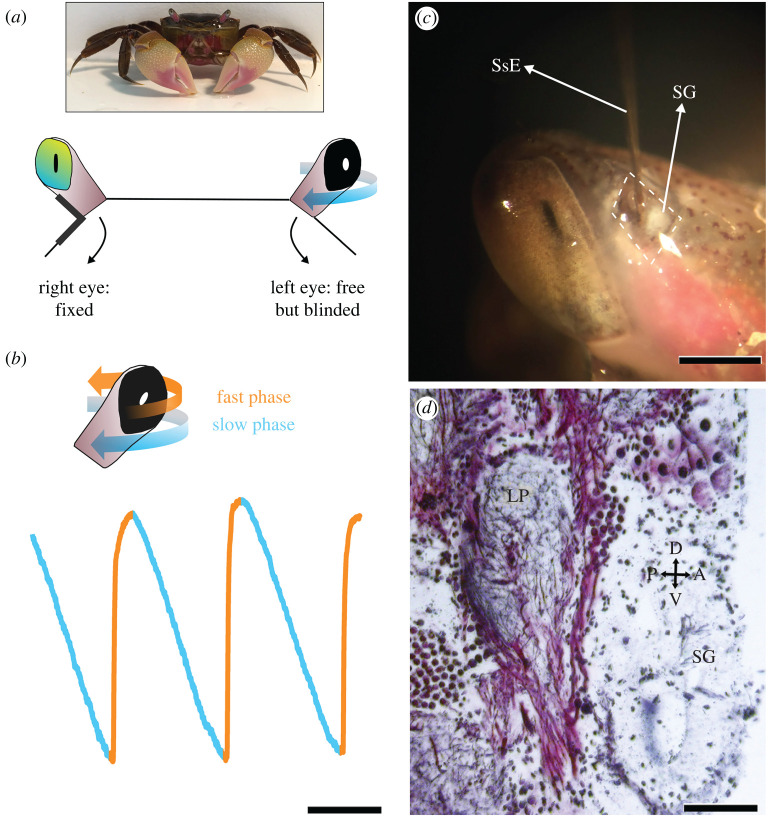
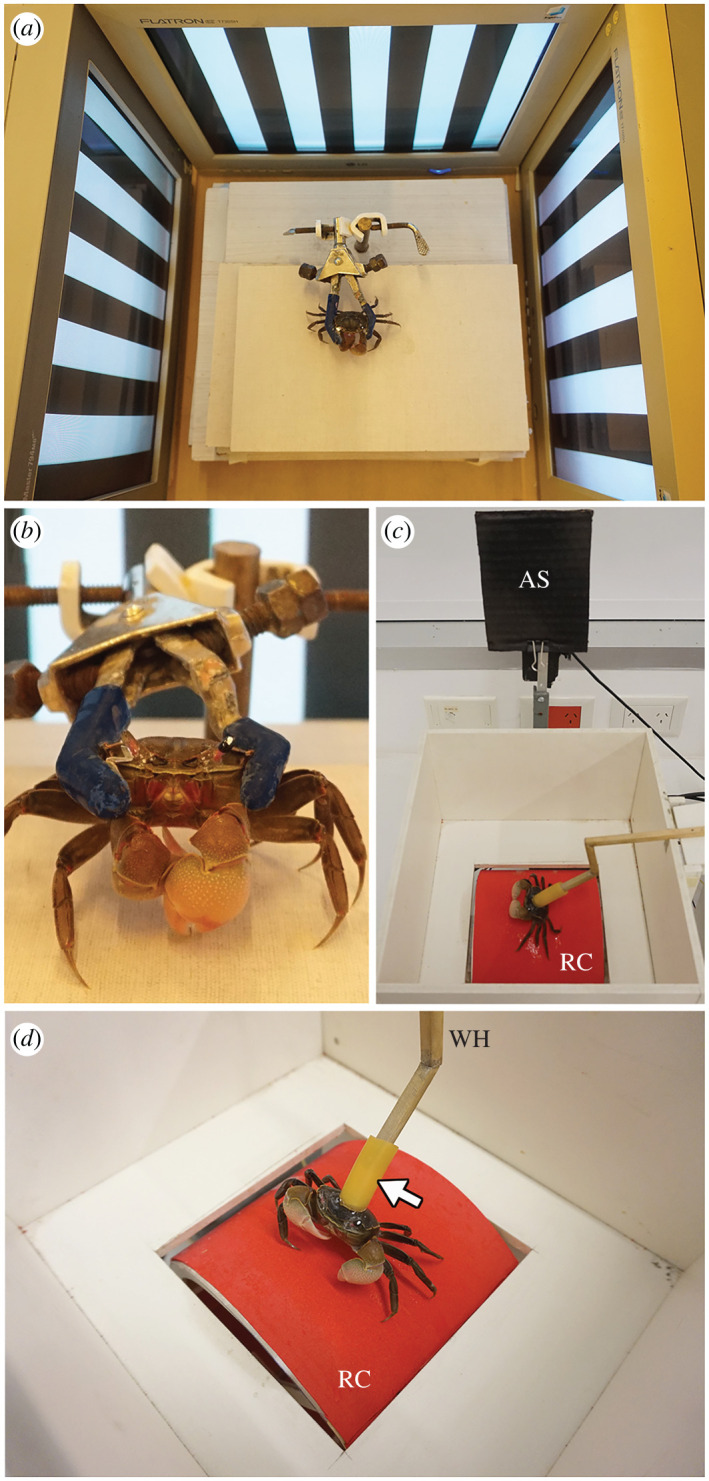
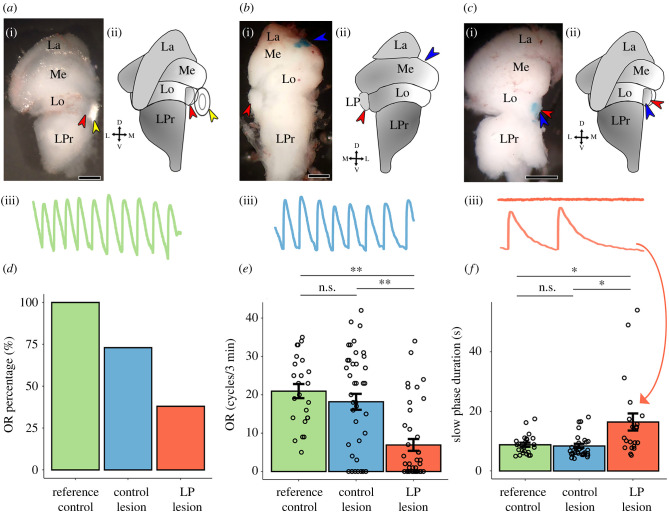
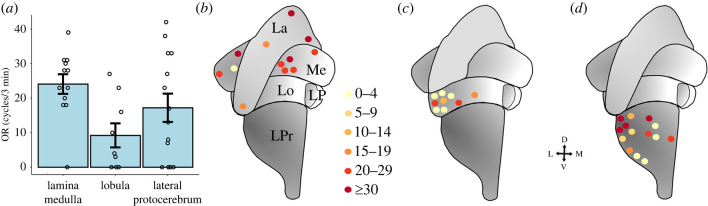
When an animal rotates (whether it is an arthropod, a fish, a bird or a human) a drift of the visual panorama occurs over its retina, termed optic flow. The image is stabilized by compensatory behaviours (driven by the movement of the eyes, head or the whole body depending on the animal) collectively termed optomotor responses. The dipteran lobula plate has been consistently linked with optic flow processing and the control of optomotor responses. Crabs have a neuropil similarly located and interconnected in the optic lobes, therefore referred to as a lobula plate too. Here we show that the crabs' lobula plate is required for normal optomotor responses since the response was lost or severely impaired in animals whose lobula plate had been lesioned. The effect was behaviour-specific, since avoidance responses to approaching visual stimuli were not affected. Crabs require simpler optic flow processing than flies (because they move slower and in two-dimensional instead of three-dimensional space), consequently their lobula plates are relatively smaller. Nonetheless, they perform the same essential role in the visual control of behaviour. Our findings add a fundamental piece to the current debate on the evolutionary relationship between the lobula plates of insects and crustaceans.

Keywords: compensatory responses; lobula complex; optic lobes; optokinetic nystagmus.


Conflict of interest statement

We declare we have no competing interests.

Figures

Figure 1.
Figure 1.
Eye tracking during OR behaviour and lesion procedures. (a) Experimental configuration. The right eye is immobilized at its normal seeing position, while the left one can move but it is blinded (frontal view; as in the inset showing a specimen of Neohelice granulata). Upon presenting a grating panoramic stimulus the right eye is stimulated and drives the movement of the left one. Eye movements are tracked with a video camera and analysed offline. (b) Illustration of OR eye tracking cycles, representing the periodic movement of the left eyestalk. Three complete cycles are shown. The cycle begins with a slow phase (cyan trace) in which the eye follows the grating stimulus until it can no longer move, moment in which a fast phase, a saccade, occurs resetting the eye to its initial position (orange trace). (c) After fixing the right eye, a piece of cuticle was removed from an anteromedial region leaving the ommatidial surface intact. Such incision allowed visualization of the sinus gland (SG), a neuroendocrine structure located next to the LP. Animals were then placed in a crab stereotactic device and a stainless-steel electrode (SsE) was introduced to perform the electrolytic lesion. (d) Bodian-stained section (12 μm thickness) of Neohelice granulata's optic lobe. This section shows a plane that contains both the LP and sinus gland (SG), illustrating their relative size and position. Scale bars in b = 5 s; c = 1 mm; d = 50 µm. (Online version in colour.)
Figure 2.
Figure 2.
Experimental set-ups for measuring optomotor responses (ORs) and avoidance responses (ARs). (a) Experimental set-up for recording OR as seen from above (the fourth monitor and the white opaque lid are not shown). Clockwise panoramic optic flow was presented coherently in the four-screen array fully surrounding the animal while eye movements were recorded by a camera (not seen in the picture). (b) Frontal view showing the fixed right eye and the blinded left eye that has a little white spot for tracking. The crab was held in position by a clamp. (c) AR experimental set-up (top-lateral view). An approaching stimulus (AS) was used to elicit avoidance (escape) behaviour in crabs recorded by the movement of the rolling cylinder (RC). (d) shows a close up frontal-top view. The crab was held by a small latex cylinder (white arrow) glued to the carapace that fitted into a wooden holder (WH), keeping the animal at the centre of the roller. The movement of the legs was registered by the free displacement of the RC along its larger axis. (Online version in colour.)
Figure 3.
Figure 3.
Effects of the lesions in OR performance. (a–c) Representative examples of optic lobe dissections and optokinetic nystagmus for the three experimental groups. The location of the electrolytic lesion was revealed with Perls' Prussian Blue histochemical staining that reveals a blue spot in the place the electrode delivered the current. For each treatment it is presented the stained optic lobe (i), a scheme (ii) to help identification of the neuropils and representative recordings of the eye movements (iii, all traces have the same duration, 20 s) generated in response to the panoramic grating stimulus (black and white vertical bars moving clockwise at 6° s–1, spatial frequency: 0.08 cycles per degree). (a) Reference control (green): intact optic lobe and normal optokinetic nystagmus. (b) Control lesion (blue): a crab lesioned in the medulla. It also presents a normal optokinetic nystagmus. (c) LP lesion (red). In this treatment optokinetic nystagmus was completely lost (upper trace) or considerably impaired (lower trace). The red arrowheads point to the position of the LP, the blue arrowheads indicate the site of lesion and the yellow arrowhead shows the position of the sinus gland. Scale bar ai, bi, ci: 500 µm. La: lamina, Me: medulla, Lo: lobula, LP: lobula plate, LPc: lateral protocerebrum, L: lateral, M: medial, D: dorsal, V: ventral. (d–f) Compared optomotor performances in the three experimental groups. (d) Percentage of animals displaying OR (animals that showed at least five compensatory cycles in 3 min). (e) Mean OR expressed as the number of fast phase events (saccades) performed by each group (generalized linear model with binomial negative distribution and log as link function, dispersion factor ϕ = 0.64. Likelihood ratio test: χ2 = 15.146, d.f. = 2, p-value = 5.1 × 10⁻⁴). Both control groups showed high and similar OR levels (p = 0.8932). LP lesion group presented an impaired performance in comparison to control lesion (p = 0.0014) and reference control (p = 0.0016) groups. (f) Average slow phase duration (generalized least squares with variance modeling. Likelihood ratio test: χ2 = 7.324, d.f. = 2, p-value = 0.02568. Residual standard error ratios control lesion: reference control: LP lesion is 1.00: 0.84: 3.36). Both control groups showed a similar slow phase duration (p = 0.9149). Conversely, LP lesioned animals displayed longer slow phases than the control lesion (p = 0.0330) and the reference control group (p = 0.0434). Sample size was nLP ablation = 40, ncontrol ablation = 41 and nreference control = 24. n.s.: not significant differences p > 0.05; *p > 0.05; **p < 0.01. (Online version in colour.)
Figure 4.
Figure 4.
Variability of OR values depending on the site of lesion in control lesioned animals. (a) OR values vary in different lesion sites. Lamina and medulla lesions produced high OR while lobula and lateral protocerebral lesions rendered some null responses. (b–d) Optic lobe diagrams showing the central location of the lesions (dots) in the categories separated in a. (b) Distal neuropils: lamina and medulla, (c) Lobula (the most antero-ventral section of the lamina was removed for clarity) (d) Lateral protocerebrum. Six data points from figure 3e (blue bar) were excluded from this analysis since the lesion was located on the medulla–lobula boundary. Dot colours indicate the level of response (the lighter the colour, the lesser the response, see coding scale shown in b). La: lamina, Me: medulla, Lo: lobula, LP: lobula plate, LPc: lateral protocerebrum. L: lateral, M: medial, D: dorsal, V: ventral. (Online version in colour.)
Figure 5.
Figure 5.
AR to an approaching stimulus. The lesioning of the LP produces a specific impairment of the ORs since visually-triggered ARs were unchanged. (a) Lesion control animals display a similar percentage of AR (blue) than LP lesion animals (red). (b) Both groups also display a similar maximum velocity (no significant differences were found; two-tailed Wilcoxon rank test, W = 48.5, p-value = 0.5247). (c) OR/AR ratio is higher in the control lesion group as expected if the change produce by LP lesion only affected OR (two-tailed Wilcoxon rank test, W = 64 p-value = 0.0364). Sample size was nLP lesion = 13, ncontrol lesion = 9. (Online version in colour.)

Similar articles

References

    1. Land MF. 1999. Motion and vision: why animals move their eyes. J. Comp. Physiol. 185, 341-352. (10.1007/s003590050393) - DOI - PubMed
    1. Hardcastle BJ, Krapp HG. 2016. Evolution of biological image stabilization. Curr. Biol. 26, R1010-R1021. (10.1016/j.cub.2016.08.059) - DOI - PubMed
    1. Cellini B, Salem W, Mongeau JM. 2021. Mechanisms of punctuated vision in fly flight. Curr. Biol. 31, 4009-4024. (10.1016/j.cub.2021.06.080) - DOI - PubMed
    1. Frasnelli E, Hempel de Ibarra N, Stewart FJ.. 2018. The dominant role of visual motion cues in bumblebee flight control revealed through virtual reality. Front. Physiol. 9, 01038. (10.3389/fphys.2018.01038) - DOI - PMC - PubMed
    1. Fry SN, Rohrseitz N, Straw AD, Dickinson MH. 2009. Visual control of flight speed in Drosophila melanogaster. J. Exp. Biol. 212, 1120-1130. (10.1242/jeb.020768) - DOI - PubMed

Publication types

LinkOut - more resources