. 2022 Oct;9(28):e2203597.
doi: 10.1002/advs.202203597. Epub 2022 Aug 17.

Wireless Non-Invasive Monitoring of Cholesterol Using a Smart Contact Lens

Affiliations

Wireless Non-Invasive Monitoring of Cholesterol Using a Smart Contact Lens

Hayoung Song et al. Adv Sci (Weinh). 2022 Oct.

Abstract

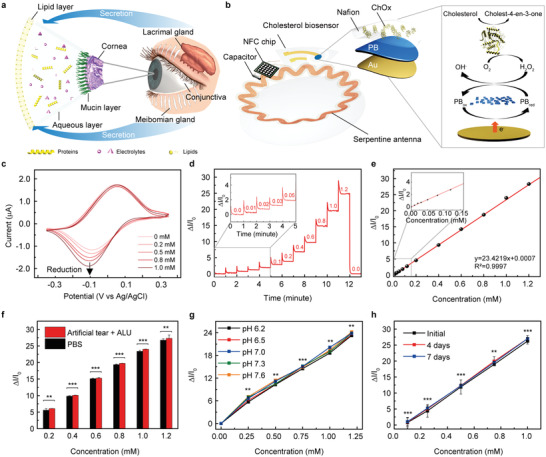
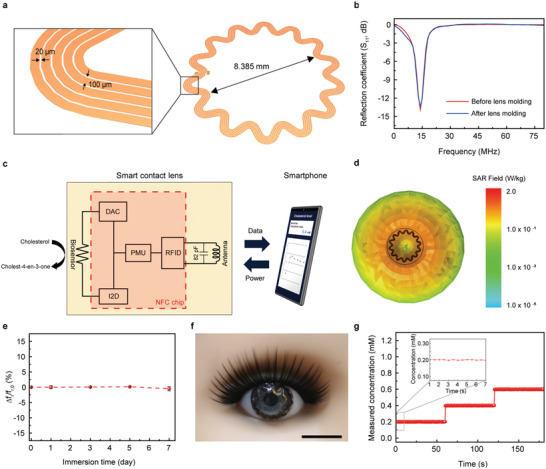
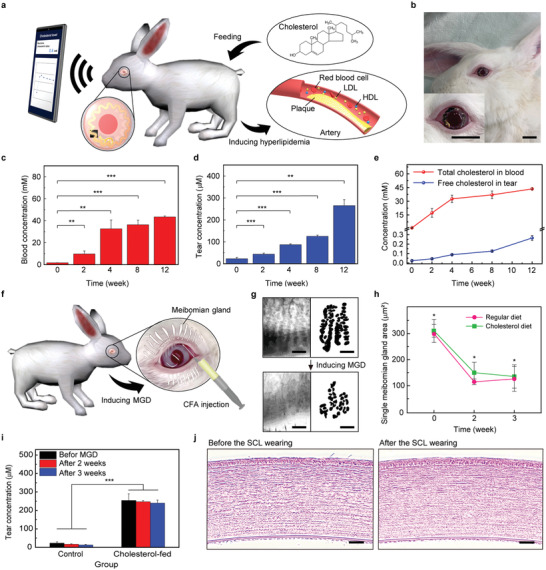
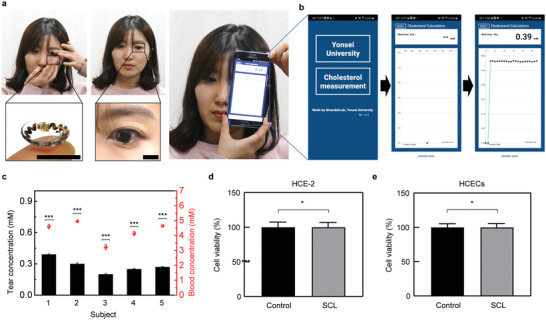
Herein, a wireless and soft smart contact lens that enables real-time quantitative recording of cholesterol in tear fluids for the monitoring of patients with hyperlipidemia using a smartphone is reported. This contact lens incorporates an electrochemical biosensor for the continuous detection of cholesterol concentrations, stretchable antenna, and integrated circuits for wireless communication, which makes a smartphone the only device required to operate this lens remotely without obstructing the wearer's vision. The hyperlipidemia rabbit model is utilized to confirm the correlation between cholesterol levels in tear fluid and blood and to confirm the feasibility of this smart contact lens for diagnostic application of cholesterol-related diseases. Further in vivo tests with human subjects demonstrated its good biocompatibility, wearability, and reliability as a non-invasive healthcare device.

Keywords: cholesterol; healthcare device; smart contact lens; stretchable antenna; wireless communication.


Conflict of interest statement

The authors declare no conflict of interest.

Figures

Figure 1
Figure 1
Electrochemical cholesterol biosensor in the smart contact lens. a) Schematic illustration of the tear film and secretion glands. b) Schematic illustration of the smart contact lens including a cholesterol biosensor with the enzymatic reactions. c) Cyclic voltammetry of the cholesterol biosensors for increasing concentrations of cholesterol from 0 to 1.0 mm with 0.1 mm additions in PBS solution; scan rate = 50 mV s–1. d) The real‐time chronoamperometric responses of the cholesterol biosensor in the range of 0 to 1.2 mm cholesterol levels in PBS solution. e) Calibration curve of the relative current change according to the cholesterol concentration (y = 23.4219x + 0.0007, R 2 = 0.9997). f) Relative changes in current with interference substances in PBS solution (red, artificial tear solution containing 10 µm ascorbic acids, 4 mm lactic acids, and 100 µm uric acid; black, PBS solution) (n = 10). The statistical differences between the two groups were analyzed using the unpaired student's t‐test. g) Calibration curves of the cholesterol biosensor according to the concentration of cholesterol with different pH ranges from 6.2 to 7.6 (n = 10). h) Relative changes in current immersed in PBS solution up to 7 days (n = 10). The error bars represent the standard deviations for (f–h). The data were analyzed using ordinary one‐way ANOVA and Bonferroni test for (g,h). Significant differences were marked as ** (p < 0.01) and *** (p < 0.001) for (f–h). Applied potential, ‐0.1 V. versus Ag/AgCl for (d–h).
Figure 2
Figure 2
Wireless communication system of the smart contact lenses. a) Schematic illustration of the serpentine antenna. b) Resonance frequencies of the antenna before lens molding (red) and after lens molding (blue). c) Circuit diagram of the smart contact lens. d) Specific absorption rate (SAR) simulation result at 13.56 MHz. e) Relative changes in the resonance frequency of the antenna immersed in PBS solution. The error bars represent the standard deviations (n = 10). f) Photograph of the smart contact lens worn on the eye of a mannequin. Scale bar, 1 cm. g) Real‐time responses of the cholesterol biosensor displayed on the smartphone. Free cholesterol solution (0.2, 0.4, and 0.6 mm) was dropped on the eye of the mannequin.
Figure 3
Figure 3
In vivo rabbit experiment. a) Schematic illustration of hyperlipidemia being induced in a rabbit by feeding the rabbit a 0.5% cholesterol chow diet. b) Photographs of a rabbit wearing the smart contact lens. Scale bars, 2 cm. c) Changes in total cholesterol concentrations of blood in the cholesterol diet‐fed rabbits (n = 4). d) Changes in free cholesterol concentrations of tear fluids of the cholesterol diet‐fed rabbits (n = 4). e) Increases in total cholesterol in the blood (red) and free cholesterol of tear fluids (blue) according to the feeding time (n = 4). f) Schematic illustration of inducing meibomian gland dysfunction (MGD) by the injection of Complete Freund's Adjuvant (CFA). g) Meibograhpy (left) and acini data extraction (right) in before/after (top/bottom) induing MGD. Scale bars, 0.5 mm. h) Single meibomian gland area of the control and cholesterol‐fed rabbits after inducing MGD for 3 weeks (n = 4). i) Changes in the cholesterol concentrations before and after inducing MGD in the control and cholesterol‐fed rabbits (n = 4). j) Optical microscope images of a rabbit's cornea stained with hematoxylin and eosin (H&E) of before (left) and after (right) wearing and operating the smart contact lens. Scale bars, 100 µm. The error bars represent the standard deviations for (c–e), (h,i). Significant differences were analyzed using the unpaired student's t‐test and marked as * (p < 0.05), ** (p < 0.01), and *** (p < 0.001) for (c,d,h,i).
Figure 4
Figure 4
Human pilot experiment. a) Photographs of a female human subject wearing the smart contact lens and during the measurement using a smartphone. Scale bars, 2 cm. b) The sequential process of the cholesterol measurement appeared on the smartphone application. c) Cholesterol concentrations of five subjects measured using the smart contact lens (bar) and a commercial cholesterol meter (dot) (n = 5). d) Cell cytotoxicity test of control and the smart contact lenses with human corneal epithelial cell line (HCE‐2) (n = 20) and e) human conjunctival epithelial cell line (HCECs) (n = 20). Significant differences were analyzed using the unpaired student's t‐test and marked as * (p < 0.05) and *** (p < 0.001) for (c–e). The error bars represent the standard deviations for (c–e).

Similar articles

Cited by

References

    1. World Health Organization , “Cardiovascular diseases (CVDs),” https://www.who.int/news‐room/fact‐sheets/detail/cardiovascular‐diseases... (accessed: June 2021).
    1. Nelson R. H., Primary Care: Clin. Off. Pract. 2013, 40, 195. - PMC - PubMed
    1. Luo J., Yang H., Song B.‐L., Nat. Rev. Mol. Cell Biol. 2020, 21, 225. - PubMed
    1. Maxfield F. R., Tabas I., Nature 2005, 438, 612. - PubMed
    1. Sempionatto J. R., Lin M., Yin L., De la paz E., Pei K., Sonsa‐ard T., de Loyola Silva A. N., A. A., Khorshed , Zhang F., Tostado N., Xu S., Wang J., Nat. Biomed. Eng. 2021, 5, 737. - PubMed

Publication types

LinkOut - more resources