. 2022 Oct;9(28):e2201889.
doi: 10.1002/advs.202201889. Epub 2022 Aug 17.

APAF1-Binding Long Noncoding RNA Promotes Tumor Growth and Multidrug Resistance in Gastric Cancer by Blocking Apoptosome Assembly

Affiliations

APAF1-Binding Long Noncoding RNA Promotes Tumor Growth and Multidrug Resistance in Gastric Cancer by Blocking Apoptosome Assembly

Qiang Wang et al. Adv Sci (Weinh). 2022 Oct.

Abstract

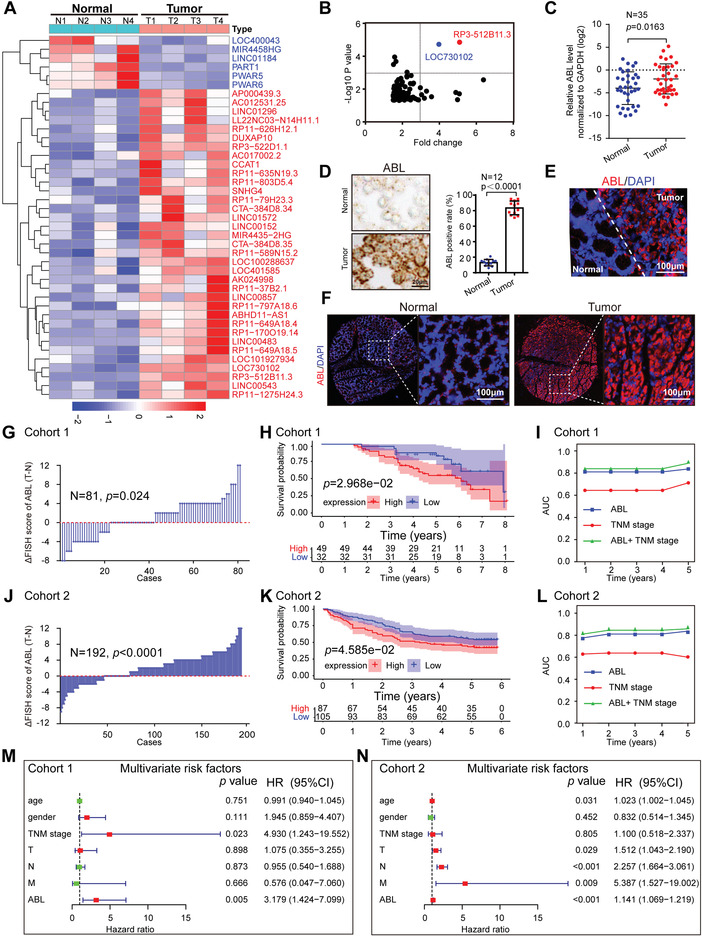
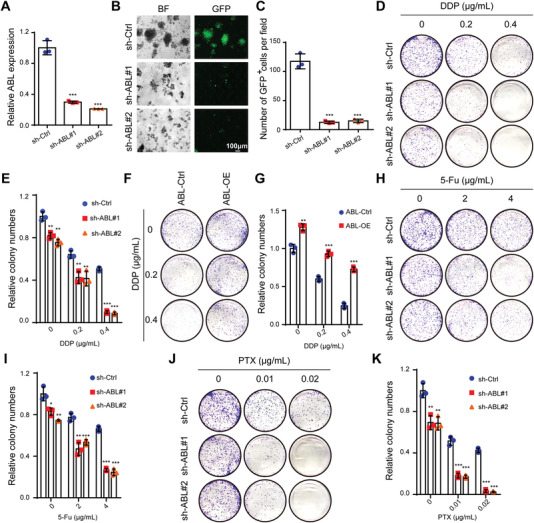
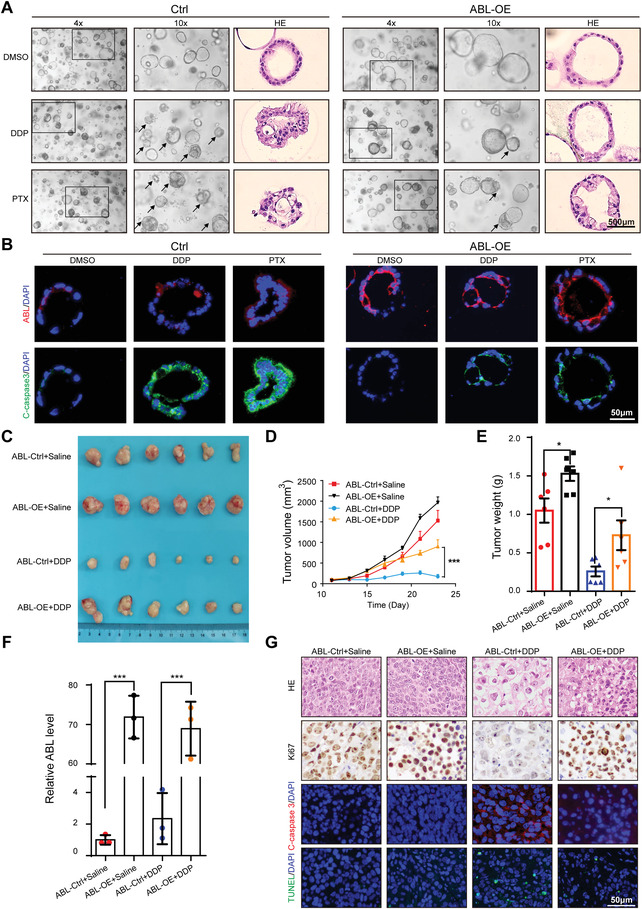
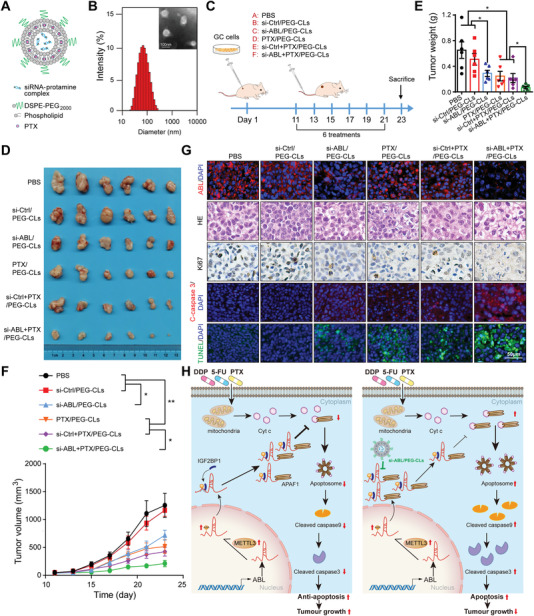
Chemotherapeutics remain the first choice for advanced gastric cancers (GCs). However, drug resistance and unavoidable severe toxicity lead to chemotherapy failure and poor prognosis. Long noncoding RNAs (lncRNAs) play critical roles in tumor progression in many cancers, including GC. Here, through RNA screening, an apoptotic protease-activating factor 1 (APAF1)-binding lncRNA (ABL) that is significantly elevated in cancerous GC tissues and an independent prognostic factor for GC patients is identified. Moreover, ABL overexpression inhibits GC cell apoptosis and promotes GC cell survival and multidrug resistance in GC xenograft and organoid models. Mechanistically, ABL directly binds to the RNA-binding protein IGF2BP1 via its KH1/2 domain, and then IGF2BP1 further recognizes the METTL3-mediated m6A modification on ABL, which maintains ABL stability. In addition, ABL can bind to the WD1/WD2 domain of APAF1, which competitively prevent cytochrome c from interacting with APAF1, blocking apoptosome assembly and caspase-9/3 activation; these events lead to resistance to cell death in GC cells. Intriguingly, targeting ABL using encapsulated liposomal siRNA can significantly enhance the sensitivity of GC cells to chemotherapy. Collectively, the results suggest that ABL can be a potential prognostic biomarker and therapeutic target in GC.

Keywords: ABL; IGF2BP1; apoptosis; apoptotic protease-activating factor 1 (APAF1); drug resistance; gastric cancer; m6A.


Conflict of interest statement

The authors declare no conflict of interest.

Figures

Figure 1
Figure 1
Elevated ABL expression correlates with a poor prognosis in GC patients. A) Hierarchical clustering showing differentially expressed lncRNAs in cancerous GC tissues and matched normal tissues (fold change > 2 or < 0.5, p < 0.05; n = 4). B) Scatter diagram showing the overlapped upregulated lncRNAs from the significantly differentially expressed candidates ranked by p‐value < 0.05 and fold change > 1.5. C) The levels of ABL expression in paired GC and normal gastric mucosal tissues were measured by qRT‐PCR (n = 35). D) RNAscope detection of ABL expression in GC and adjacent normal tissues (scale bars = 20 µm, n = 12, left panel). Statistical analysis of ABL expression (right panel). E) Representative images of RNA‐FISH staining of GC tissues with an ABL probe. Normal (N) or tumor (T) tissues are marked with dotted lines (scale bars = 100 µm). F) Representative RNA‐FISH images of a tissue microarray (TMA) for cohort 1 stained with the ABL probe (scale bars = 100 µm) are shown (n = 81). G) The distribution of the difference in the ABL score (IRS) (△IRS = IRST−IRSN) in cohort 1. H) Kaplan–Meier OS curves based on ABL expression in patients with GC in cohort 1 (n = 81). I) Time‐dependent receiver operating characteristic (ROC) curve analysis of the clinical risk score (TNM stage), ABL risk score, and combined ABL and clinical risk score in cohort 1. J) The distribution of the difference in the ABL score (IRS) (△IRS = IRST−IRSN) in cohort 2 (n = 192). K) Kaplan–Meier OS curves based on ABL expression in patients with GC in cohort 2. L) Time‐dependent ROC curve analysis of the clinical risk score (TNM stage), the ABL risk score, and the combined ABL and clinical risk score in cohort 2. M,N) Multivariate analyses were performed for GC cohorts 1 and 2. All bars correspond to 95% CIs. AUC, area under the curve; CI, confidence interval. GC, gastric cancer; HR, hazard ratio; OS, overall survival; TNM, tumor, node, metastasis. The differences in IRS for ABL staining in primary tumors and corresponding normal tissues were assessed by the Wilcoxon test (grouped) (G and J). The probability of differences in OS was ascertained by the Kaplan‐Meier method with the log‐rank test (H and K). The data were analyzed by a two‐tailed unpaired Student's t‐test (C and D). The data are represented as the means ± SEM. * p < 0.05; ** p < 0.01; *** p < 0.001, NS, no significance.
Figure 2
Figure 2
ABL directly binds to APAF1. A) Localization of ABL in BGC823 cells detected by RNA‐FISH. U6 and 18S rRNA were used as positive controls for the nuclear and cytoplasmic fractions, respectively. B) Coomassie brilliant blue staining of proteins pulled down by biotinylated ABL. Sen., sense transcript; as., antisense transcript. C) Western blot detection of APAF1 pulled down by in vitro‐transcribed biotinylated ABL from BGC‐823 cell lysates. GAPDH was used as a negative control. D) The interaction of ABL with APAF1 in BGC823 cells was shown by RIP‐qPCR detection of the ABL pulled down by an anti‐APAF1 antibody. E) Confocal images showing colocalization of ABL (red) and APAF1 (green) in BGC823 cells (scale bars = 5 µm, left panel). Right panel: the images were subject to Z‐axis profile analysis. F) In vitro RNA pull‐down coupled with a dot blot assay using the indicated RNA transcripts and recombinant APAF1 proteins. Bottom panel: Annotation of each dot. G) In vitro‐transcribed antisense, sense, or sense with deletion of nt 481–540 (binding region for APAF1) ABL transcripts were incubated with recombinant histidine (His)‐tagged APAF1 proteins for an in vitro streptavidin RNA pull‐down assay, followed by Western blot detection using an anti‐His antibody. H) Graphic illustration of APAF1 deletion mutants. I) In vitro RNA protein binding assay showing the interaction of biotinylated ABL with Flag‐tagged APAF1 proteins, including the WT protein and CARD, NB‐ARC, WD1, WD2, or WD1/WD2 deletion mutants. J) Docking analysis of the protein‐RNA interaction model between APAF1 and ABL (nt 481–540). K) Genomic distribution of the APAF1 binding peaks from LACE‐seq reads. L) The meta profile of APAF1‐RNA interacting sites. TSS: transcription start site; TTS: transcription termination site. M) Enriched sequence among APAF1‐RNA crosslinking sites by the Multiple Em for Motif Elicitation (MEME) tool. N) RIP‐qPCR analysis was used to detect whether APAF1 could enrich the mRNAs or lncRNAs identified in LACE‐seq. The data were analyzed by a two‐tailed unpaired Student's t‐test (D and N). The data are represented as the means ± SEM of three independent experiments. * p < 0.05; ** p < 0.01; *** p < 0.001, NS, no significance.
Figure 3
Figure 3
Knockdown of ABL promotes GC cell apoptosis and sensitivity to multiple drugs in vitro. A) Knockdown efficiencies were verified in MKN45 cells by qRT‐PCR. B) Suspension growth assays were used to determine the cell survival of ABL‐deficient MKN45 cells. C) Quantification of the GFP+ cells in (B). D) Knockdown of ABL decreased the colony‐forming ability of MKN45 cells and promoted DDP‐induced apoptosis in these cells. E) Quantification of the colony formation assay results in (D). F) Overexpression of ABL increased the colony‐forming ability of BGC823 cells and antagonized DDP‐induced apoptosis in these cells. G) Quantification of the colony formation assay results in (F). H) Knockdown of ABL decreased the colony‐forming ability of MKN45 cells and promoted 5‐Fu‐induced apoptosis in these cells. I) Quantification of the colony formation assay results in (H). J) Knockdown of ABL decreased the colony‐forming ability of MKN45 cells and promoted PTX‐induced apoptosis in these cells. K) Quantification of the colony formation assay results in (J). The data were analyzed by a two‐tailed unpaired Student's t‐test (A, C, E, G, I, and K). The data are represented as the means ± SEM of three independent experiments. * p < 0.05; ** p < 0.01; *** p < 0.001, NS, no significance.
Figure 4
Figure 4
ABL antagonizes GC cell apoptosis by competitively blocking the binding of APAF1 with Cyt c. A) Western blotting was applied to determine the expression of the indicated proteins in ABL‐overexpressing BGC823 cells after DDP treatment at 0 or 1 µg mL−1 for 24 h. B) Immunoprecipitation (IP) and Western blotting were used to detect the interaction between APAF1 and Cyt c in ABL‐overexpressing BGC823 cells after DDP treatment at 0 or 1 µg mL−1 for 24 h. C) Confocal images showing colocalization of APAF1 (green) and Cyt c (red) in ABL‐overexpressing BGC823 cells after DDP treatment at 1 µg mL−1 for 24 h (scale bars = 25 µm, left panel). Right panel: the images were subject to Z‐axis profile analysis. D) Caspase‐9 activity was detected in ABL‐overexpressing BGC823 cells and corresponding control cells after DDP treatment at 1 µg mL−1 for 24 h. E) Docking analysis of the protein–protein or protein–RNA interaction model between APAF1‐Cyt c and APAF1‐ABL (nt 481–540), respectively. F) His‐tagged WD1/WD2 domain of APAF1 bound to Ni‐NTA beads was incubated with or without increasing amounts of 1 or 2 µg ABL sense, anti‐sense, or mutant sense (∆APAF1) and purified GST‐Cyt c. Bead‐bound proteins and the input were analyzed by western blot and coomassie blue staining. G) An annexin‐V‐FITC/PI assay was used to detect apoptotic ABL‐overexpressing BGC823 cells after DDP treatment at 0 or 1 µg mL−1 for 24 h. H) Quantification of the apoptotic cells in (G). I) A TUNEL assay was used to detect apoptotic ABL‐overexpressing and corresponding control BGC823 cells after DDP treatment at 0 or 1 µg mL−1 for 24 h. J) Quantification of the apoptotic cells in (I). The data were analyzed by a two‐tailed unpaired Student's t‐test (D, H, and J). The data are represented as the means ± SEM of three independent experiments. * p < 0.05; ** p < 0.01; *** p < 0.001, NS, no significance.
Figure 5
Figure 5
ABL promotes GC cell growth and multidrug resistance in vivo. A) GC organoids were infected with ABL overexpression vectors or a control lentivirus and treated with or without DDP (5 µg mL−1) or PTX (0.4 µg mL−1) for 24 h. Representative bright‐field images and hematoxylin and eosin (H&E) staining are shown (scale bars = 500 µm, n = 3). B) Sections of organoids were stained with ABL probes and an anti‐cleaved caspase‐3 antibody (scale bars = 50 µm). C) Overexpression of ABL effectively promoted subcutaneous GC tumor growth and antagonized the antitumor effect of cisplatin in nude mice (n = 6). D) Tumor volume was monitored every other day, and tumor growth curves were generated. E) Tumors were extracted and weighed at the end of the experiment. F) The expression of ABL was detected in each group by qRT‐PCR. G) Sections of tumors were stained with H&E, and anti‐Ki67 antibody, an anti‐cleaved caspase‐3 antibody, or TUNEL reagents (scale bars = 50 µm). The data were analyzed by one‐way ANOVA test followed by Turkey's multiple comparisons (D). The data were analyzed by a two‐tailed unpaired Student's t‐test (E and F). The data are represented as the means ± SEM of three independent experiments. * p < 0.05; ** p < 0.01; *** p < 0.001, NS, no significance.
Figure 6
Figure 6
IGF2BP1 binds and recognizes the METTL3‐mediated m6A modification on ABL, maintaining ABL stability. A) The ABL levels in BGC823 cells with IGF2BP1 deficiency were determined by qRT‐PCR. B) Western blot detection of IGF2BP1 pulled down by in vitro‐transcribed biotinylated ABL from BGC‐823 cell lysates. Sen., sense transcript; as., antisense transcript. C) The interaction of ABL with IGF2BP1 in BGC823 cells was examined by a RIP‐qPCR assay. D) Confocal images showing colocalization of ABL (red) and IGF2BP1 (green) in BGC823 cells (scale bars = 5 µm). E) Graphic illustration of IGF2BP1 deletion mutants. F) In vitro RNA protein binding assay showing the interaction of biotinylated ABL with HA‐tagged IGF2BP1 proteins, including the WT protein and RRM, KH1/2, or KH3/4 deletion mutants. G) In vitro RNA pull‐down coupled with a dot blot assay using the indicated RNA transcripts and recombinant IGF2BP1 proteins. Bottom panel: Annotation of each dot. H) In vitro‐transcribed antisense, sense, sense with deletion of nt 121–180 (binding region for IGF2BP1) or sense with deletion of nt 481–540 (binding region for APAF1) ABL transcripts were incubated with recombinant His‐IGF2BP1 proteins for an in vitro streptavidin RNA pull‐down assay, followed by Western blot detection using an anti‐His antibody. I) Graphic illustration of the “CACA” motif in ABL for IGF2BP1 binding and the “GGAC” motif, including the m6A modification site for IGF2BP1 recognition. J) Schematic presentation of the construction of the luciferase reporter containing ABL‐WT or ABL‐Mut region. K) Relative luciferase activity of the ABL‐WT or ABL‐Mut luciferase reporter in BGC823 cells with IGF2BP1 overexpression and corresponding control cells was detected. L) The calculated protein–RNA interaction model between IGF2BP1 and ABL (nt 121–180). M,N) The ABL levels in GC cells with wild‐type or catalytic mutant (Mut) METTL3 overexpression and METTL3‐deficient were detected by qRT‐PCR. O) MeRIP‐qPCR analysis was used to demonstrate METTL3‐mediated m6A modifications on ABL. The m6A modification of ABL was increased upon upregulation of wide type METTL3 while no significant change upon of Mut METTL3. P) RIP‐qPCR analysis was used to demonstrate that IGF2BP1 could enrich more ABL upon overexpression of METTL3. Q) The levels of ABL expression in METTL3‐overexpressing and corresponding control GC cells treated with actinomycin D (2 µg mL−1) at the indicated time points were detected by qRT‐PCR. R) The levels of ABL expression in IGF2BP1‐deficient and corresponding control GC cells treated with actinomycin D (2 µg mL−1) at the indicated time points were detected by qRT‐PCR. S) Representative images of the cell colony formation abilities of METTL3‐overexpressing BGC823 cells transfected with ABL‐specific siRNAs or corresponding controls and treated with DDP at the indicated doses for 24 h. T) Quantification of the colony formation assay results in (S). U) Immunoprecipitation (IP) and Western blotting were used to detect the interaction between APAF1 and Cyt c in IGF2BP1 or METTL3 deficient BGC823 cells after DDP treatment at 1 µg mL−1 for 24 h. The data were analyzed by a two‐tailed unpaired Student's t‐test (A, C, K, M–R, and T). The data are represented as the means ± SEM of three independent experiments. * p < 0.05; ** p < 0.01; *** p < 0.001, NS, no significance.
Figure 7
Figure 7
Nanoencapsulated ABL‐specific siRNA and PTX synergistically induce GC cell apoptosis in vivo. A) Graphic illustration of si‐ABL and PTX encapsulated in PEG‐CLs. B) Representative TEM image and the size distribution profile of si‐ABL+PTX/PEG‐CLs. C) Graphic illustration of the therapeutic model. D) ABL‐specific siRNA‐loaded PEG‐CLs inhibited subcutaneous GC tumor growth and promoted PTX‐induced apoptosis in nude mice (n = 6). E) Tumors were extracted and weighed at the end of the experiment. F) Tumor volume was monitored every other day, and tumor growth curves were generated. G) Sections of tumors were stained with an ABL probe, hematoxylin and eosin (H&E), an anti‐Ki67 antibody, an anti‐cleaved caspase‐3 antibody, or TUNEL reagents (scale bars = 50 µm). H) Graphic illustration of ABL modulating GC cell apoptosis induced by chemotherapeutic drugs and knockdown of ABL (using nanoencapsulated siRNA) and nanoencapsulated PTX synergistically inducing GC cell apoptosis. The data were analyzed by a two‐tailed unpaired Student's t‐test (E). The data were analyzed by one‐way ANOVA test followed by Turkey's multiple comparisons (F). The data are represented as the means ± SEM of three independent experiments. * p < 0.05; ** p < 0.01; *** p < 0.001, NS, no significance.

Similar articles

Cited by

References

    1. a) Chen W., Zheng R., Baade P. D., Zhang S., Zeng H., Bray F., Jemal A., Yu X. Q., He J., Ca‐Cancer J. Clin. 2016, 66, 115; - PubMed
    2. b) Ferlay J., Colombet M., Soerjomataram I., Mathers C., Parkin D. M., Pineros M., Znaor A., Bray F., Int. J. Cancer 2019, 144, 1941; - PubMed
    3. c) Smyth E. C., Nilsson M., Grabsch H. I., van Grieken N. C., Lordick F., Lancet 2020, 396, 635. - PubMed
    1. Wang Q., Xiong J., Qiu D., Zhao X., Yan D., Xu W., Wang Z., Chen Q., Panday S., Li A., Wang S., Zhou J., Int. J. Biochem. Cell Biol. 2017, 92, 164. - PubMed
    1. a) Mahipal A., Malafa M., Pharmacol. Ther. 2016, 164, 135; - PubMed
    2. b) Li B., Jiang J., Assaraf Y. G., Xiao H., Chen Z. S., Huang C., Drug Resistance Updates 2020, 53, 100720. - PubMed
    1. a) Kang Y. K., Chin K., Chung H. C., Kadowaki S., Oh S. C., Nakayama N., Lee K. W., Hara H., Chung I. J., Tsuda M., Park S. H., Hosaka H., Hironaka S., Miyata Y., Ryu M. H., Baba H., Hyodo I., Bang Y. J., Boku N., Lancet 2020, 21, 1045; - PubMed
    2. b) Shitara K., Van Cutsem E., Bang Y. J., Fuchs C., Wyrwicz L., Lee K. W., Kudaba I., Garrido M., Chung H. C., Lee J., Castro H. R., Mansoor W., Braghiroli M. I., Karaseva N., Caglevic C., Villanueva L., Goekkurt E., Satake H., Enzinger P., Alsina M., Benson A., Chao J., Ko A. H., Wainberg Z. A., Kher U., Shah S., Kang S. P., Tabernero J., JAMA, J. Am. Med. Assoc. Oncol. 2020, 6, 1571; - PMC - PubMed
    3. c) Hong C., Wang D., Liang J., Guo Y., Zhu Y., Xia J., Qin J., Zhan H., Wang J., Theranostics 2019, 9, 4437. - PMC - PubMed
    1. a) Wang Q., Chen Q., Zhu L., Chen M., Xu W., Panday S., Wang Z., Li A., Roe O. D., Chen R., Wang S., Zhang R., Zhou J., Oncogenesis 2017, 6, e353; - PMC - PubMed
    2. b) Bian M., Fan R., Zhao S., Liu W., J. Med. Chem. 2019, 62, 7309; - PubMed
    3. c) Deng J., Acta Pharm. Sin. B 2017, 7, 18. - PMC - PubMed

Publication types

MeSH terms