

Spectral calibration of photon-counting detectors at high photon flux
- PMID: 35975670
- PMCID: PMC9588681
- DOI: 10.1002/mp.15942
Spectral calibration of photon-counting detectors at high photon flux
Abstract
Background: Calibration of photon-counting detectors (PCDs) is necessary for quantitatively accurate spectral computed tomography (CT), but the calibration process can be complicated by nonlinear flux-dependent physical factors such as pulse pile-up.
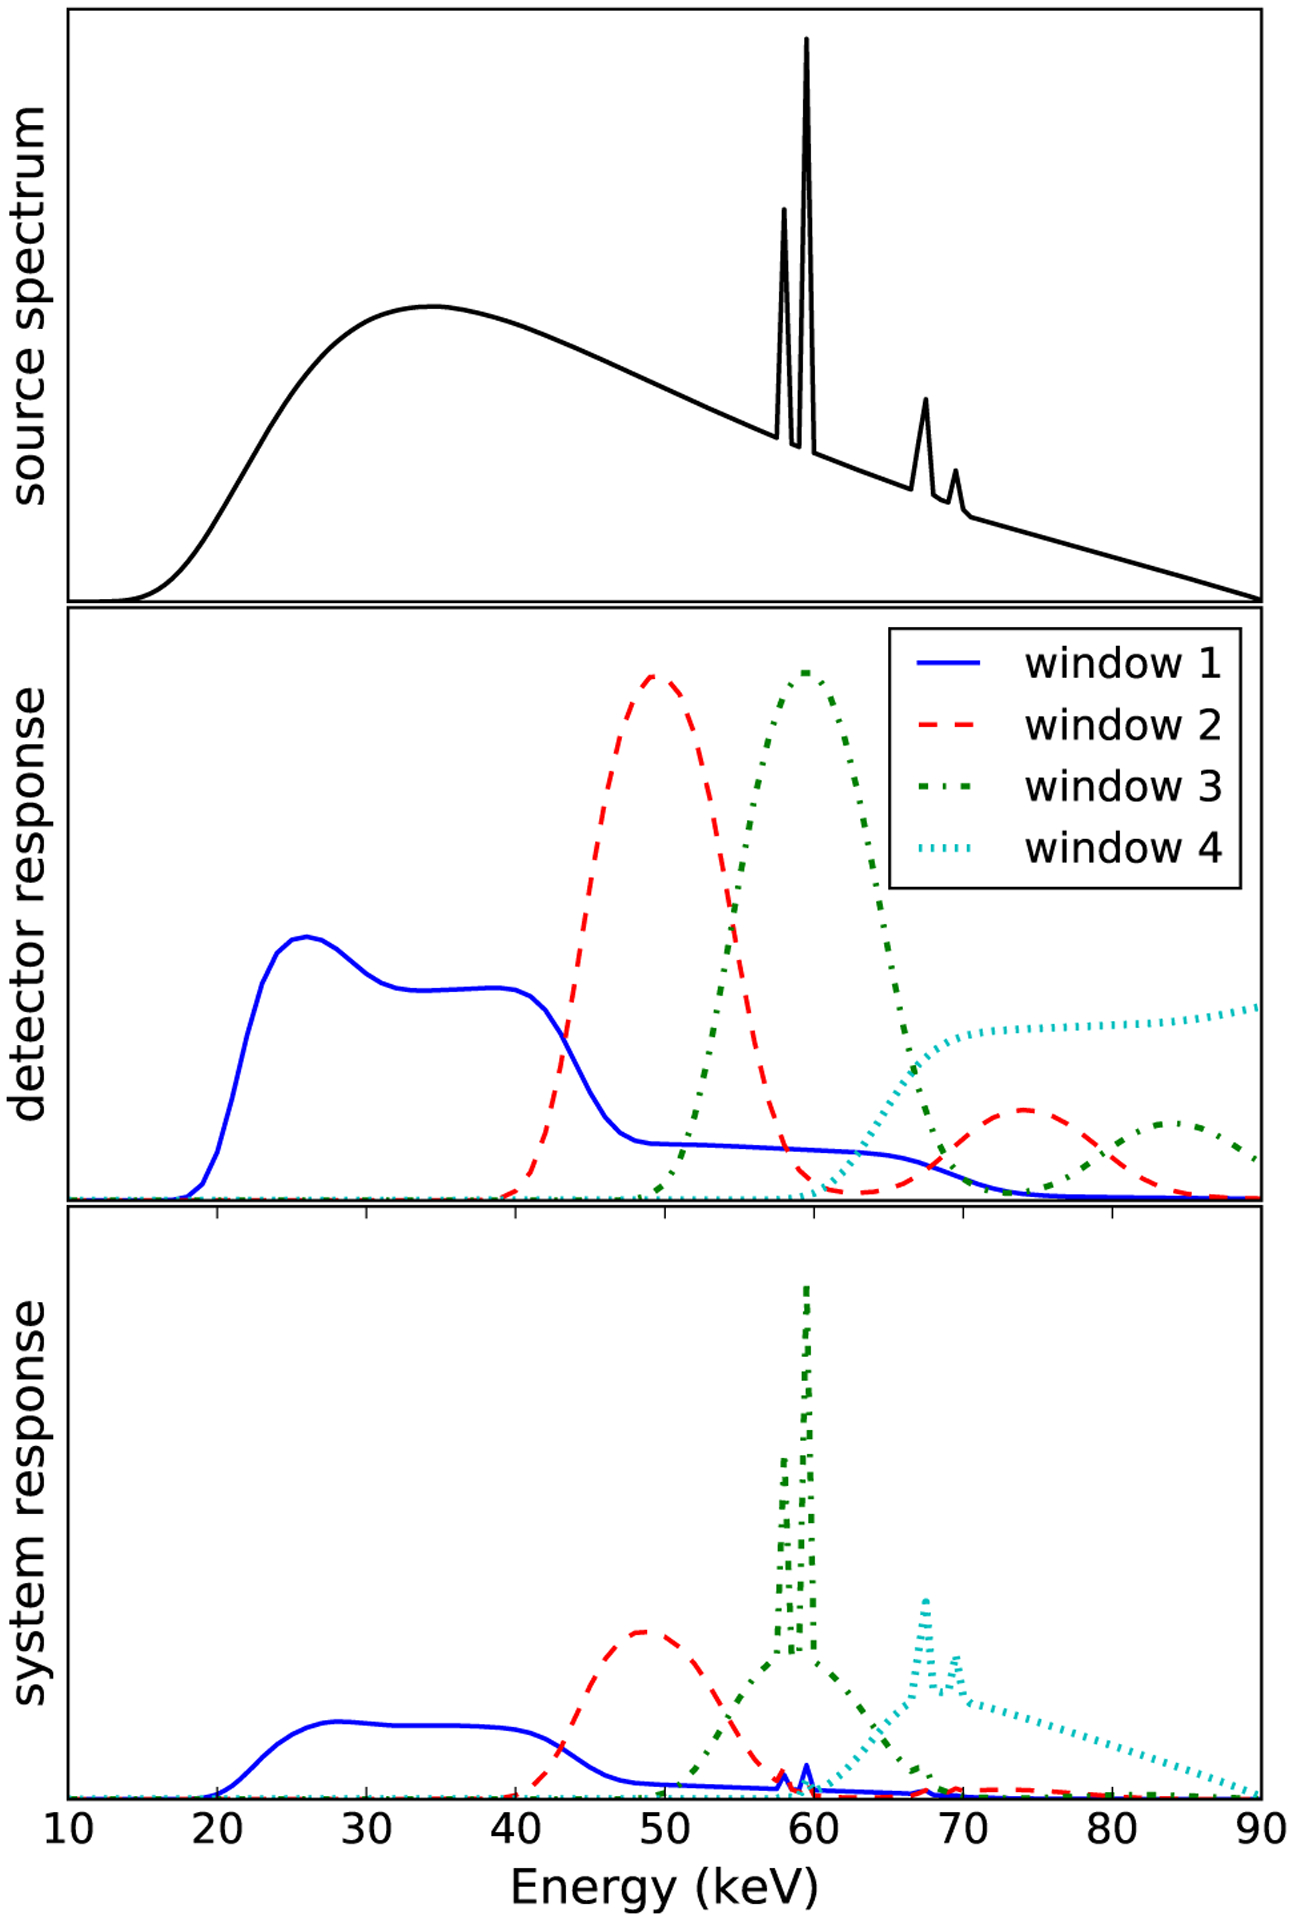
Purpose: This work develops a method for spectral sensitivity calibration of a PCD-based spectral CT system that incorporates nonlinear flux dependence and can thus be employed at high photon flux.
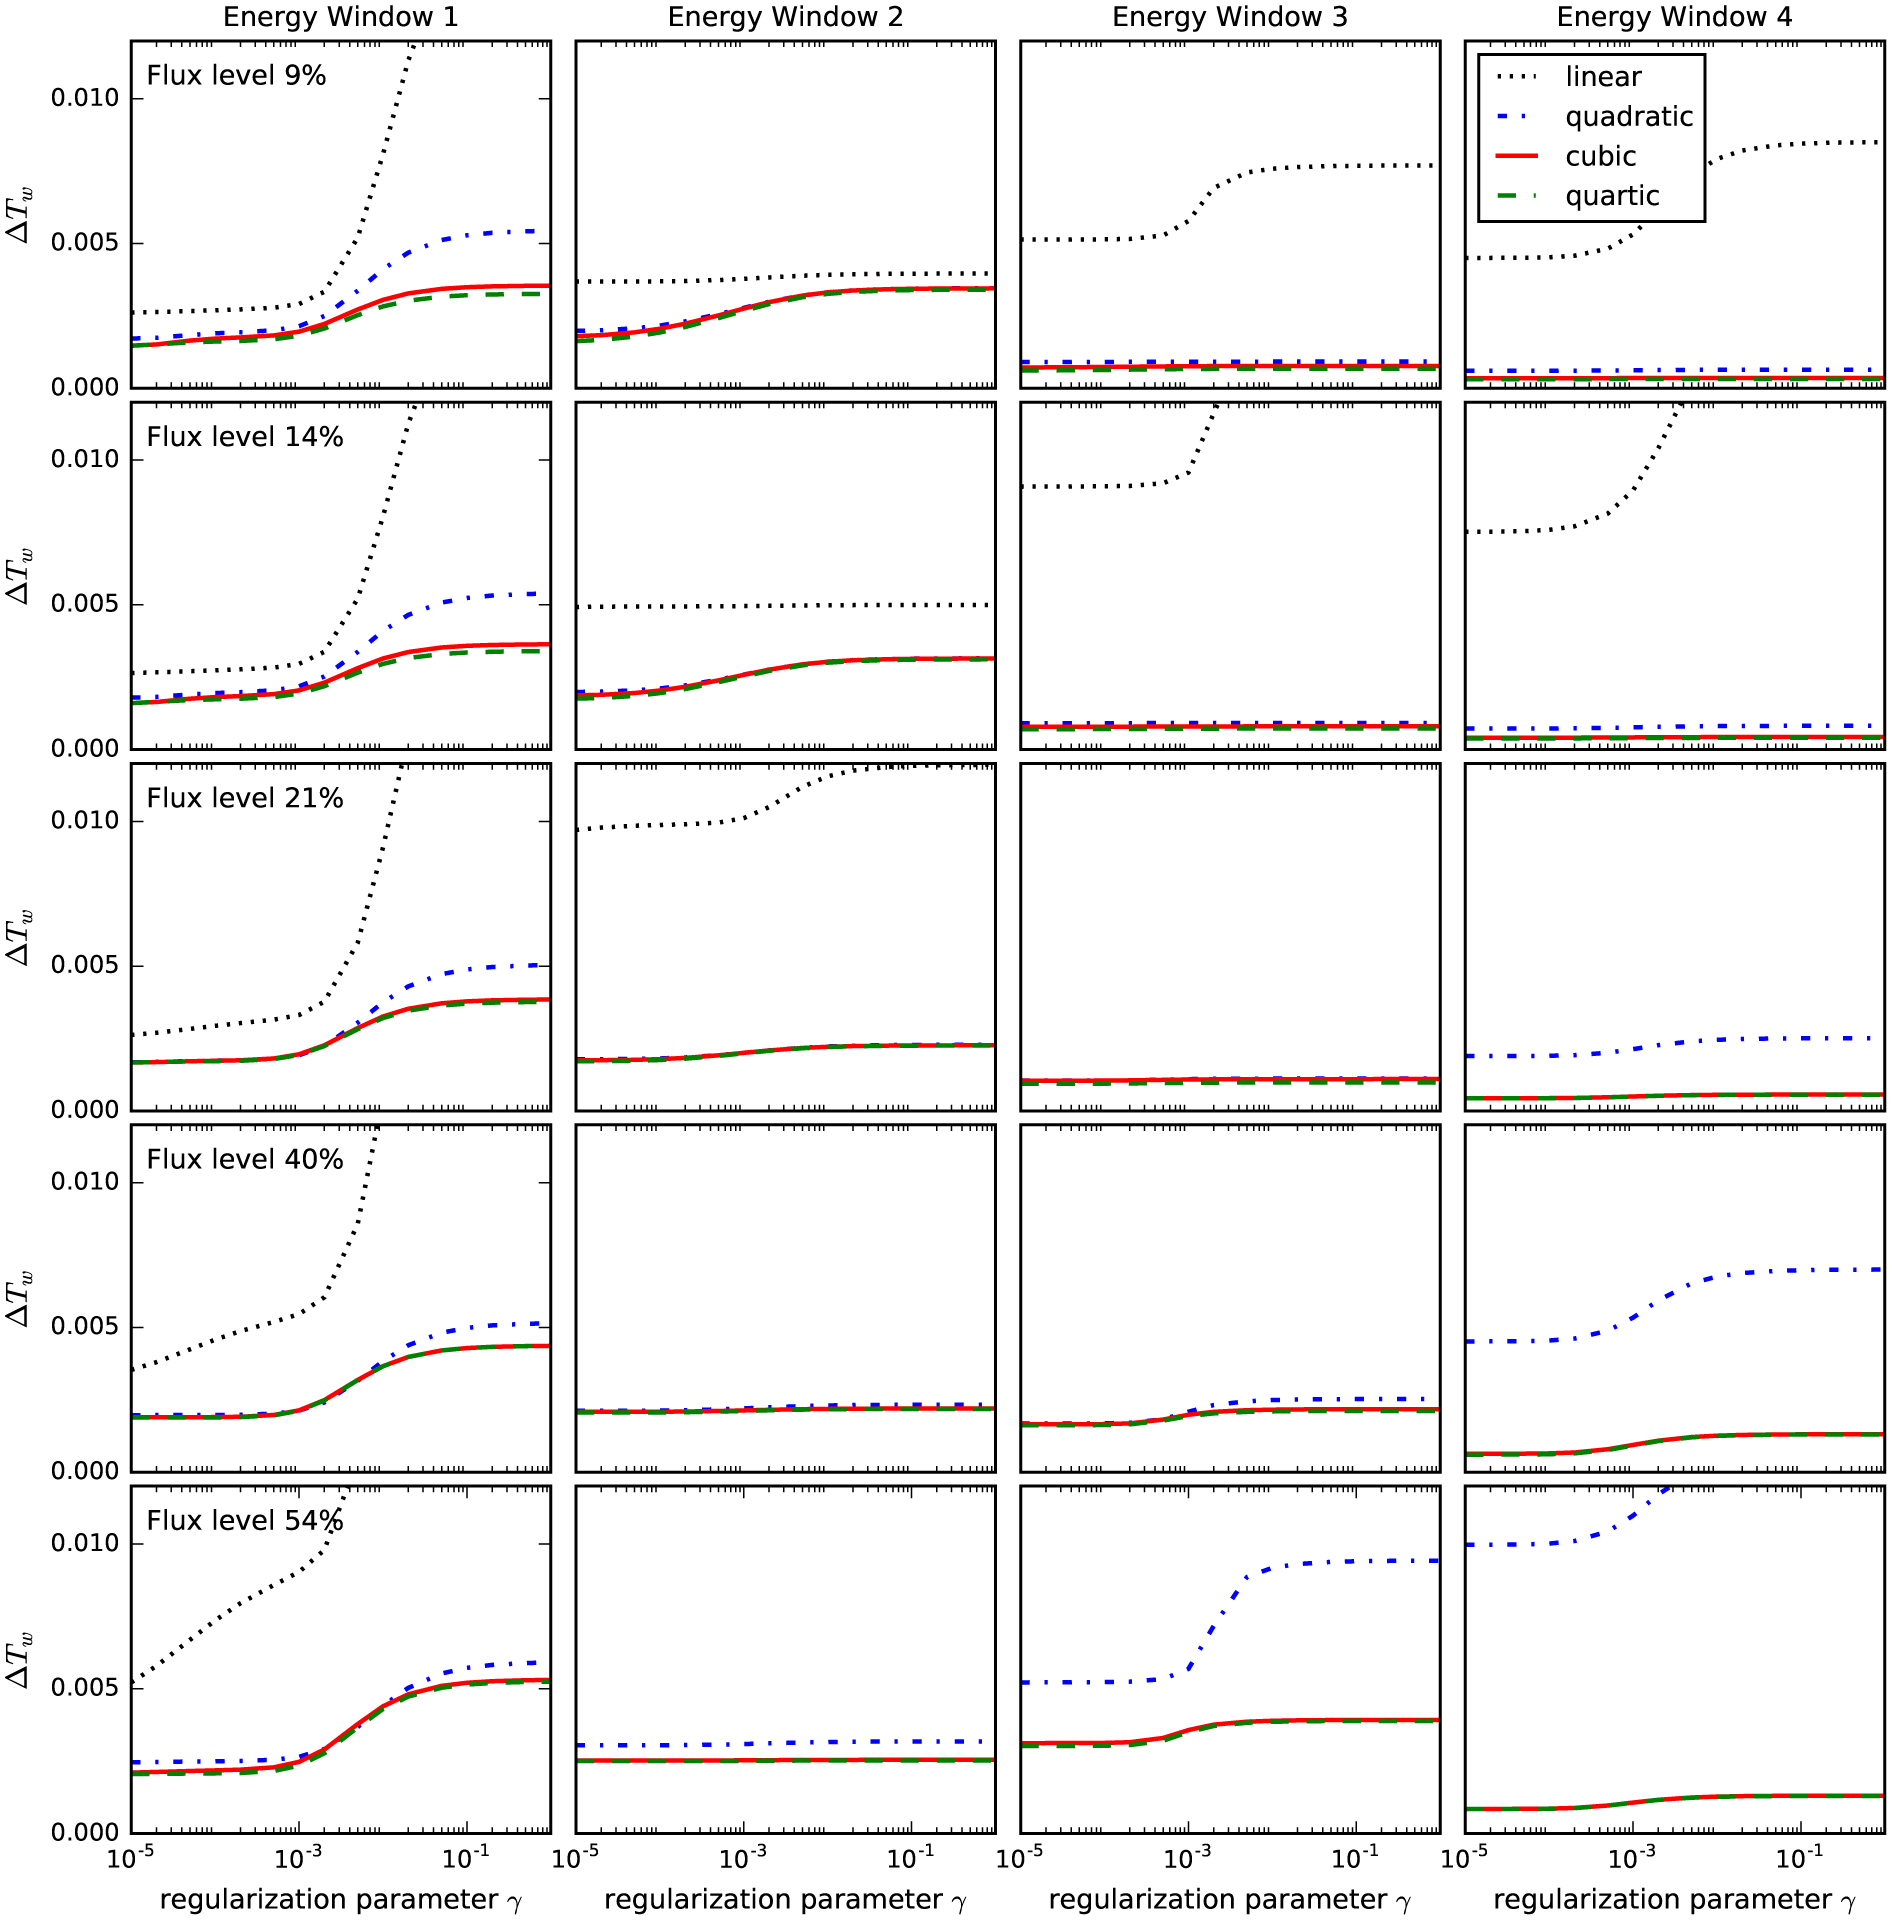
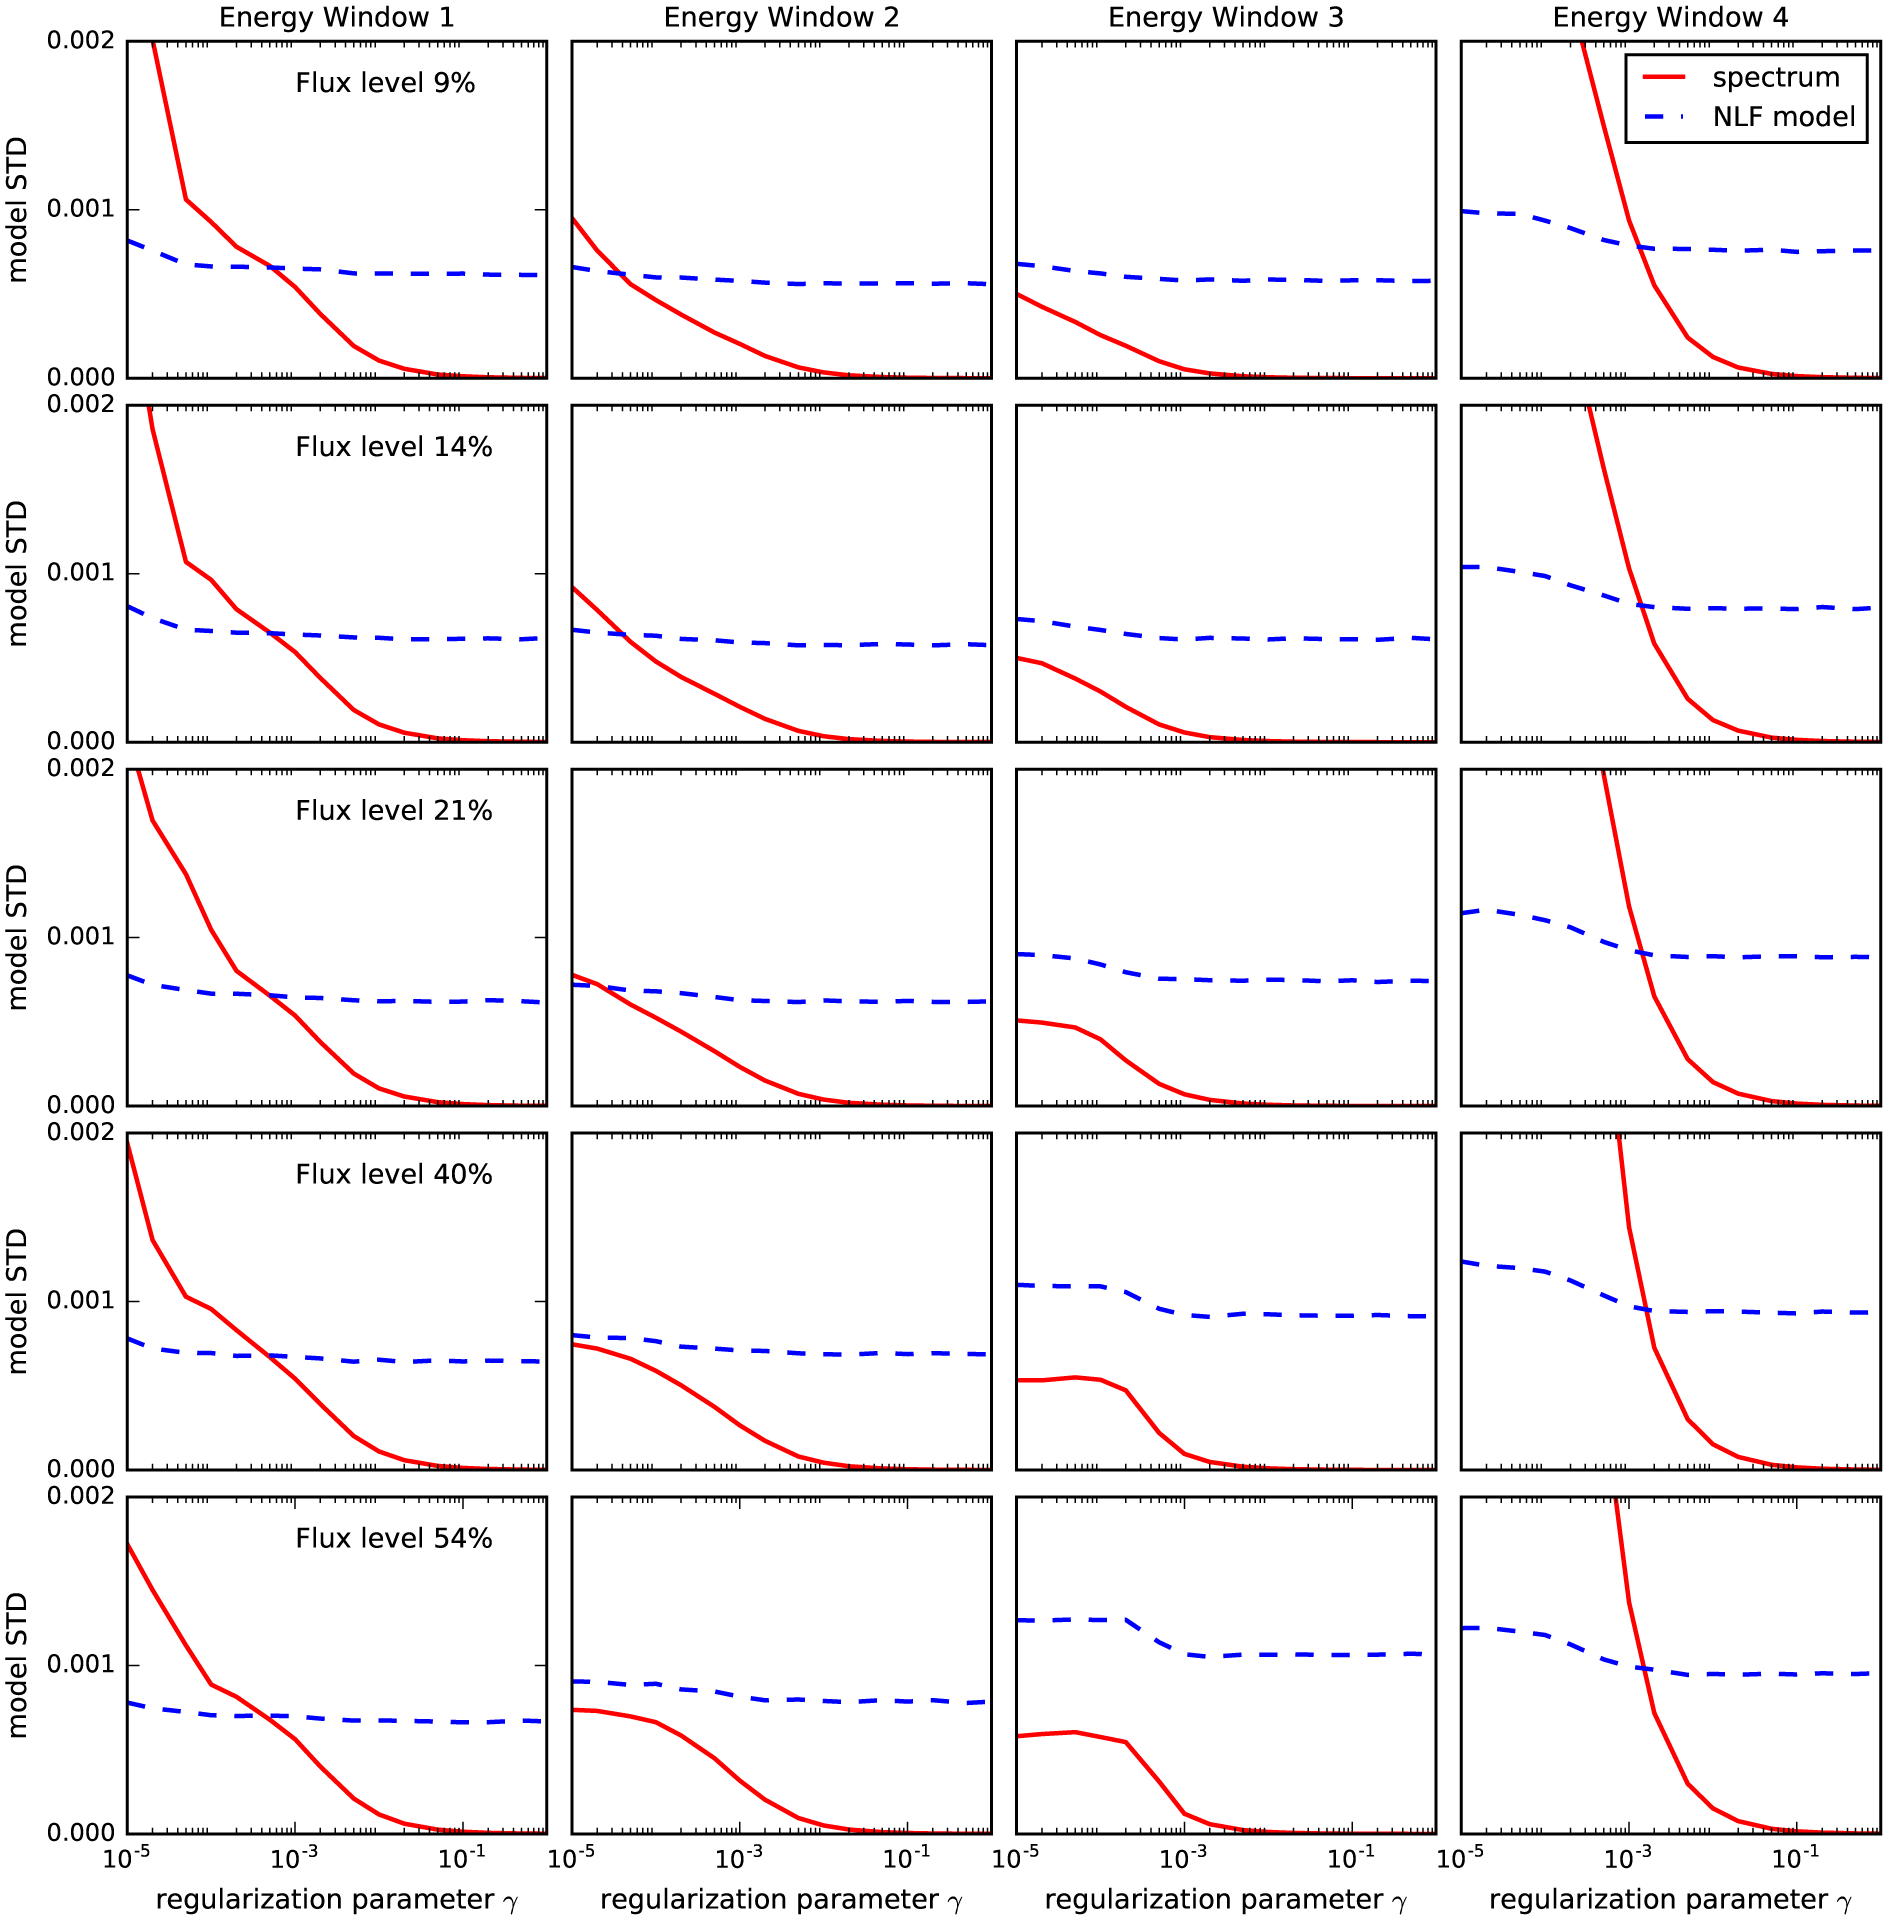
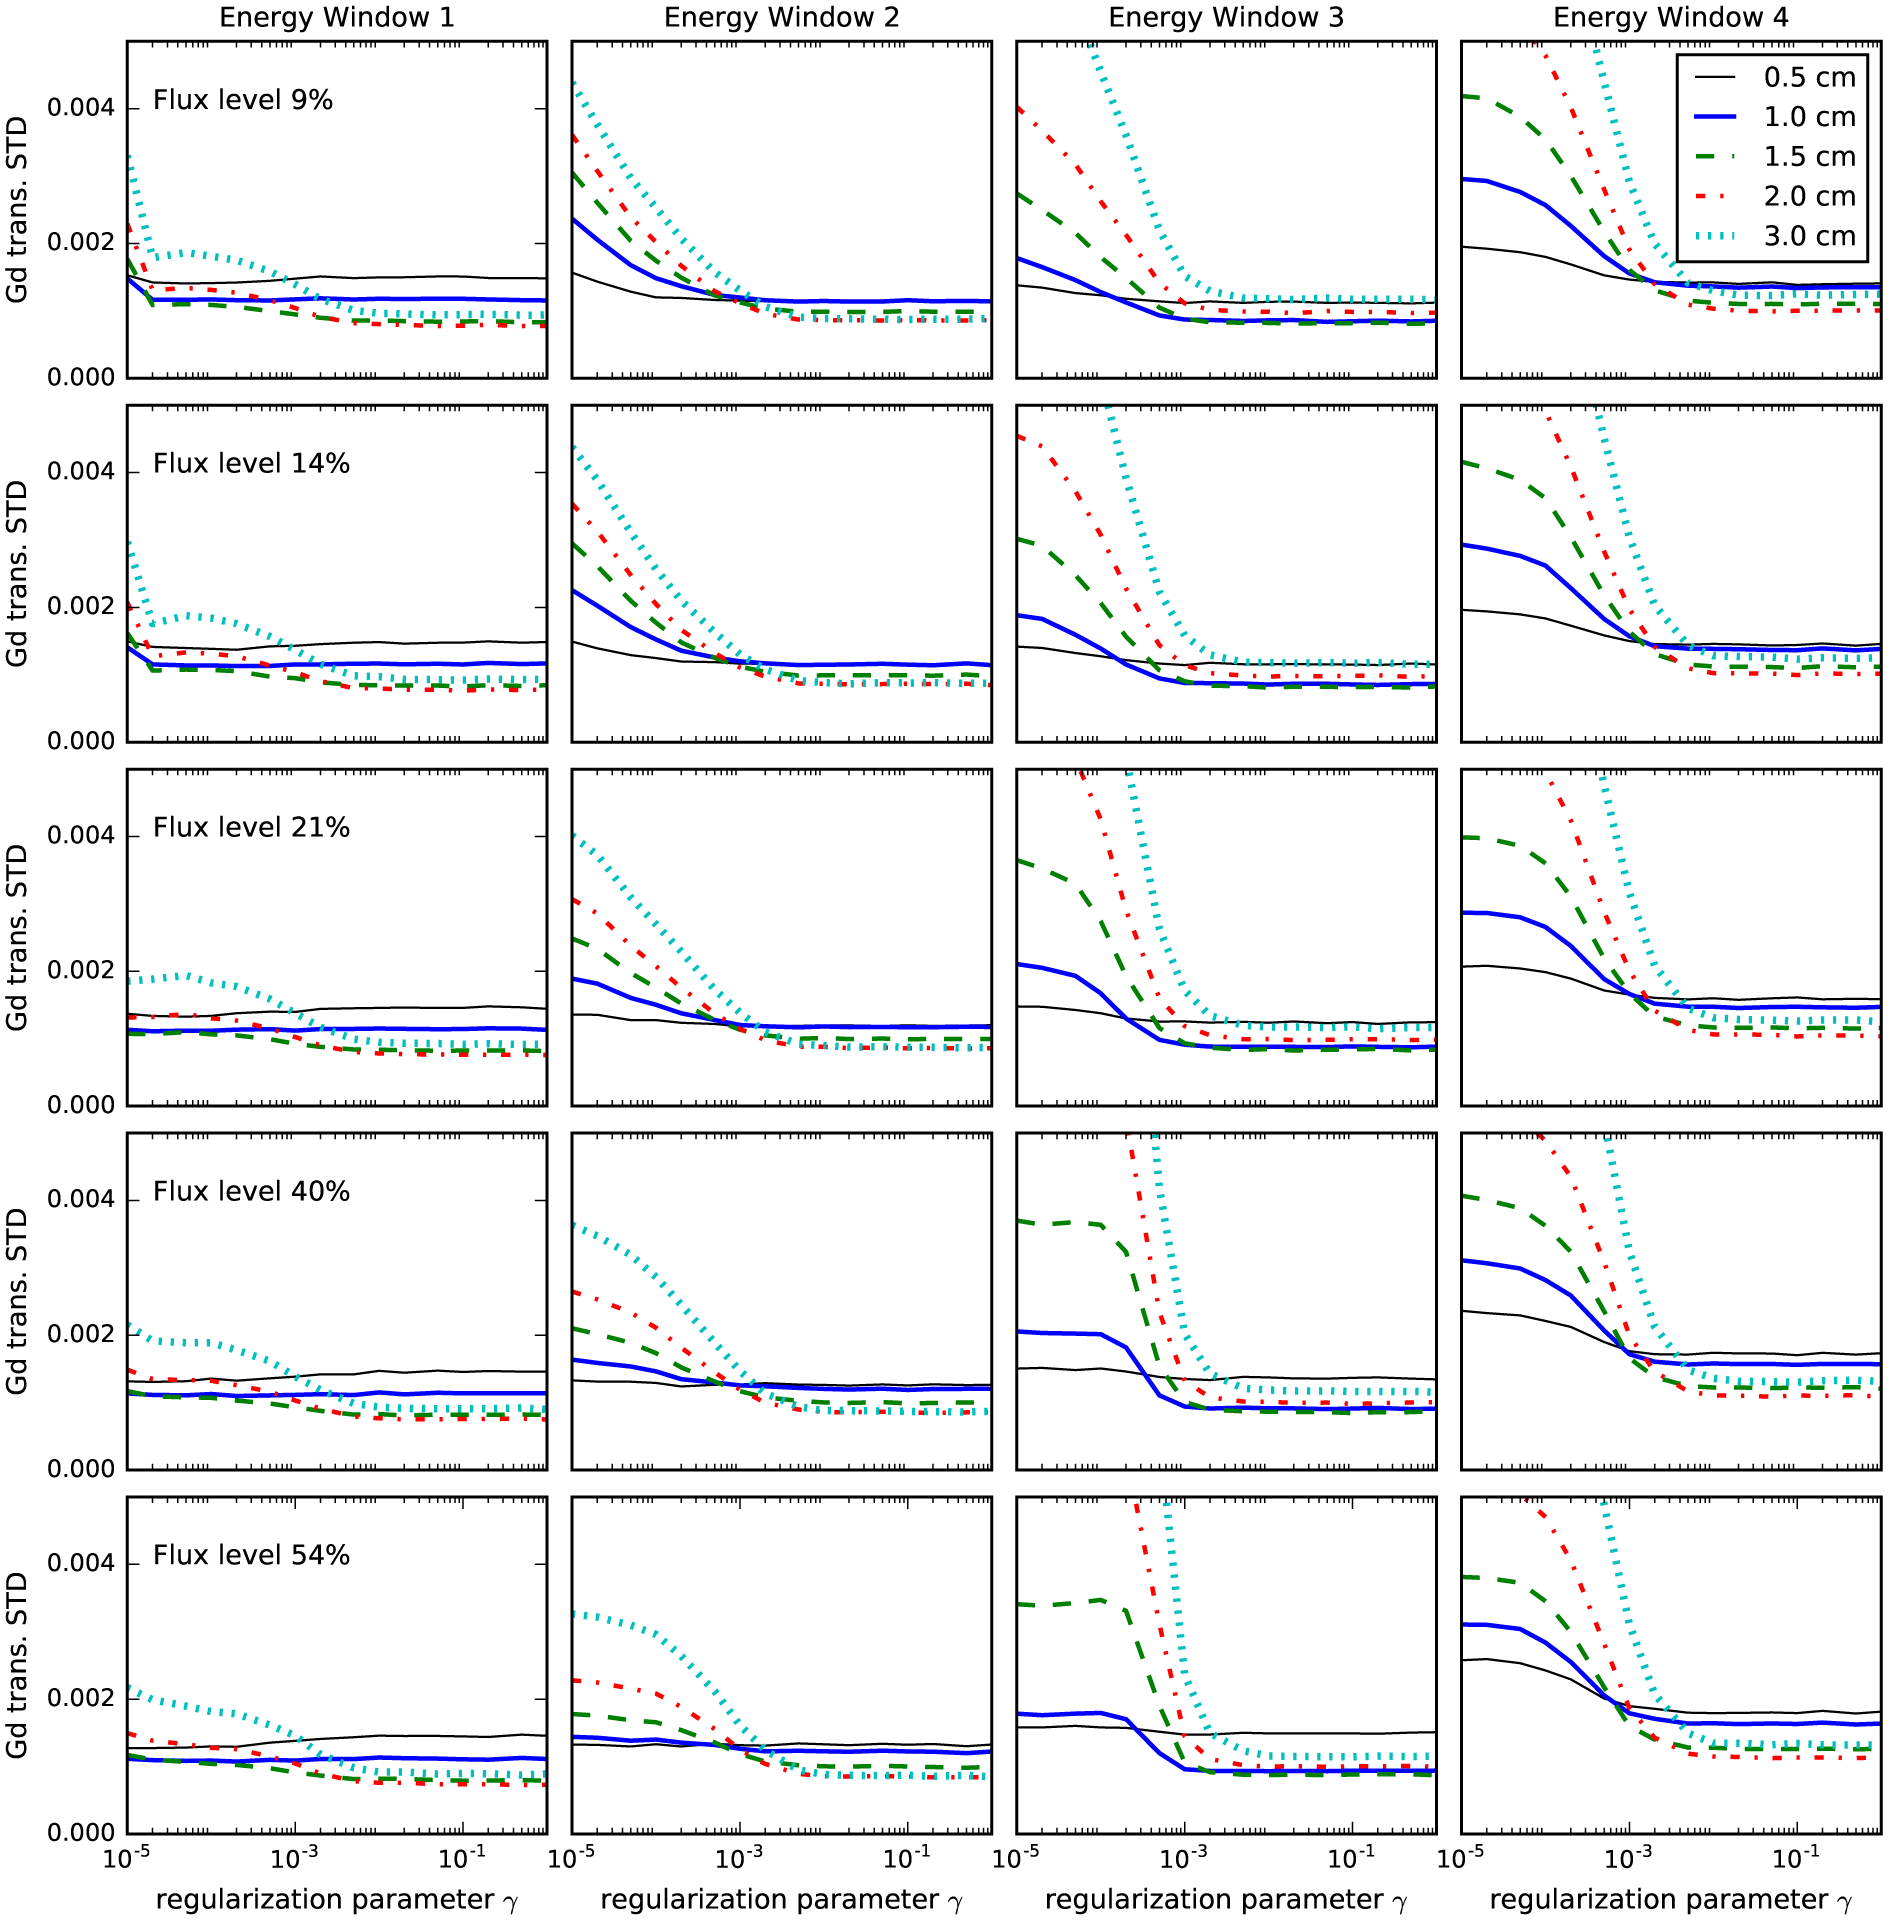
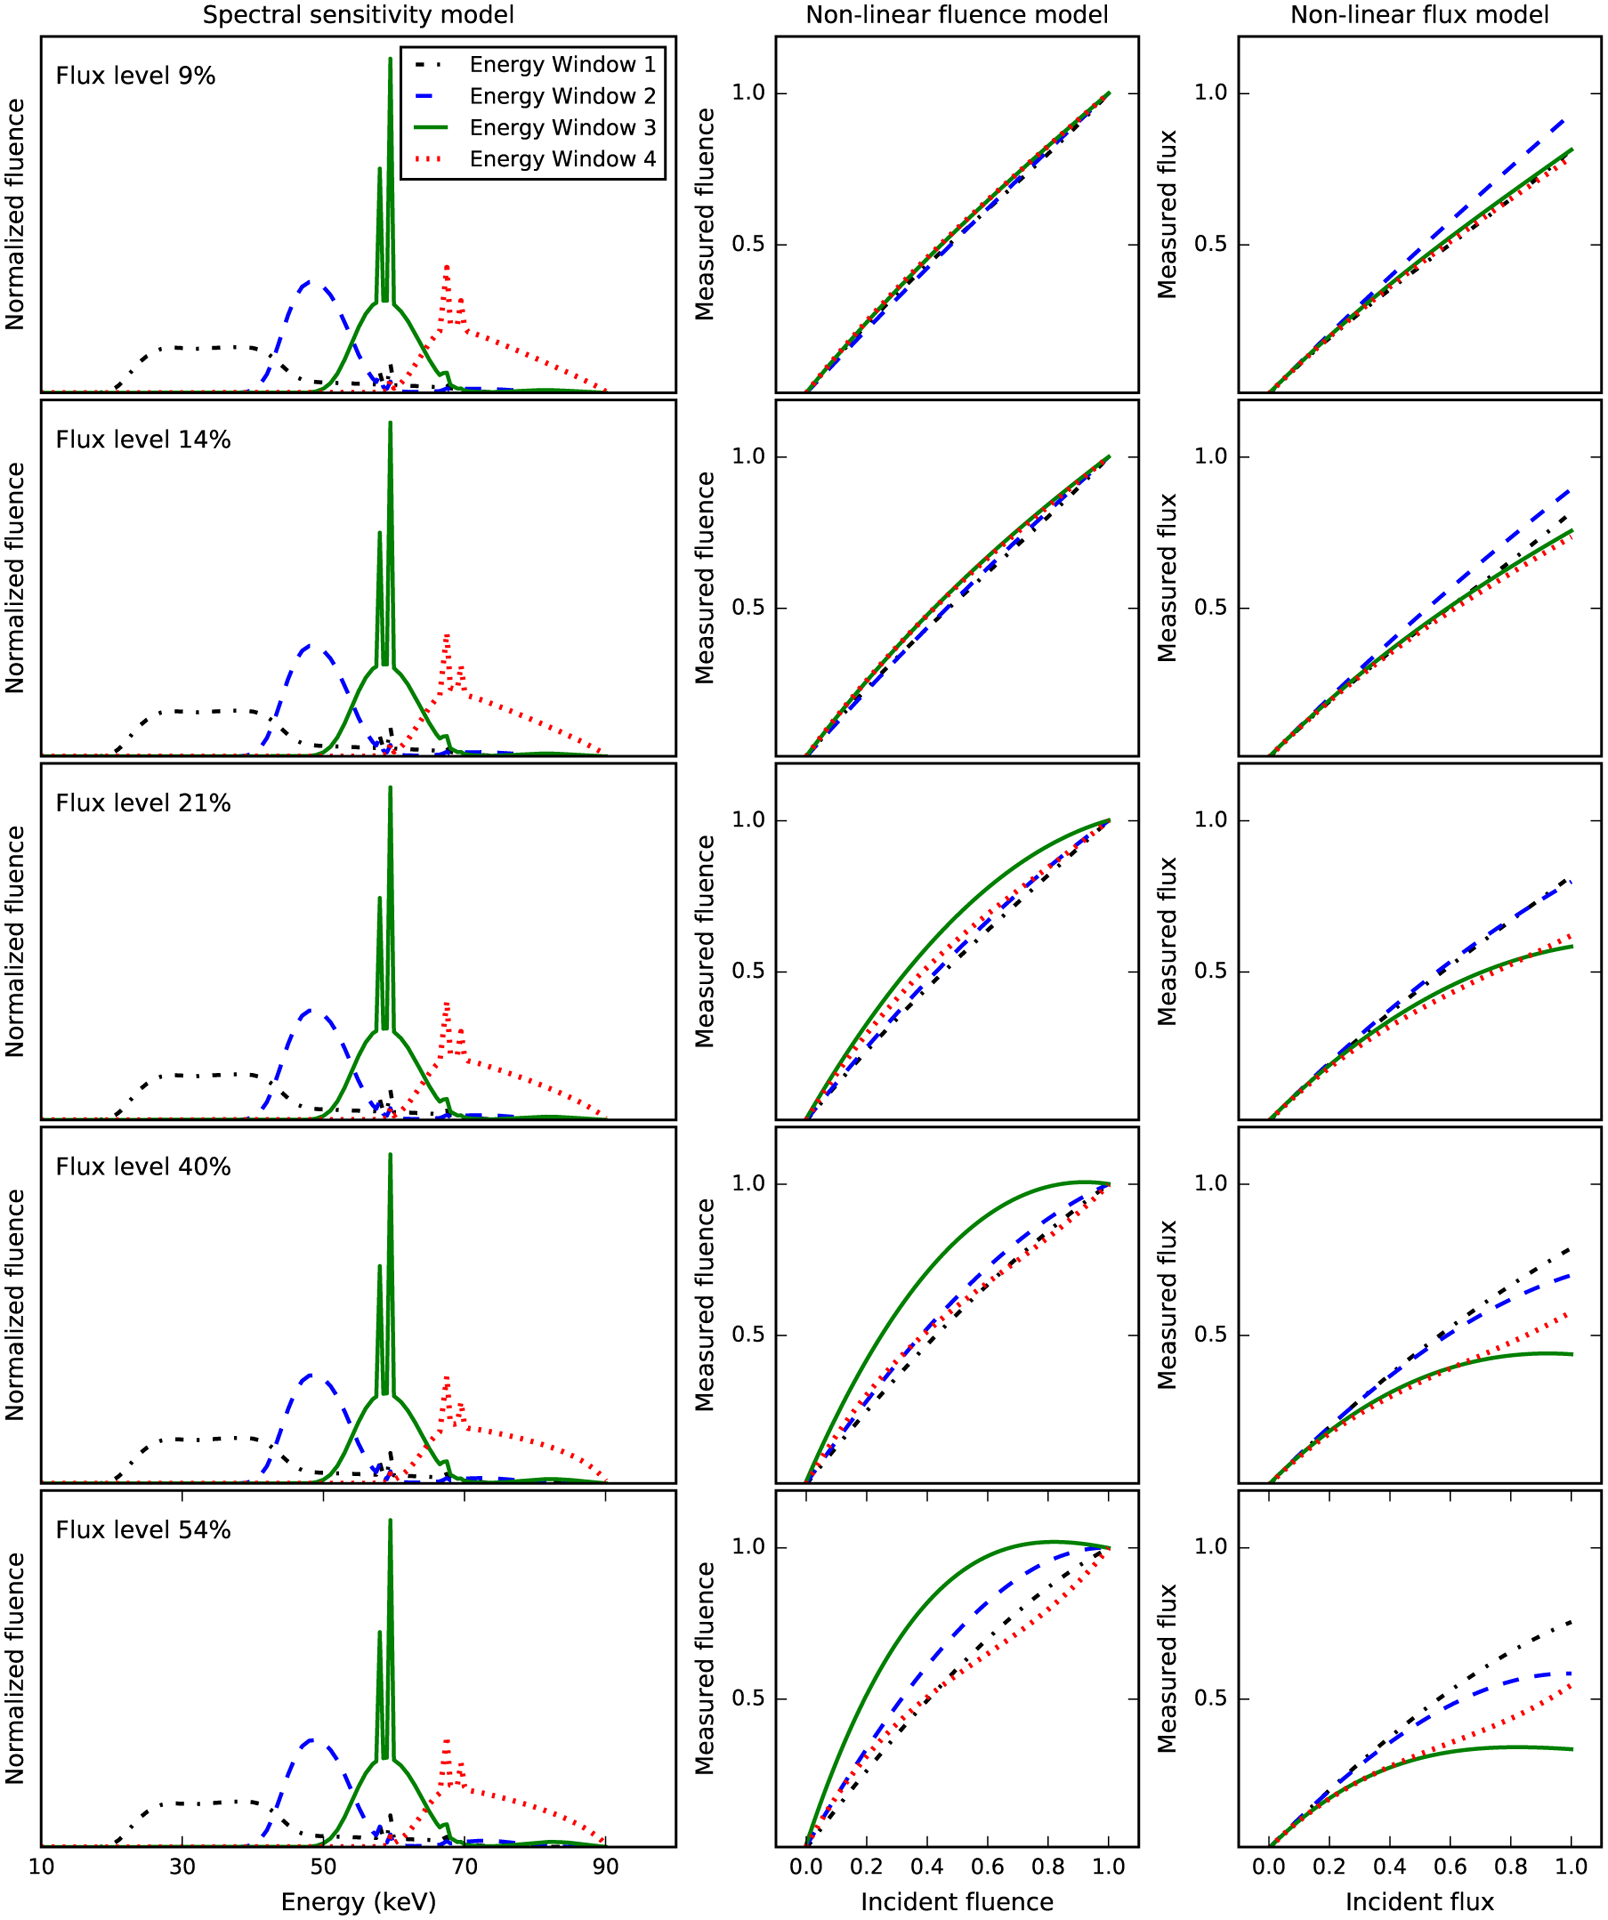
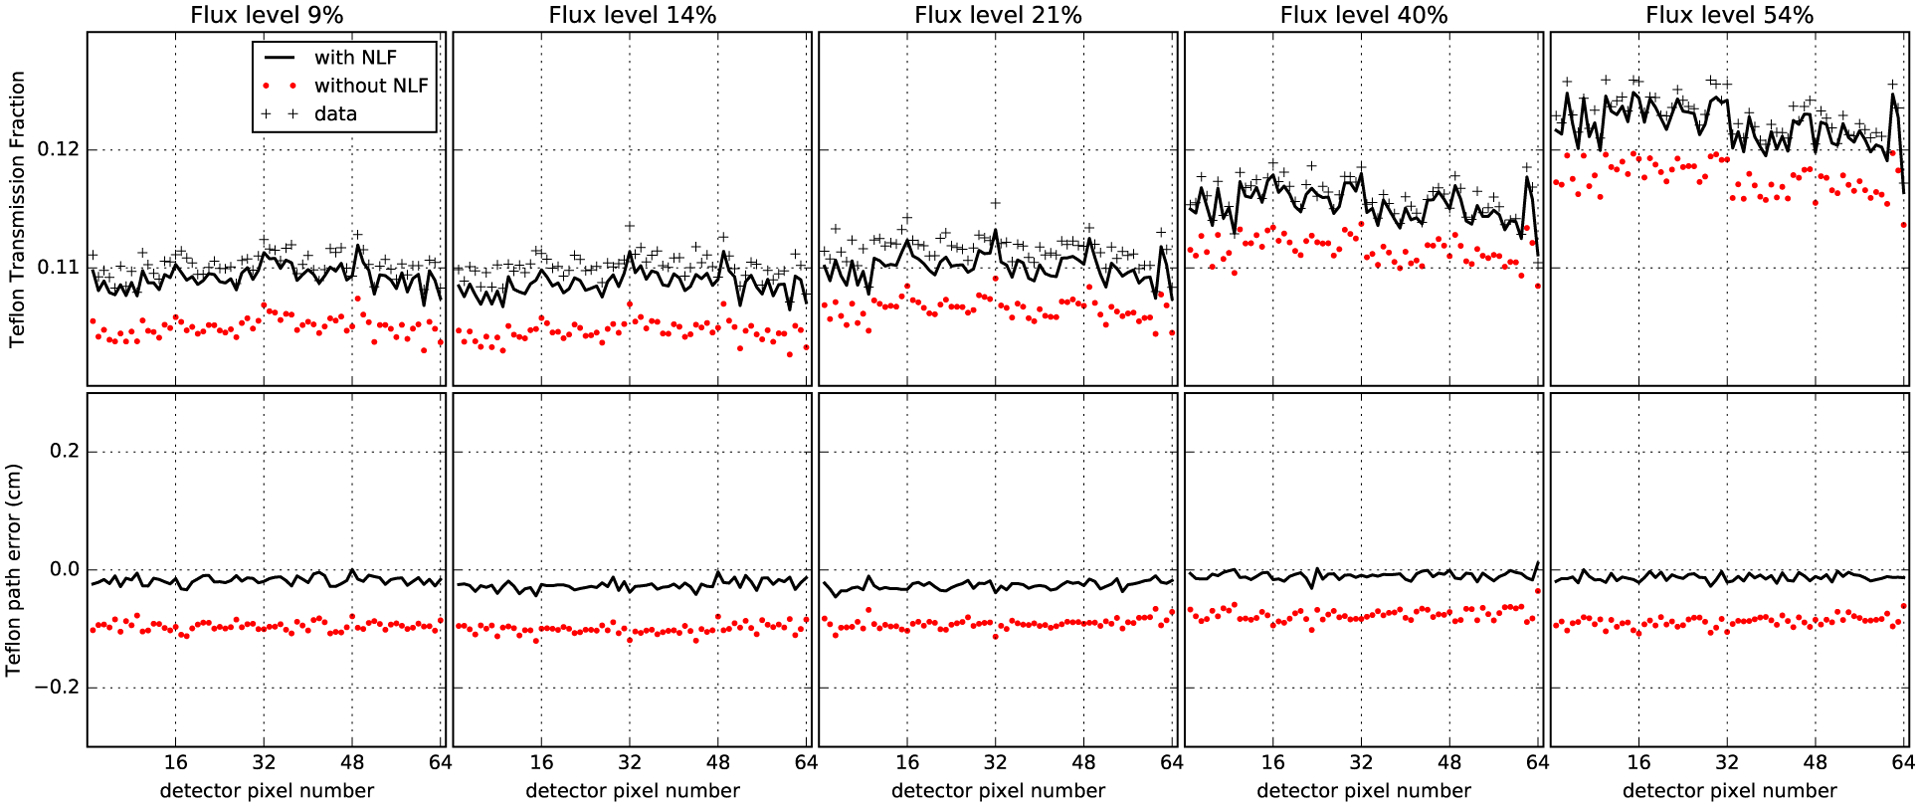
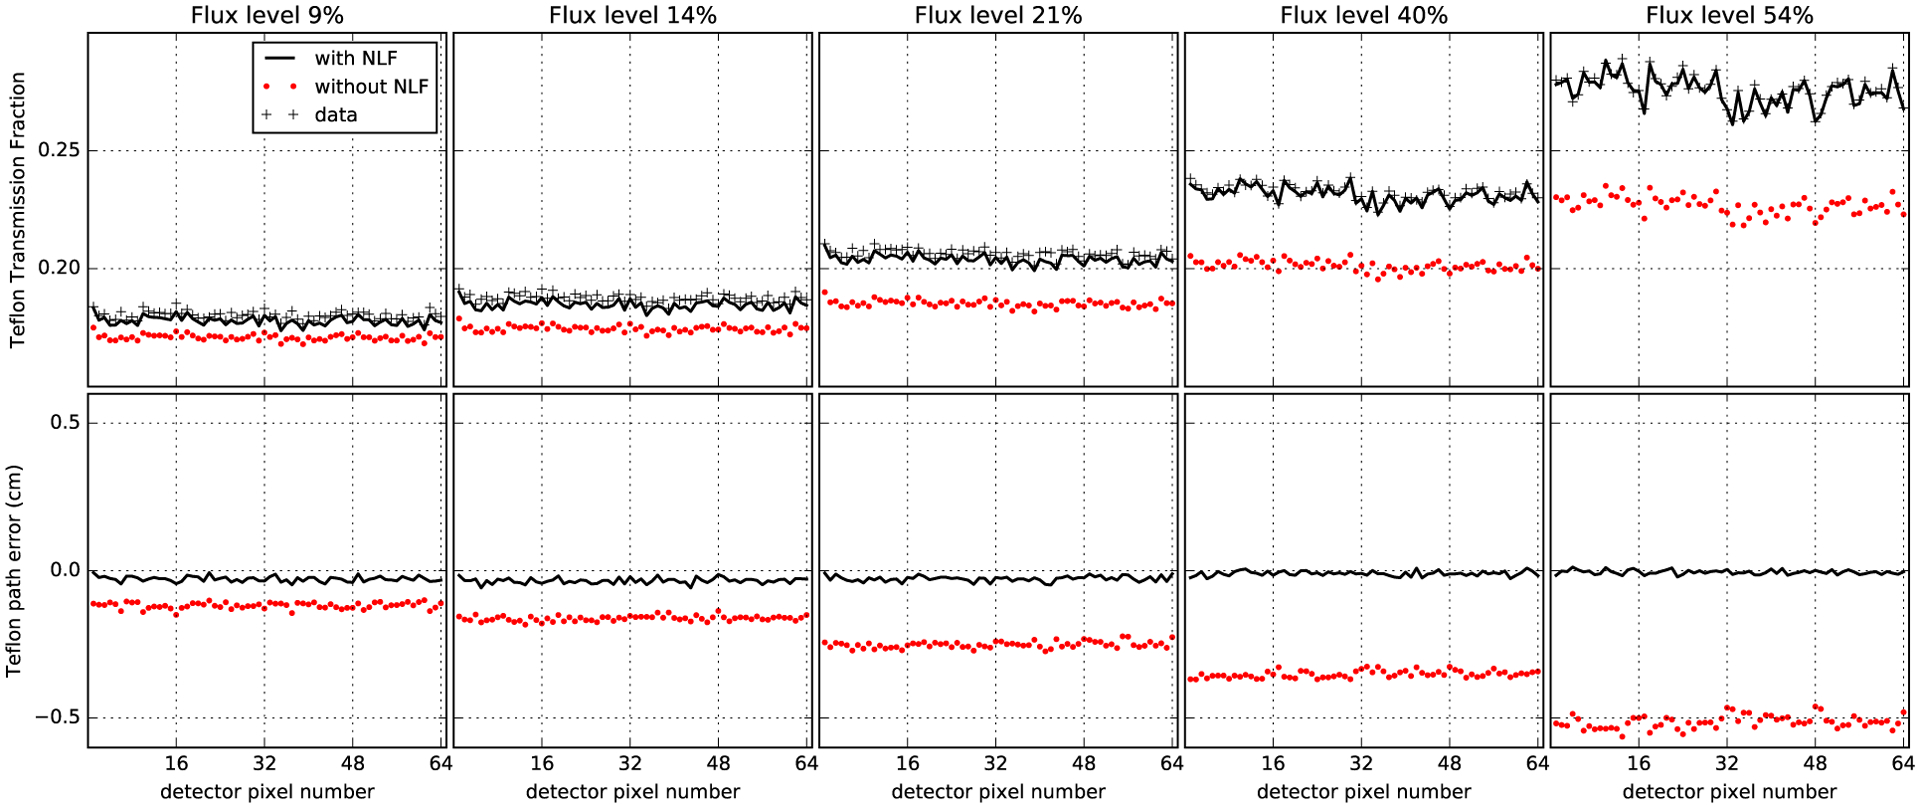
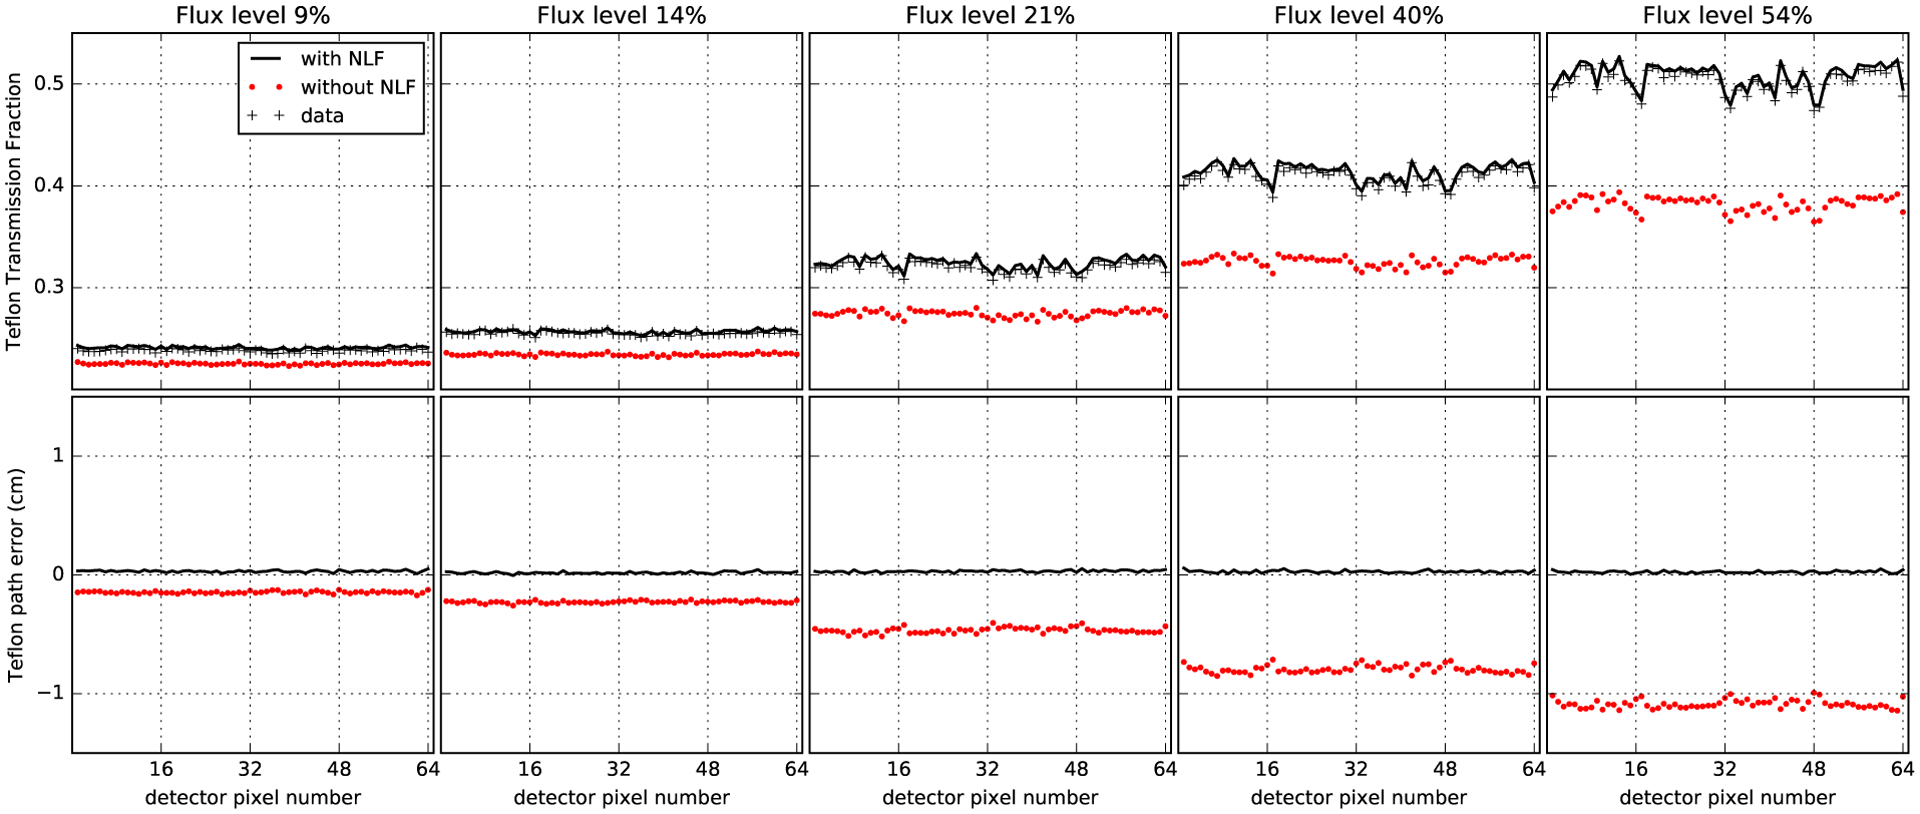
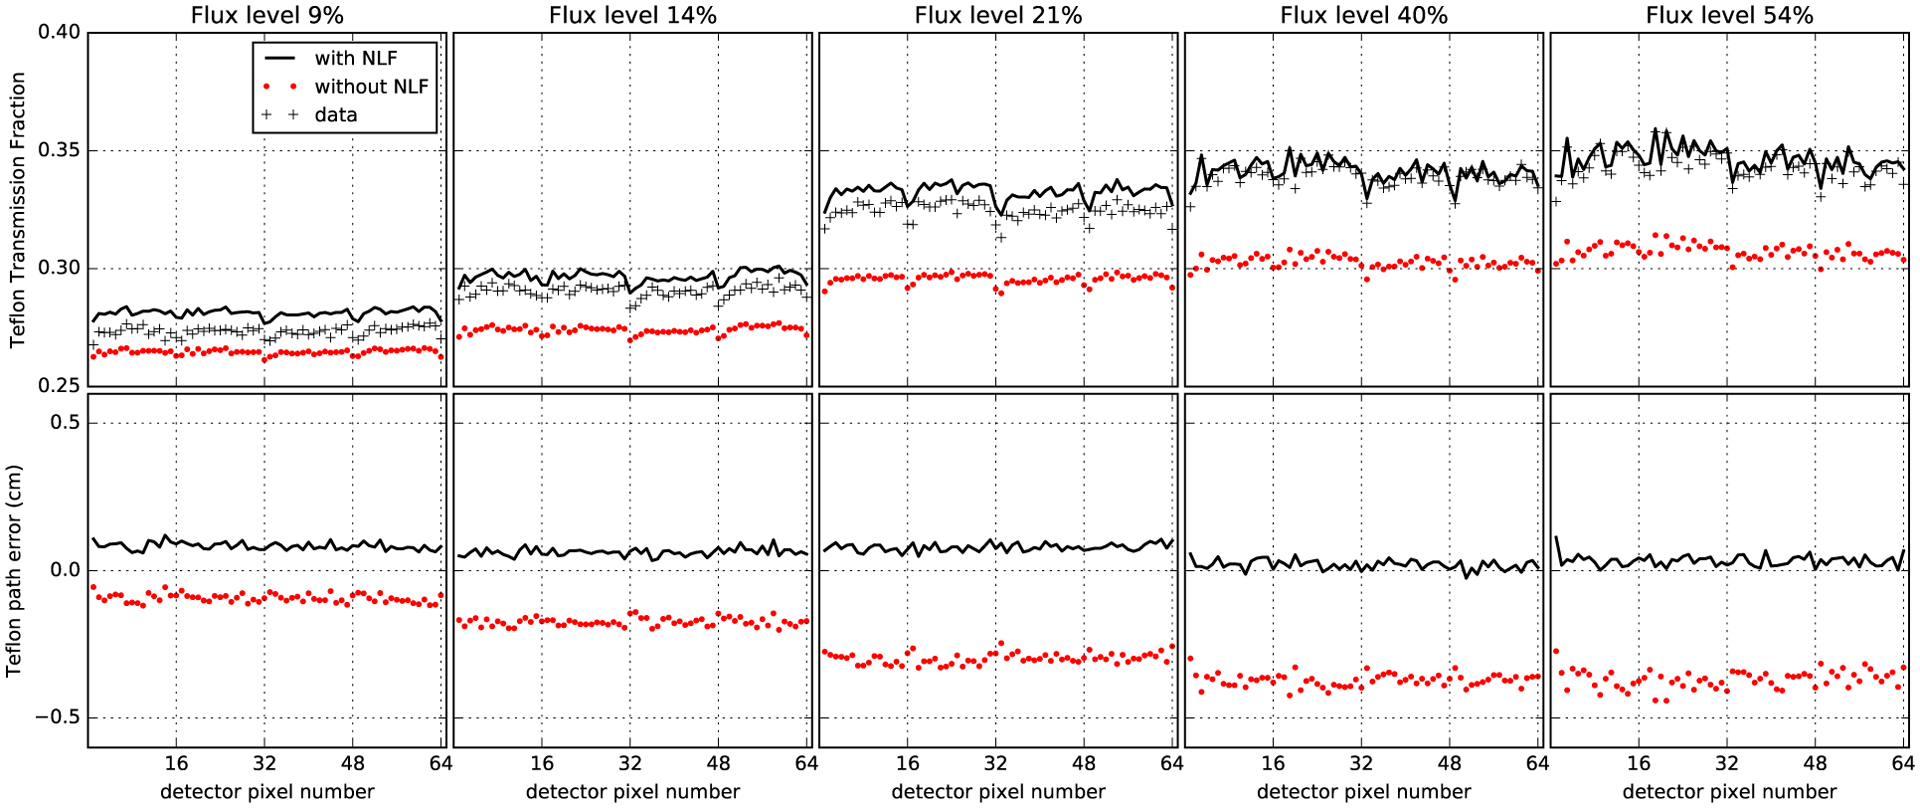
Methods: A calibration model for the spectral response and polynomial flux dependence is proposed, which incorporates prior x-ray source spectrum and PCD models and that has a small set of parameters for adjusting to the spectral CT system of interest. The model parameters are determined by fitting transmission data from a known object of known composition: a step-wedge phantom composed of different thicknesses of aluminum, a bone equivalent, and polymethyl methacrylate (PMMA), a soft-tissue equivalent. This fitting employs Tikhonov regularization, and the regularization strength and the polynomial order for the intensity modeling are determined by bias and variance analysis. The spectral calibration and nonlinear intensity correction is validated on transmission measurements through a third material, Teflon, at different x-ray photon flux levels.
Results: The nonlinear intensity dependence is determined to be accurately accounted for with a third-order polynomial. The calibrated spectral CT model accurately predicts Teflon transmission to within 1% for flux levels up to 50% of the detector maximum.
Conclusions: The proposed PCD calibration method enables accurate physical modeling necessary for quantitative imaging in spectral CT. Furthermore, the model applies to high flux settings so that acquisition times will not be limited by restricting the spectral CT system to low flux levels.
Keywords: calibration; photon-counting detectors; spectrum estimation.
© 2022 American Association of Physicists in Medicine.
Conflict of interest statement
Conflict of interest
The authors have no conflicts to disclose.
Figures
Similar articles
-
Research on accuracy of material identification based on photon counting spectral CT.J Xray Sci Technol. 2023;31(4):811-824. doi: 10.3233/XST-230054. J Xray Sci Technol. 2023. PMID: 37334644
-
Image-based spectral distortion correction for photon-counting x-ray detectors.Med Phys. 2012 Apr;39(4):1864-76. doi: 10.1118/1.3693056. Med Phys. 2012. PMID: 22482608 Free PMC article.
-
A cascaded model of spectral distortions due to spectral response effects and pulse pileup effects in a photon-counting x-ray detector for CT.Med Phys. 2014 Apr;41(4):041905. doi: 10.1118/1.4866890. Med Phys. 2014. PMID: 24694136 Free PMC article.
-
Energy-sensitive photon counting detector-based X-ray computed tomography.Radiol Phys Technol. 2017 Mar;10(1):8-22. doi: 10.1007/s12194-017-0390-9. Epub 2017 Jan 30. Radiol Phys Technol. 2017. PMID: 28138947 Review.
-
Spectral Photon-Counting CT Technology in Chest Imaging.J Clin Med. 2021 Dec 9;10(24):5757. doi: 10.3390/jcm10245757. J Clin Med. 2021. PMID: 34945053 Free PMC article. Review.
Cited by
-
Approaches, advantages, and challenges to photon counting detector and multi-energy CT.Abdom Radiol (NY). 2024 Sep;49(9):3251-3260. doi: 10.1007/s00261-024-04357-x. Epub 2024 May 15. Abdom Radiol (NY). 2024. PMID: 38744702 Review.
-
Framework for evaluating photon-counting detectors under pile-up conditions.J Med Imaging (Bellingham). 2024 Dec;11(Suppl 1):S12802. doi: 10.1117/1.JMI.11.S1.S12802. Epub 2024 May 24. J Med Imaging (Bellingham). 2024. PMID: 38799269 Free PMC article.
-
[A comprehensive review on photon-counting computed tomography: Principles, technical hurdles and analysis of clinical applications].Sheng Wu Yi Xue Gong Cheng Xue Za Zhi. 2023 Oct 25;40(5):1012-1018. doi: 10.7507/1001-5515.202305015. Sheng Wu Yi Xue Gong Cheng Xue Za Zhi. 2023. PMID: 37879932 Free PMC article. Review. Chinese.
-
Constrained one-step material decomposition reconstruction of head CT data from a silicon photon-counting prototype.Med Phys. 2023 Oct;50(10):6008-6021. doi: 10.1002/mp.16649. Epub 2023 Jul 31. Med Phys. 2023. PMID: 37523258 Free PMC article.
-
Dual energy CT reconstruction using the constrained one step spectral image reconstruction algorithm.Med Phys. 2024 Apr;51(4):2648-2664. doi: 10.1002/mp.16788. Epub 2023 Oct 14. Med Phys. 2024. PMID: 37837648 Free PMC article.
References
-
- Schlomka JP, Roessl E, Dorscheid R, Dill S, Martens G, Istel T, Bäumer C, Herrmann C, Steadman R, Zeitler GG, Livne A, and Proksa R, Experimental feasibility of multi-energy photon-counting K-edge imaging in pre-clinical computed tomography, Phys. Med. Biol 53, 4031–4048 (2008). - PubMed
MeSH terms
Substances
Grants and funding
LinkOut - more resources
Full Text Sources
