. 2022 Sep 1;135(17):jcs259778.
doi: 10.1242/jcs.259778. Epub 2022 Sep 7.

Proteasome granule formation is regulated through mitochondrial respiration and kinase signaling

Affiliations

Proteasome granule formation is regulated through mitochondrial respiration and kinase signaling

Kenrick A Waite et al. J Cell Sci. .

Abstract

In the yeast Saccharomyces cerevisiae, proteasomes are enriched in cell nuclei, in which they execute important cellular functions. Nutrient stress can change this localization, indicating that proteasomes respond to the metabolic state of the cell. However, the signals that connect these processes remain poorly understood. Carbon starvation triggers a reversible translocation of proteasomes to cytosolic condensates known as proteasome storage granules. Surprisingly, we observed strongly reduced levels of proteasome granules when cells had active cellular respiration prior to starvation. This suggests that the mitochondrial activity of cells is a determining factor in the response of proteasomes to carbon starvation. Consistent with this, upon inhibition of mitochondrial function, we observed that proteasomes relocalize to granules. These links between proteasomes and metabolism involve specific signaling pathways, as we identified a mitogen-activated protein kinase (MAPK) cascade that is critical to the formation of proteasome granules after respiratory growth but not following glycolytic growth. Furthermore, the yeast homolog of AMP kinase, Snf1, is important for proteasome granule formation induced by mitochondrial inhibitors, but it is dispensable for granule formation following carbon starvation. We propose a model in which mitochondrial activity promotes nuclear localization of the proteasome. This article has an associated First Person interview with the first author of the paper.

Keywords: AMP kinase; Autophagy; MAP kinases; Mitochondrial inhibition; Mitochondrial respiration; Proteaphagy; Proteasome; Proteasome storage granules.


Conflict of interest statement

Competing interests The authors declare no competing or financial interests.

Figures

Fig. 1.
Fig. 1.
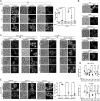
Proteasome granule formation is restricted during respiratory growth. (A) Rpn1–GFP expressing cells were grown for 4 h in rich media containing dextrose (ypd), raffinose (ypr) or glycerol (ypg), followed by growth in SD media lacking carbon. Two ODs of cells (i.e. the cells equivalent to 2 ml of culture with an OD600 of 1) were harvested at the indicated times and lysed as described in the Materials and Methods. Lysates were separated by SDS-PAGE and immunoblotted for GFP and Pgk1. Data presented are the average of three independent experiments. Quantifications show the percentage of free GFP relative to the total amount of GFP (i.e. unprocessed and free GFP) observed following nitrogen (‘−N’) or carbon (‘−C’) starvation. Two-tailed unpaired t-test was used to determine significance. (B) Cells grown as in A were imaged at log phase following 24 h carbon starvation. Quantification shows the percentage of cells that induced proteasome granules and the percentage of those cells that formed two or more granules. Data presented are the average of three independent experiments with n>100 for each. Two-tailed unpaired t-test was used to determine significance. (C) Rpn1–GFP expressing cells were grown for 3 days in the indicated media then imaged microscopically (top left). Quantification (bottom left) shows the percentage of cells with granules from three independent experiments. Statistical significance was determined by two-tailed paired t-test (left) and n>100 for each datapoint. Two ODs of cells were collected from cultures as in the left panel and lysed for immunoblotting against GFP or Pgk1 (top right). Data presented are representative of two independent experiments. Quantification (bottom right) shows the percentage of free GFP, indicating proteasome autophagy, relative to total GFP. Significance was determined using a two-tailed unpaired t-test. (D) Rpn1–mCherry (R1–mCherry);GFP–Atg8-expressing cells were grown in rich dextrose (ypd), raffinose (ypr) or glycerol (ypg) media followed by a change to carbon starvation media. Microscopy was performed at the indicated times and quantifications show the percentage of cells with granules after 24 h. Unpaired two-tailed t-test was used to determine significance. n>100 for each data point. All error bars represent s.e.m. ns, P>0.05, *P<0.05, **P<0.005, ***P<0.0005. Scale bars: 5 µm.
Fig. 2.
Fig. 2.
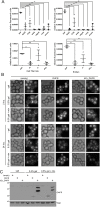
Mitochondrial inhibition induces proteasome granule formation. (A) Rpn1–mCherry-expressing yeast were grown in the indicated rich media for 4 h, washed and switched to phosphate starvation media (‘−PO4’). Microscopy was performed at the indicated times. Quantification shows the percentage of cells that formed granules at 2 and 3 days of phosphate starvation. Two tailed unpaired t-test was used to determine significance with n>100 for each datapoint. (B) Rpn1–GFP-expressing cells were grown in rich media containing dextrose and treated with mitochondrial inhibitors as described in the Materials and Methods. Microscopy was performed 24 h after inhibitor addition. Data are representative of three independent experiments. (C) Rpn1–GFP- and α1–GFP-expressing cells treated for 24 h with mitochondrial inhibitors were washed and incubated in drug-free media for 10 min. Data are representative of three independent experiments. (D) Rpn1–GFP- or α1–GFP-expressing cells were grown in media containing dextrose (‘D’) or raffinose (‘R’) for 4 h, treated with mitochondrial inhibitors, and incubated for 24 h. Microscopy was performed and quantifications show the percentages of cells with granules. Two-tailed unpaired t-tests were used to determine significance with n>100 for each datapoint. (E) Rpn1–GFP-expressing cells were grown in media containing dextrose, raffinose or glycerol for 4 h, transferred to sealed culture tubes, incubated for 24 h, and imaged. Quantifications show the percentages of cells that formed proteasome granules, and two-tailed unpaired t-test was used to determine significance. All error bars represent s.e.m. ns, P>0.05, *P<0.05, **P<0.005, ***P<0.0005. Scale bars: 5 µm.
Fig. 3.
Fig. 3.
Reduced ATP levels or defects in mitochondrial protein import are not sufficient to drive proteasome granule formation. (A) ATP measurements were carried out following mitochondrial inhibition (upper panels) or nutrient starvation (lower panels), as described in the Materials and Methods. Quantifications show relative ATP compared to untreated controls averaged from three independent experiments. Error bars represent s.e.m. One-tailed paired t-tests were used to evaluate significance. (B) Rpn1–GFP-expressing yeast expressing an empty vector or inducible cytosolic DHFR or mitochondria-targeted DHFR (b2Δ_DHFR) were grown for 4 h in SD media without tryptophan containing 2% lactate. Cells were then either left uninduced or induced with 0.5% galactose (gal) with or without methotrexate (mtx) to promote tighter folding of DHFR. Microscopy was performed 24 h after induction. Data are representative of three independent experiments. Scale bars: 5 µm. (C) Two ODs of cells corresponding to conditions in B were collected and lysed as described. Immunoblotting for DHFR and Pgk1 were performed. Data are representative of three independent experiments. ns, P>0.05, *P<0.05, **P<0.005, ***P<0.0005.
Fig. 4.
Fig. 4.
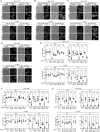
MAPK signaling is required for proteasome granule formation. (A–D) WT and mpk1Δ yeast expressing Rpn1–GFP or α1–GFP were grown to log phase in rich media containing dextrose (ypd) or raffinose (ypr). Next, cells were starved for carbon or treated with oligomycin A, antimycin A or sodium azide for 24 h and imaged. Scale bars: 5 µm. (E) Quantification of the percentage of granule formation from yeast cultured and treated as in A–D or with CCCP treatment. Statistical significance was determined using two-tailed unpaired t-tests. Three or more independent experiments were quantified with n>100 for each datapoint. (F) WT and the MKK1/MKK2 double deletion mutant (Δ) expressing Rpn1–GFP or α1–GFP were grown in dextrose or raffinose for 4 h, starved for carbon or treated with mitochondrial inhibitors as above. Graphs show the percentage of cells with granules after 24 h with significance determined by two-tailed unpaired t-tests. At least three independent experiments were quantified with n>100 for each datapoint. (G) WT and bck1Δ yeast expressing Rpn1–GFP or α1–GFP were grown to log phase in rich media containing dextrose or raffinose, and starved for carbon or treated with mitochondrial inhibitors as above. Quantifications show the percentage of cells that formed granules after 24 h. Two-tailed unpaired t-tests were used to determine significance. At least three independent experiments were quantified with n>100 for each datapoint. All error bars represent s.e.m. ns, P>0.05, *P<0.05, **P<0.005, ***P<0.0005.
Fig. 5.
Fig. 5.
Snf1 is required for proteasome granule formation upon mitochondrial inhibition. (A) WT and snf1Δ yeast expressing Rpn1–GFP or α1–GFP were grown for 3 days in rich media containing dextrose (‘D’), raffinose (‘R’) or glycerol (‘G’). Cells were harvested and lysed as described in the Materials and Methods. Immunoblotting for GFP and Pgk1 was performed. Data are representative of two independent experiments. (B) Cells from A were imaged microscopically to observe proteasome localization. Data are representative of two independent experiments. (C) WT and snf1Δ yeast expressing Rpn1–GFP or α1–GFP were grown in ypd medium to log phase and/or treated with mitochondrial inhibitors for 24 h. Microscopy was performed and quantifications show the percentage of cells that form granules following mitochondrial inhibition in the SNF1-deleted mutant compared to WT. Significance was determined using two-tailed unpaired t-tests. At least three independent experiments with n>100 for each datapoint, were used for quantification. Error bars represent s.e.m. *P<0.05, **P<0.005, ***P<0.0005. Scale bars: 5 µm.
Fig. 6.
Fig. 6.
Model for PSG formation following glycolytic or respiratory growth. Switching from glycolytic growth media (i.e. with repressed mitochondrial respiration) to carbon starvation results in the formation of multiple proteasome granules per cell and more proteasome granules compared to cells starved after growth in respiratory media. The kinase Snf1 is required for proteasome granule formation upon mitochondrial inhibition but not carbon starvation. The cell-integrity MAPK cascade (from Wsc1 to Mpk1) is required from proteasome granule formation following respiratory but not glycolytic growth.

Similar articles

Cited by

References

    1. Adachi, A., Koizumi, M. and Ohsumi, Y. (2017). Autophagy induction under carbon starvation conditions is negatively regulated by carbon catabolite repression. J. Biol. Chem. 292, 19905-19918. 10.1074/jbc.M117.817510 - DOI - PMC - PubMed
    1. Backhaus, K., Rippert, D., Heilmann, C. J., Sorgo, A. G., De Koster, C. G., Klis, F. M., Rodicio, R. and Heinisch, J. J. (2013). Mutations in SNF1 complex genes affect yeast cell wall strength. Eur. J. Cell Biol. 92, 383-395. 10.1016/j.ejcb.2014.01.001 - DOI - PubMed
    1. Bao, W., Gu, Y., Ta, L. A., Wang, K. and Xu, Z. (2016). Induction of autophagy by the MG-132 proteasome inhibitor is associated with endoplasmic reticulum stress in MCF-7 cells. Mol. Med. Rep. 13, 796-804. 10.3892/mmr.2015.4599 - DOI - PubMed
    1. Berry, B. J., Trewin, A. J., Amitrano, A. M., Kim, M. and Wojtovich, A. P. (2018). Use the protonmotive force: mitochondrial uncoupling and reactive oxygen species. J. Mol. Biol. 430:3873-3891. 10.1016/j.jmb.2018.03.025 - DOI - PMC - PubMed
    1. Boos, F., KräMer, L., Groh, C., Jung, F., Haberkant, P., Stein, F., Wollweber, F., Gackstatter, A., Zöller, E., Van Der Laan, M.et al. . (2019). Mitochondrial protein-induced stress triggers a global adaptive transcriptional programme. Nat. Cell Biol. 21:442-451. 10.1038/s41556-019-0294-5 - DOI - PubMed

Publication types