. 2022 Oct 26;13(5):e0043122.
doi: 10.1128/mbio.00431-22. Epub 2022 Aug 17.

Emergence of Compensatory Mutations Reveals the Importance of Electrostatic Interactions between HIV-1 Integrase and Genomic RNA

Affiliations

Emergence of Compensatory Mutations Reveals the Importance of Electrostatic Interactions between HIV-1 Integrase and Genomic RNA

Christian Shema Mugisha et al. mBio. .

Abstract

HIV-1 integrase (IN) has a noncatalytic function in virion maturation through its binding to the viral RNA genome (gRNA). Class II IN substitutions inhibit IN-gRNA binding and result in the formation of virions with aberrant morphologies marked by mislocalization of the gRNA between the capsid lattice and the lipid envelope. These viruses are noninfectious due to a block at an early reverse transcription stage in target cells. HIV-1 IN utilizes basic residues within its C-terminal domain (CTD) to bind to the gRNA; however, the molecular nature of how these residues mediate gRNA binding and whether other regions of IN are involved remain unknown. To address this, we have isolated compensatory substitutions in the background of a class II IN mutant virus bearing R269A/K273A substitutions within the IN-CTD. We found that the nearby D256N and D270N compensatory substitutions restored the ability of IN to bind gRNA and led to the formation of mature infectious virions. Reinstating the local positive charge of the IN-CTD through individual D256R, D256K, D278R, and D279R substitutions was sufficient to specifically restore IN-gRNA binding and reverse transcription for the IN R269A/K273A as well as the IN R262A/R263A class II mutants. Structural modeling suggested that compensatory substitutions in the D256 residue created an additional interaction interface for gRNA binding, whereas other substitutions acted locally within the unstructured C-terminal tail of IN. Taken together, our findings highlight the essential role of CTD in gRNA binding and reveal the importance of pliable electrostatic interactions between the IN-CTD and the gRNA. IMPORTANCE In addition to its catalytic function, HIV-1 integrase (IN) binds to the viral RNA genome (gRNA) through positively charged residues (i.e., R262, R263, R269, K273) within its C-terminal domain (CTD) and regulates proper virion maturation. Mutation of these residues results in the formation of morphologically aberrant viruses blocked at an early reverse transcription stage in cells. Here we show that compensatory substitutions in nearby negatively charged aspartic acid residues (i.e., D256N, D270N) restore the ability of IN to bind gRNA for these mutant viruses and result in the formation of accurately matured infectious virions. Similarly, individual charge reversal substitutions at D256 as well as other nearby positions (i.e., D278, D279) are all sufficient to enable the respective IN mutants to bind gRNA, and subsequently restore reverse transcription and virion infectivity. Taken together, our findings reveal the importance of highly pliable electrostatic interactions in IN-gRNA binding.

Keywords: HIV-1; integrase; protein-RNA interactions; virion maturation; virology.


Conflict of interest statement

The authors declare no conflict of interest.

Figures

FIG 1
FIG 1
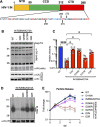
D256N and D270N compensatory substitutions in HIV-1 IN suppress the replication defect of the HIV-1NL4-3 IN (R269A/K273A) class II mutant virus. (A) MT4-LTR-GFP indicator cells were infected with HIV-1NL4-3 at an MOI of 2 i.u./cell or an equivalent particle number of the HIV-1NL4-3 IN (R269A/K273A) class II IN mutant virus (based on reverse transcriptase [RT] activity) as detailed in Materials and Methods. HIV-1NL4-3 IN (R269A/K273A) viruses were serially passaged for three rounds until the emergence of compensatory mutations that allowed virus replication with WT kinetics. The graphs represent the percentage of GFP positive cells as assessed by flow cytometry over three passages at the indicated days postinfection (dpi). (B) HIV-1 genomic RNA was isolated from viruses collected from cell culture supernatants over the three passages (i.e., P1, P2, P3) and at the indicated days postinfection (i.e., D29, D40, etc.) as described in Materials and Methods. Heatmap shows the percentage of IN D256N and D270N substitutions at the indicated passages and days postinfection (dpi) as assessed by whole-genome deep sequencing. (C) HEK293T cells were transfected with full-length pNL4-3 expression plasmids carrying pol mutations coding for the IN D256N, D270N, and D256N/D270N (D2N) substitutions introduced on the WT IN and IN R269A/K273A backbones. Cell lysates and cell culture supernatants containing virions were collected 2 days posttransfection and analyzed by immunoblotting for CA and IN. The image is representative of five independent experiments. See Fig. S1 for quantitative analysis of immunoblots. (D) HEK293T cells were transfected as in panel C, and cell culture supernatants containing viruses were titered on TZM-bl indicator cells, whereby virus replication was limited to a single cycle by addition of dextran sulfate (50 μg/mL). The titers were normalized relative to particle numbers as assessed by an RT activity assay and are presented relative to WT (set to 1). Also see Fig. S1 for titer and RT activity values prior to normalization. The columns represent the average of 5–6 independent biological replicates, and the error bars represent standard error of the mean (SEM) (****, P < 0.0001; **, P < 0.01; *, P < 0.05, by one-way ANOVA multiple comparison test with Dunnett’s correction).
FIG 2
FIG 2
D256N and D270N substitutions restore IN-gRNA binding and accurate virion maturation for the HIV-1NL4-3 IN (R269A/K273A) class II mutant virus. (A) Autoradiogram of IN-RNA adducts immunoprecipitated from virions bearing the indicated substitutions in IN. Immunoblots below show immunoprecipitated (IP) IN or CA protein in lysates prior to immunoprecipitation. Data shown are representative of three independent experiments. See also Fig. S2 for quantitative analysis of autoradiographs. (B) Examination of virion maturation in WT and IN mutant viruses by thin section electron microscopy (TEM). Data show quantification of virion morphologies across 100 particles for each sample and replicate experiment. Data show the average of two independent biological replicates, and error bars represent the SEM (***, P < 0.001; **, P < 0.01; ns = not significant, by one-way ANOVA multiple comparison test with Dunnett’s correction).
FIG 3
FIG 3
Restoring the local net charge of IN-CTD restores RNA binding and infectivity for the IN R269A/K273A class II mutant. (A) Schematic diagram of IN and sequence of CTD residues with basic and acidic amino acids highlighted in blue and red, respectively. (B, C) HEK293T cells were transfected with full-length proviral WT HIV-1NL4-3 expression plasmid or its derivatives carrying pol mutations encoding for D2N, D256R, D270R, and D256R/D270R (D2R) IN substitutions on the backbone of HIV-1NL4-3 IN (R269A/K273A). (B) Cell lysates and purified virions harvested 2 days posttransfection were analyzed by immunoblotting for CA and IN. Representative image from five independent experiments is shown. See also Fig. S4A–E for quantitative analysis of immunoblots. (C) Cell culture supernatants containing viruses were titered on TZM-bl indicator cells, whereby virus replication was limited to a single cycle by addition of dextran sulfate (50 μg/mL). The titers were normalized relative to particle numbers as assessed by an RT activity assay and are presented relative to WT (set to 1). Also see Fig. S4F, G for titer and RT activity values prior to normalization. The columns represent the average of six independent experiments, and the error bars represent SEM (****, P < 0.0001; *, P < 0.05, by one-way ANOVA multiple comparison test with Dunnett’s correction). (D) Autoradiogram of IN-RNA adducts immunoprecipitated from HIV-1NL4-3 virus particles bearing WT IN or the indicated IN mutants. Immunoblot below shows immunoprecipitated (IP) IN protein. Results are representative of three independent replicates. See Fig. S4H for quantitative analysis of autoradiographs. (E) MT4 T-cells were infected with HIV-1NL4-3 IN (D116N) viruses that were transcomplemented with the indicated Vpr-IN mutant proteins as described in Materials and Methods. Virion release was assessed by RT activity assays over the course of 5 days postinfection. y axis indicates fold increase in RT activity over day 0. Data are from 3 independent replicates; error bars show the SEM.
FIG 4
FIG 4
D256R and D256K substitutions restore IN-RNA binding and infectivity for the HIV-1NL4-3 IN (R262A/R263A) class II mutant virus. (A–E) HEK293T cells were transfected with proviral HIV-1NL4-3 expression plasmids carrying pol mutations for the indicated IN substitutions on WT IN or IN R262A/R263A backbones. (A, C) Cell lysates and purified virions collected 2 days posttransfection were analyzed by immunoblotting for CA and IN. See also Fig. S5 for quantitative analyses of immunoblots. (B, D) Cell culture supernatants containing viruses were titered on TZM-bl indicator cells, whereby virus replication was limited to a single cycle by addition of dextran sulfate (50 μg/mL). The titers were normalized relative to particle numbers as assessed by an RT activity assay and are presented relative to WT (set to 1). See also Fig. S5F, L, M for titer and RT activity values prior to normalization. The columns represent the average of four-to-six independent experiments, and the error bars represent SEM (**, P < 0.01; *, P < 0.05; ns = not significant by one-way ANOVA multiple comparison test with Dunnett’s correction). (E) Autoradiogram of IN-RNA adducts immunoprecipitated from WT or IN mutant HIV-1NL4-3 virions. The amount of immunoprecipitated IN was assessed by the immunoblot shown below. Immunoblots and CLIP autoradiographs are representative of three independent replicates. See Fig. S5N for quantitative analysis of autoradiographs. (F) MT4 T-cells were infected with HIV-1NL4-3 IN (D116N) viruses that were transcomplemented with the indicated Vpr-IN mutant proteins as described in Materials and Methods. Virion release was assessed by RT activity assays over the course of 5 days postinfection. y axis indicates fold increase in RT activity over day 0. Data are from 3 independent replicates; error bars show the SEM.
FIG 5
FIG 5
D279R substitution increases and D278R and D2R’ substitutions restore IN-RNA binding and infectivity for the HIV-1NL4-3 IN (R269A/K273A) virus. HEK293T cells were transfected with full-length pNL4-3 expression plasmids carrying mutations coding for the IN D278R, D279R, D278R/D279R (D2R’), D256I, and D256I/D270I (D2I) substitutions introduced on the IN R269A/K273A backbone. (A) Cell culture supernatants containing viruses were titered on TZM-bl indicator cells, whereby virus replication was limited to a single cycle by addition of dextran sulfate (50 μg/mL). The titers were normalized relative to particle numbers by an RT activity assay and are presented relative to WT (set to 1). The columns represent the average of 4 independent biological replicates, and the error bars represent standard error of the mean (SEM) (*, P < 0.05, by one-way ANOVA multiple comparison test with Dunnett’s correction). (B) Cell lysates and purified virions collected 2 days posttransfection were analyzed by immunoblotting for CA and IN. The image is representative of four independent experiments. (C) IN-RNA adducts immunoprecipitated from WT or IN mutant HIV-1NL4-3 virions per CLIP protocol were analyzed by autoradiography. Graph shows the quantification of IN-RNA adducts from three independent biological replicates; error bars show the SEM.
FIG 6
FIG 6
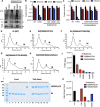
Assessing multimerization properties of IN in mutant viruses. (A) Purified WT or IN mutant HIV-1NL4-3 virions were treated with 1 mM EGS, and virus lysates analyzed by immunoblotting using antibodies against IN following separation on 3–6% Tris-acetate gels as detailed in Materials and Methods. The position of monomers (M), dimers (D), and tetramers (T) are indicated by arrows in a representative Western blot. (B, C) Quantification of IN multimerization in virions from experiments conducted as in A. Error bars show the SEM from three independent experiments. (D–H) Representative SEC traces for indicated recombinant IN proteins at 20 μM. The x axis indicates elution volume (mL) and y axis indicates the intensity of absorbance (mAU). Tetramers (T), dimers (D), and monomers (M) are indicated. Representative chromatograms from two independent analyses are shown. (I) Affinity-pulldown assays showing binding of WT and mutant INs to LEDGF/p75. Lane 1: molecular weight marker; Lanes 2–8: loads of 6xHis-tagged WT IN, IN(R269A/K273A), IN(R269A/K273A/D256N/D270N), IN(R269A/K273A/D256R), IN(D256R/R262A/R263A), IN(D256R/R262A/R263A), and FLAG-tagged LEDGF/p75; Lanes 9–15: affinity pull-down using Ni beads of LEDGF/p75 with buffer only (control), 6xHis-tagged WT IN, IN(R269A/K273A), IN(R269A/K273A/D256N/D270N), IN(R269A/K273A/D256R), IN(D256R/R262A/R263A), and IN(D256R/R262A/R263A). (J) Catalytic activities of mutant IN molecules in the presence of LEDGF/p75 monitored by HTRF based assay. The bars represent the ratio of emission signal at 665 nm over that of 615 nm, which was then multiplied by a factor of 10,000. The error bars indicate the standard error of the mean from triplicate experiments. (K) Summary of mutant INs bridging TAR RNA compared to WT IN. Alpha screen counts at 320 nM for each protein is shown. The graphs show average values of three independent experiments, and the error bars indicate standard deviation.
FIG 7
FIG 7
Characterization of IN mutations present in latently infected CD4+ T cells. (A) Frequency of IN substitutions at amino acids 224, 230, 246, and 272 derived from HIV-1 sequences from latently infected CD4+ T-cells is shown. (B) HEK293T cells were transfected with proviral HIV-1NL4-3 expression plasmids carrying the R224Q, S230N, E246K, and G272R IN mutations. Cell lysates and virions were purified 2 days posttransfection and analyzed by immunoblotting for CA and IN. The image is representative of two independent experiments. (C) WT or IN mutant HIV-1L4-3 viruses in cell culture supernatants were titered on TZM-bl indicator cells. The titers are presented relative to WT (set to 1). The columns represent the average of three independent experiments, and the error bars represent SEM (*, P < 0.05, by one-way ANOVA multiple comparison test with Dunnett’s correction). (D) Autoradiogram of IN-RNA adducts immunoprecipitated from virions bearing the indicated substitutions in IN. Immunoblots below show the amount of immunoprecipitated IN.

Similar articles

Cited by

References

    1. Engelman AN. 2019. Multifaceted HIV integrase functionalities and therapeutic strategies for their inhibition. J Biol Chem 294:15137–15157. doi:10.1074/jbc.REV119.006901. - DOI - PMC - PubMed
    1. Hazuda DJ, Felock P, Witmer M, Wolfe A, Stillmock K, Grobler JA, Espeseth A, Gabryelski L, Schleif W, Blau C, Miller MD. 2000. Inhibitors of strand transfer that prevent integration and inhibit HIV-1 replication in cells. Science 287:646–650. doi:10.1126/science.287.5453.646. - DOI - PubMed
    1. Summa V, Petrocchi A, Bonelli F, Crescenzi B, Donghi M, Ferrara M, Fiore F, Gardelli C, Gonzalez Paz O, Hazuda DJ, Jones P, Kinzel O, Laufer R, Monteagudo E, Muraglia E, Nizi E, Orvieto F, Pace P, Pescatore G, Scarpelli R, Stillmock K, Witmer MV, Rowley M. 2008. Discovery of raltegravir, a potent, selective orally bioavailable HIV-integrase inhibitor for the treatment of HIV-AIDS infection. J Med Chem 51:5843–5855. doi:10.1021/jm800245z. - DOI - PubMed
    1. Ramanathan S, Mathias AA, German P, Kearney BP. 2011. Clinical pharmacokinetic and pharmacodynamic profile of the HIV integrase inhibitor elvitegravir. Clin Pharmacokinet 50:229–244. doi:10.2165/11584570-000000000-00000. - DOI - PubMed
    1. Min S, Song I, Borland J, Chen S, Lou Y, Fujiwara T, Piscitelli SC. 2010. Pharmacokinetics and safety of S/GSK1349572, a next-generation HIV integrase inhibitor, in healthy volunteers. Antimicrob Agents Chemother 54:254–258. doi:10.1128/AAC.00842-09. - DOI - PMC - PubMed

Publication types

LinkOut - more resources