. 2022 Sep 1;128(3):634-648.
doi: 10.1152/jn.00436.2021. Epub 2022 Aug 17.

The prefrontal cortex of the Mexican free-tailed bat is more selective to communication calls than primary auditory cortex

Affiliations

The prefrontal cortex of the Mexican free-tailed bat is more selective to communication calls than primary auditory cortex

Silvio Macias et al. J Neurophysiol. .

Abstract

In this study, we examined the auditory responses of a prefrontal area, the frontal auditory field (FAF), of an echolocating bat (Tadarida brasiliensis) and presented a comparative analysis of the neuronal response properties between the FAF and the primary auditory cortex (A1). We compared single-unit responses from the A1 and the FAF elicited by pure tones, downward frequency-modulated sweeps (dFMs), and species-specific vocalizations. Unlike the A1, FAFs were not frequency tuned. However, progressive increases in dFM sweep rate elicited a systematic increase of response precision, a phenomenon that does not take place in the A1. Call selectivity was higher in the FAF versus A1. We calculated the neuronal spectrotemporal receptive fields (STRFs) and spike-triggered averages (STAs) to predict responses to the communication calls and provide an explanation for the differences in call selectivity between the FAF and A1. In the A1, we found a high correlation between predicted and evoked responses. However, we did not generate reasonable STRFs in the FAF, and the prediction based on the STAs showed lower correlation coefficient than that of the A1. This suggests nonlinear response properties in the FAF that are stronger than the linear response properties in the A1. Stimulating with a call sequence increased call selectivity in the A1, but it remained unchanged in the FAF. These data are consistent with a role for the FAF in assessing distinctive acoustic features downstream of A1, similar to the role proposed for primate ventrolateral prefrontal cortex.NEW & NOTEWORTHY In this study, we examined the neuronal responses of a frontal cortical area in an echolocating bat to behaviorally relevant acoustic stimuli and compared them with those in the primary auditory cortex (A1). In contrast to the A1, neurons in the bat frontal auditory field are not frequency tuned but showed a higher selectivity for social signals such as communication calls. The results presented here indicate that the frontal auditory field may represent an additional processing center for behaviorally relevant sounds.

Keywords: bats; communication sounds; frontal auditory field; primary auditory cortex.


Conflict of interest statement

No conflicts of interest, financial or otherwise, are declared by the authors.

Figures

None
Graphical abstract
Figure 1.
Figure 1.
Communication calls used as acoustic stimuli. Left: spectrogram. Right: power spectra.
Figure 2.
Figure 2.
Location and neural spontaneous activity of the primary auditory cortex (A1) and the frontal auditory field (FAF). A: the free-tailed bat Tadarida brasiliensis. B: location of the A1 (blue; the median cerebral artery and its branches were used as reference points) and the FAF [red; the sulcus anterior was used as landmark following previous studies (10, 12, 13)]. C: raw neural recording (band pass 500–3,000 Hz) of an example neuron in the A1 without acoustic stimulation (left) and distribution of the spontaneous rate of the 105 neurons recorded in the A1 (right). D: raw neural recording (band pass 500–3,000 Hz) of an example neuron in the FAF without acoustic stimulation (left) and distribution of the spontaneous rate of the 75 neurons recorded in the FAF (right).
Figure 3.
Figure 3.
Responses to pure tones of changing frequency. A: example responses from a neuron in the primary auditory cortex (A1) to its characteristic frequency. B: example responses from a neuron in the frontal auditory field (FAF). For each neuron, responses are represented as dot-raster displays and poststimulus time histograms (2-ms bin width; blue, A1; red, FAF). C: frequency response area for the A1 neuron represented in A. D: frequency response area for the FAF neuron represented in B. E: distribution of minimum threshold for the population of neurons in the A1 (blue bars) and the FAF (red bars). F: color map of normalized response from each unit in the A1 (organized by the anterior-posterior position along the y-axis) in response to the different frequencies. G: color map of normalized response from each unit in the FAF (organized by the recording depth along the y-axis) in response to the different frequencies.
Figure 4.
Figure 4.
Comparison of properties in response to pure tones between primary auditory cortex (A1) and frontal auditory field (FAF). A: mean first spike latencies in A1 (blue) and FAF (red). B: SD of the latency. C: response duration. In the A1, the data are divided into the response to the best frequency (A1 BF) and responses outside of the best frequency (A1 nonBF). Number of neurons: 105 in A1, 75 in the FAF. **Significant differences after Kruskal–Wallis test (P < 0.01).
Figure 5.
Figure 5.
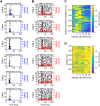
Responses to downward frequency-modulated sweeps (dFMs) of changing sweep rate. A: example responses from a neuron in the primary auditory cortex (A1). B: example responses from a neuron in the frontal auditory field (FAF). For each neuron, responses to different sweep rates (indicated at top) are represented as dot-raster displays and poststimulus time histograms (2-ms bin width; blue, A1; red, FAF). C: color map of normalized response from each unit in the A1 (organized by the anterior-posterior position along the y-axis) in response to the different sweep rates. D: color map of normalized response from each unit in the FAF (organized by the recording depth along the y-axis) in response to the different sweep rates.
Figure 6.
Figure 6.
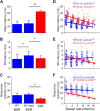
Comparison of properties in response to downward frequency-modulated sweeps (dFMs) between primary auditory cortex (A1) and frontal auditory field (FAF). A: mean first spike latencies in A1 (blue) and FAF (red). B: SD of the latency. C: response duration. In the A1, the data are divided into the response to the best sweep rate (BSR) and responses outside of the best sweep rate (non BSR). Number of neurons: 105 in A1, 27 in the FAF. Significant differences after Kruskal–Wallis test: **P < 0.01, *P < 0.05. D: mean first spike latency in A1 and FAF as a function of sweep rate. E: SD of the first spike latency as a function of sweep rate. F: response duration as a function of sweep rate. In D–F the result of a linear regression analysis is shown. ns, Not significant.
Figure 7.
Figure 7.
Responses to communication calls. A: communication calls used as acoustic stimulus. B: primary auditory cortex (A1) neuron showing responses to all 9 calls. C: A1 neuron being responsive to 2 calls of the 9 vocalizations. D: neuron in the frontal auditory field (FAF) with responses to all 9 calls. E: neuron in the FAF responding only to 2 calls. For each neuron, the dot-raster display and poststimulus time histogram (PSTH) (left) and the normalized response (right) are shown.
Figure 8.
Figure 8.
Comparison of properties in response to communication calls between primary auditory cortex (A1) and frontal auditory field (FAF). A: mean first spike latencies in A1 (blue) and FAF (red). B: SD of the latency. C: response duration. Number of neurons: 105 in A1, 75 in the FAF. **Significant differences after Kruskal–Wallis test (P < 0.01).
Figure 9.
Figure 9.
Call selectivity in the primary auditory cortex (A1) and the frontal auditory field (FAF). A: call preference index (CPI) in the A1 (n = 105). B: CPI in the FAF. C: color map of normalized response from each unit in the A1 (organized by the anterior-posterior position along the y-axis) in response to the different call types. D: color map of normalized response from each unit in the FAF (organized by the recording depth along the y-axis) in response to the different call types. E: number of neurons responding to each call in the A1. F: number of neurons responding to each call in the FAF.
Figure 10.
Figure 10.
Comparison of the spectrotemporal characteristics of the communication calls. A: similarity matrix of the spectrotemporal characteristics of the 9 calls used as acoustic stimuli. B: similarity matrix calculated for the responses of 132 neurons in the primary auditory cortex (A1). C: similarity matrix calculated for the responses of 55 neurons in the frontal auditory field (FAF). D: relationship between spectral overlap and correlations in the population responses for A1 (blue) and the FAF (red).
Figure 11.
Figure 11.
Spectrotemporal receptive field (STRF) in the primary auditory cortex (A1). A: spectrogram of a fragment of the dynamic moving ripple noise used as acoustic stimuli to calculate the STRF. B: example STRF generated by the dynamic moving ripples in an A1 neuron. Excitation is indicated in yellow and inhibition in blue.
Figure 12.
Figure 12.
Response predictions based on the call spike-triggered average (STA). A: examples of the STAs calculated for each call based on the response of a primary auditory cortex (A1) neuron. B: STA constructed from 8 calls used to predict the response to the 9th (leave one out) call. C: poststimulus time histogram (black) of the evoked responses of 1 A1 neuron to each call and predicted response (blue) after the convolution of the STA with the leave one out calls. D: correlation between the evoked and predicted response of the neuron shown in A–C. E: distribution of correlation coefficient calculated between the evoked and predicted response in 155 A1 neurons. F: distribution of correlation coefficient calculated between the evoked and predicted response in 55 frontal auditory field (FAF) neurons.
Figure 13.
Figure 13.
Responses to temporally isolated call and to the sequence. A: oscillogram of the call sequence (top) and raster plot with overlaid poststimulus time histogram (PSTH) calculated for the response to the isolated calls (middle) and the sequence (bottom) of an example neuron in the primary auditory cortex (A1). B: oscillogram of the sequence (top) and raster plot and PSTH calculated for the response to the isolated calls (middle) and the sequence (bottom) of an example neuron in the frontal auditory field (FAF). C: comparison of the call preference index (CPI) obtained in response to the isolated calls and the sequence in the A1 (n = 25 neurons). D: comparison of the CPI obtained in response to the isolated calls and the sequence in the FAF (n = 21 neurons).

Similar articles

Cited by

References

    1. Denes PB, Pinson E. The Speech Chain: The Physics and Biology of Spoken Language (2nd ed.). Long Grove, IL: Waveland Press, 1993.
    1. Hackett TA, Stepniewska I, Kaas JH. Prefrontal connections of the parabelt auditory cortex in macaque monkeys. Brain Res 817: 45–58, 1999. doi:10.1016/s0006-8993(98)01182-2. - DOI - PubMed
    1. Fuster JM. The prefrontal cortex—an update: time is of the essence. Neuron 30: 319–333, 2001. doi:10.1016/s0896-6273(01)00285-9. - DOI - PubMed
    1. Eliades SJ, Wang X. Sensory-motor interaction in the primate auditory cortex during self-initiated vocalizations. J Neurophysiol 89: 2194–2207, 2003. doi:10.1152/jn.00627.2002. - DOI - PubMed
    1. Greenlee JD, Behroozmand R, Larson CR, Jackson AW, Chen F, Hansen DR, Oya H, Kawasaki H, Howard MA 3rd.. Sensory-motor interactions for vocal pitch monitoring in non-primary human auditory cortex. PLoS One 8: e60783, 2013. doi:10.1371/journal.pone.0060783. - DOI - PMC - PubMed

Publication types

LinkOut - more resources