

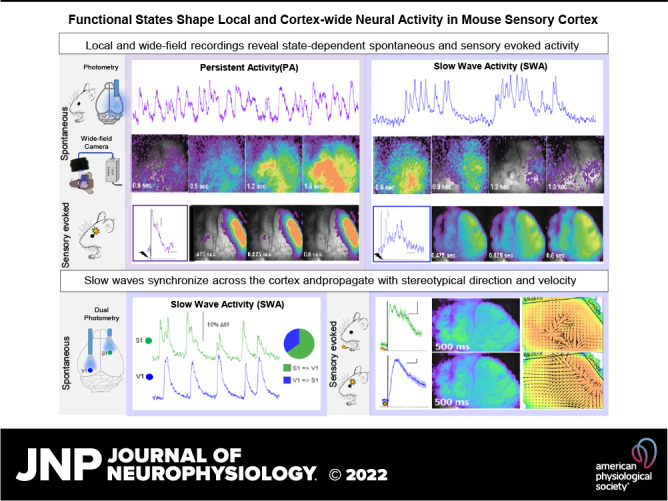
Functional states shape the spatiotemporal representation of local and cortex-wide neural activity in mouse sensory cortex
- PMID: 35975935
- PMCID: PMC9722264
- DOI: 10.1152/jn.00424.2021
Functional states shape the spatiotemporal representation of local and cortex-wide neural activity in mouse sensory cortex
Abstract
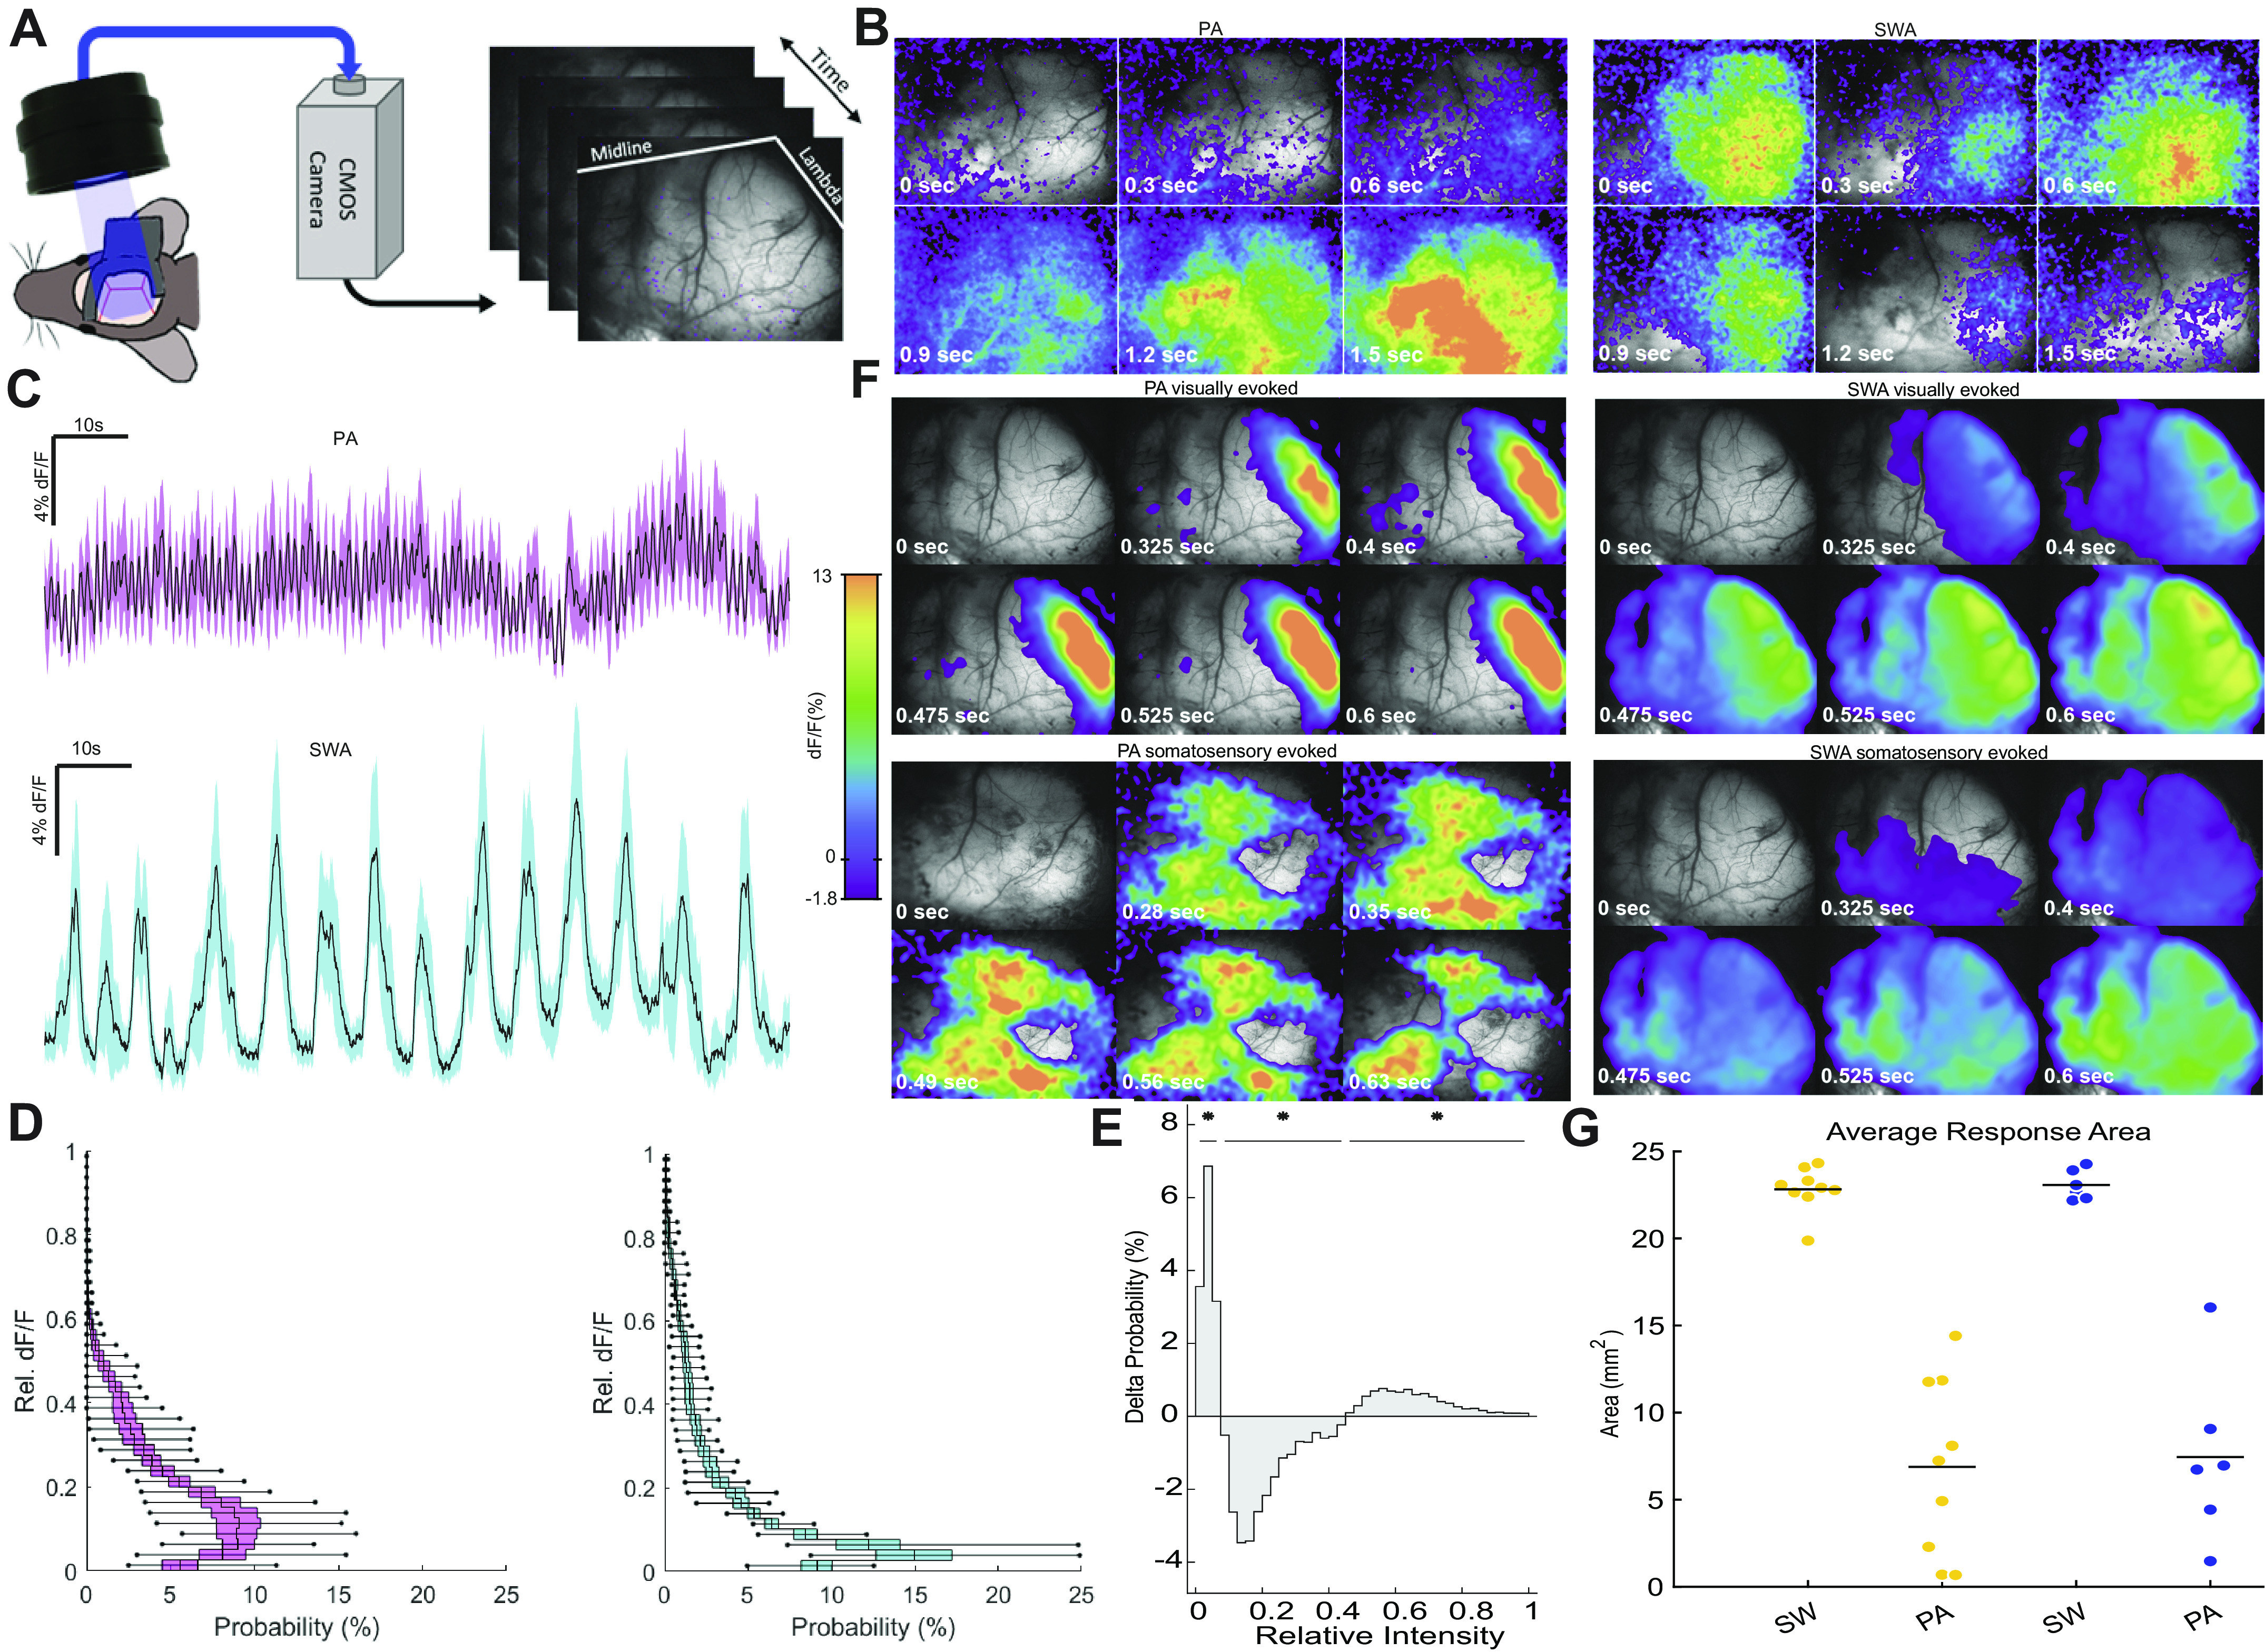
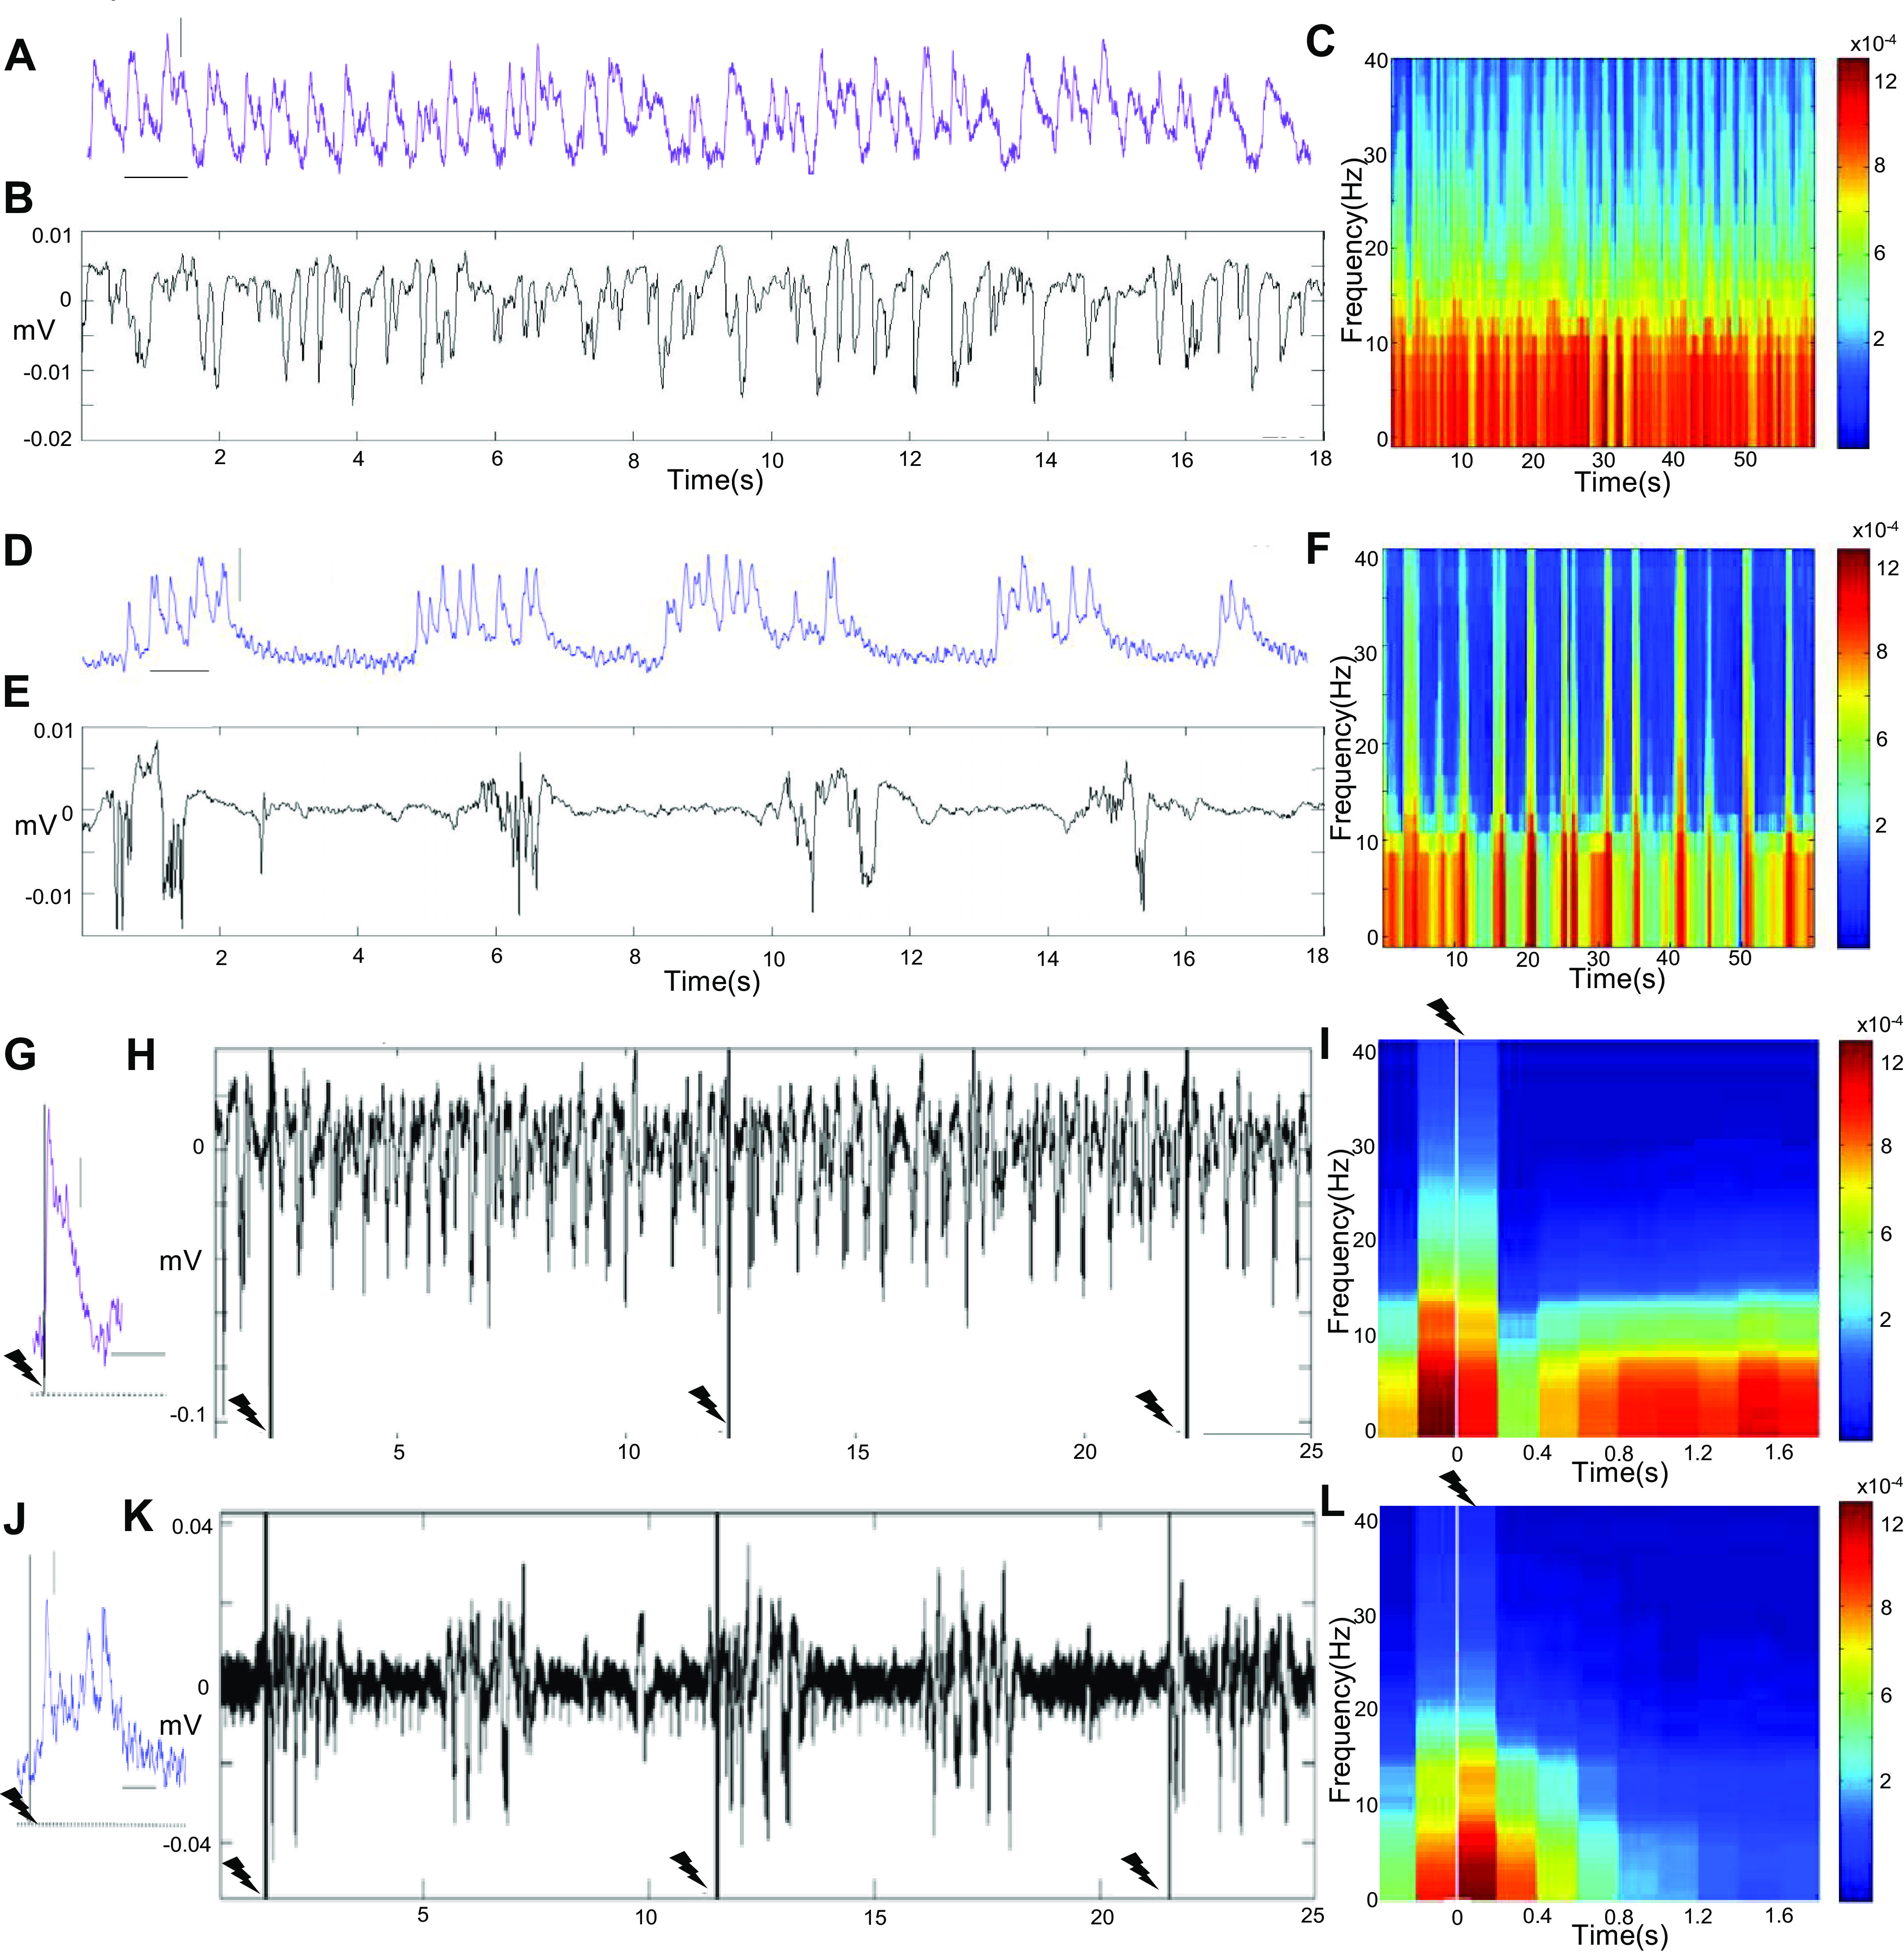
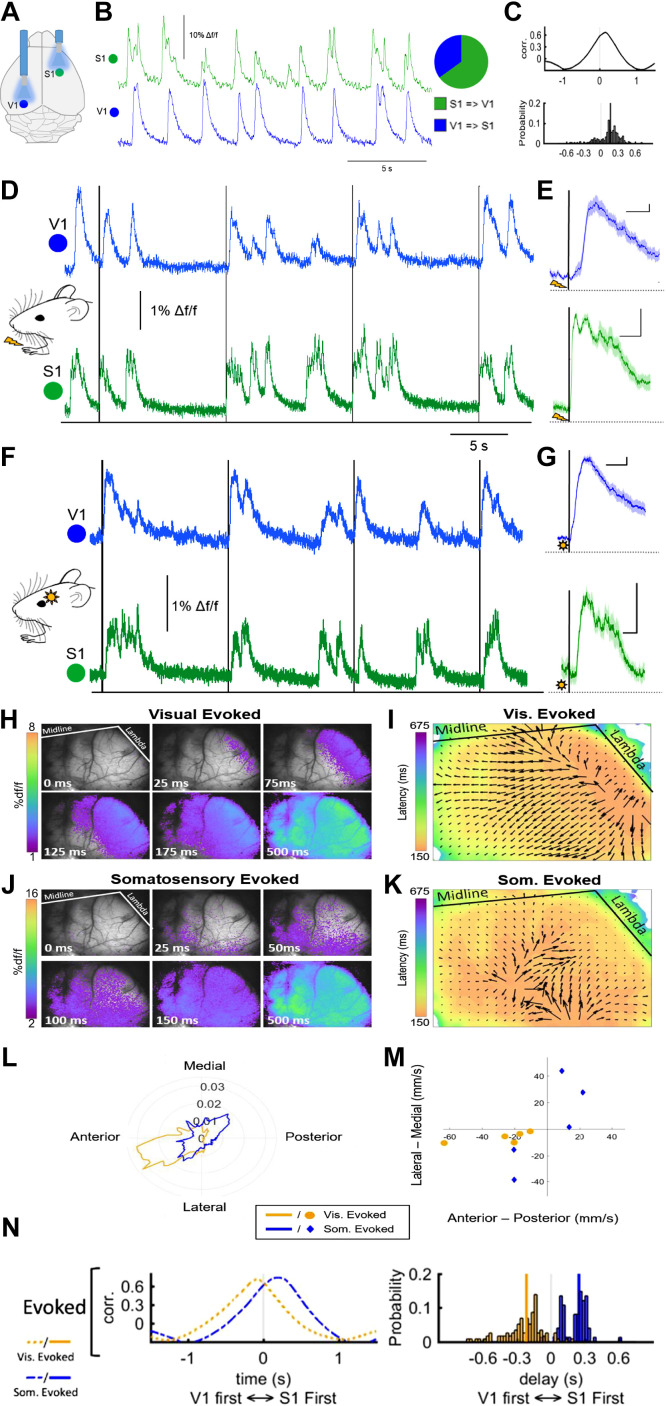
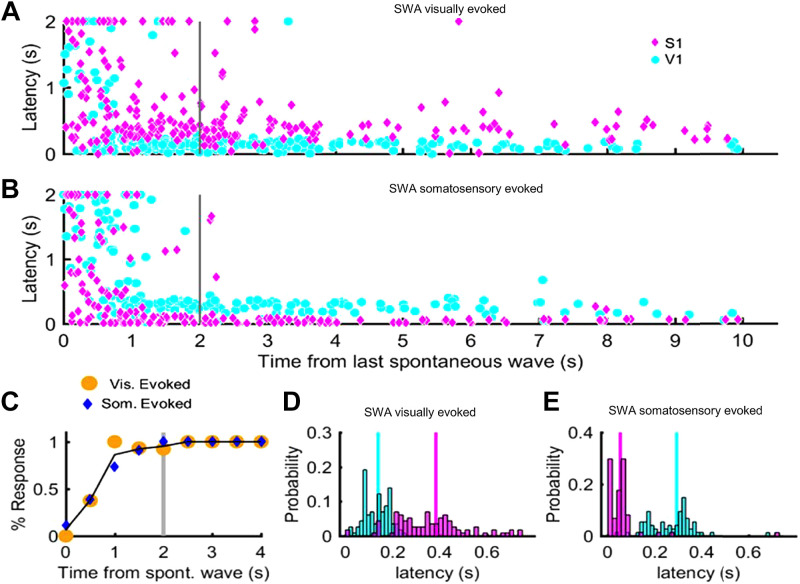
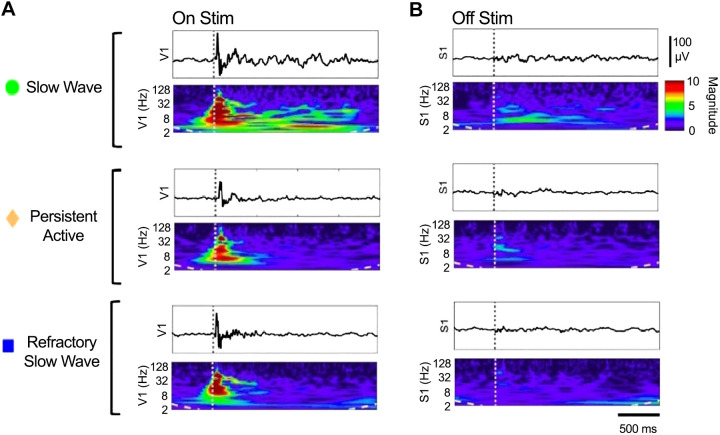
The spatiotemporal representation of neural activity during rest and upon sensory stimulation in cortical areas is highly dynamic and may be predominantly governed by cortical state. On the mesoscale level, intrinsic neuronal activity ranges from a persistent state, generally associated with a sustained depolarization of neurons, to a bimodal, slow wave-like state with bursts of neuronal activation alternating with silent periods. These different activity states are prevalent under certain types of sedatives or are associated with specific behavioral or vigilance conditions. Neurophysiological experiments assessing circuit activity usually assume a constant underlying state, yet reports of variability of neuronal responses under seemingly constant conditions are common in the field. Even when a certain type of neural activity or cortical state can be stably maintained over time, the associated response properties are highly relevant for explaining experimental outcomes. Here we describe the spatiotemporal characteristics of ongoing activity and sensory-evoked responses under two predominant functional states in the sensory cortices of mice: persistent activity (PA) and slow wave activity (SWA). Using electrophysiological recordings and local and wide-field calcium recordings, we examine whether spontaneous and sensory-evoked neuronal activity propagate throughout the cortex in a state-dependent manner. We find that PA and SWA differ in their spatiotemporal characteristics, which determine the cortical network's response to a sensory stimulus. During PA state, sensory stimulation elicits gamma-based short-latency responses that precisely follow each stimulation pulse and are prone to adaptation upon higher stimulation frequencies. Sensory responses during SWA are more variable, dependent on refractory periods following spontaneous slow waves. Although spontaneous slow waves propagated in anterior-posterior direction in a majority of observations, the direction of propagation of stimulus-elicited wave depends on the sensory modality. These findings suggest that cortical state explains variance and should be considered when investigating multiscale correlates of functional neurocircuit activity.NEW & NOTEWORTHY Here we dissect the cortical representation of brain states based on local photometry recordings and on mesoscale cortical calcium imaging, complemented by electrophysiological recordings in mice. We identify two distinct functional states in the sensory cortices, which differ in their spatiotemporal characteristics on the local and global cortical scales. We examine how intrinsic and stimulus-evoked neuronal activity propagates throughout the cortex in a state-dependent manner, supporting the notion that cortical state is a relevant variable to consider for a wide range of neurophysiological experiments.
Keywords: LFP; brain states; calcium imaging; mouse; sensory cortex.
Conflict of interest statement
No conflicts of interest, financial or otherwise, are declared by the authors.
Figures
Similar articles
-
Spatiotemporal structure of sensory-evoked and spontaneous activity revealed by mesoscale imaging in anesthetized and awake mice.Cell Rep. 2021 Dec 7;37(10):110081. doi: 10.1016/j.celrep.2021.110081. Cell Rep. 2021. PMID: 34879278
-
Cortex-Wide Dynamics of Intrinsic Electrical Activities: Propagating Waves and Their Interactions.J Neurosci. 2021 Apr 21;41(16):3665-3678. doi: 10.1523/JNEUROSCI.0623-20.2021. Epub 2021 Mar 16. J Neurosci. 2021. PMID: 33727333 Free PMC article.
-
Why Does Sleep Slow-Wave Activity Increase After Extended Wake? Assessing the Effects of Increased Cortical Firing During Wake and Sleep.J Neurosci. 2016 Dec 7;36(49):12436-12447. doi: 10.1523/JNEUROSCI.1614-16.2016. J Neurosci. 2016. PMID: 27927960 Free PMC article.
-
Visualizing Adult Cortical Plasticity Using Intrinsic Signal Optical Imaging.In: Frostig RD, editor. In Vivo Optical Imaging of Brain Function. 2nd edition. Boca Raton (FL): CRC Press/Taylor & Francis; 2009. Chapter 9. In: Frostig RD, editor. In Vivo Optical Imaging of Brain Function. 2nd edition. Boca Raton (FL): CRC Press/Taylor & Francis; 2009. Chapter 9. PMID: 26844321 Free Books & Documents. Review.
-
Large Scale Cortical Functional Networks Associated with Slow-Wave and Spindle-Burst-Related Spontaneous Activity.Front Neural Circuits. 2016 Dec 21;10:103. doi: 10.3389/fncir.2016.00103. eCollection 2016. Front Neural Circuits. 2016. PMID: 28066190 Free PMC article. Review.
Cited by
-
Modulating cortical excitability and cortical arousal by pupil self-regulation.Nat Commun. 2025 May 16;16(1):4552. doi: 10.1038/s41467-025-59837-5. Nat Commun. 2025. PMID: 40379647 Free PMC article.
References
-
- Steriade M, Dossi RC, Nuñez A. Network modulation of a slow intrinsic oscillation of cat thalamocortical neurons implicated in sleep delta waves: cortically induced synchronization and brainstem cholinergic suppression. J Neurosci 11: 3200–3217, 1991. doi:10.1523/JNEUROSCI.11-10-03200.1991. - DOI - PMC - PubMed
-
- Boly M, Coleman MR, Davis MH, Hampshire A, Bor D, Moonen G, Maquet PA, Pickard JD, Laureys S, Owen AM. When thoughts become action: an fMRI paradigm to study volitional brain activity in non-communicative brain injured patients. NeuroImage 36: 979–992, 2007. doi:10.1016/j.neuroimage.2007.02.047. - DOI - PubMed
Publication types
MeSH terms
Substances
Grants and funding
LinkOut - more resources
Full Text Sources