. 2022 Dec;88(6):2339-2357.
doi: 10.1002/mrm.29373. Epub 2022 Aug 17.

Artifact suppression in readout-segmented consistent K-t space EPSI (RS-COKE) for fast 1 H spectroscopic imaging at 7 T

Affiliations

Artifact suppression in readout-segmented consistent K-t space EPSI (RS-COKE) for fast 1 H spectroscopic imaging at 7 T

Amir Seginer et al. Magn Reson Med. 2022 Dec.

Abstract

Purpose: Fast proton (1 H) MRSI is an important diagnostic tool for clinical investigations, providing metabolic and spatial information. MRSI at 7 T benefits from increased SNR and improved separation of peaks but requires larger spectral widths. RS-COKE (Readout-Segmented Consistent K-t space Epsi) is an echo planar spectroscopic imaging (Epsi) variant capable to support the spectral width required for human brain metabolites spectra at 7 T. However, mismatches between readout segments lead to artifacts, particularly when subcutaneous lipid signals are not suppressed. In this study, these mismatches and their effects are analyzed and reduced.

Methods: The following corrections to the data were performed: i) frequency-dependent phase corrections; ii) k-space trajectory corrections, derived from short reference scans; and iii) smoothing of data at segment transitions to mitigate the effect of residual mismatches. The improvement was evaluated by performing single-slice RS-COKE on a head-shaped phantom with a "lipid" layer and healthy subjects, using varying resolutions and durations ranging from 4.1 × 4.7 × 15 mm3 in 5:46 min to 3.1 × 3.3 × 15 mm3 in 13:07 min.

Results: Artifacts arising from the readout-segmented acquisition were substantially reduced, thus providing high-quality spectroscopic imaging in phantom and human scans. LCModel fitting of the human data resulted in a relative Cramer-Rao lower bounds within 6% for NAA, Cr, and Cho images in the majority of the voxels.

Conclusion: Using the new reference scans and reconstruction steps, RS-COKE was able to deliver fast 1 H MRSI at 7 T, overcoming the spectral width limitation of standard EPSI at this field strength.

Keywords: MRSI; spectroscopic imaging; ultrahigh field.


Conflict of interest statement

A.S. is employed by Siemens Healthcare Ltd, Israel; all other authors declare no competing financial interests. 10‐Jun‐2022.

Figures

FIGURE 1
FIGURE 1
Schematic diagram of the pulse sequence and the acquired trajectories in RS‐COKE. (A) A schematic diagram of the RS‐COKE sequence and (B–D) the resulting kxt trajectories. (B,C) are the trajectories of the odd and even excitations of a 3‐segmented RS‐COKE acquisition. Colors mark different PE lines (#1: blue; #2: red). Faint lines with hollow arrows mark gradients with data sampling switched off. All blue lines (PE #1) can be recombined from (B) and (C) into a consistent set (D) of acquisitions (same‐PE and same‐sign gradients). The same is done for PE #2 (not shown). The time gap δt is the gap between segments at the center of their overlap (vertical dashed lines). Further time‐shifting the segments relative to each other can minimize the gap for either the positive or the negative gradient acquisitions but at the cost of a larger gap for the opposite acquisition gradient. PE, phase‐encode; RS‐COKE, readout‐segmented consistent K‐t space echo planar spectroscopic imaging.
FIGURE 2
FIGURE 2
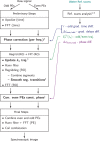
Schematic flowchart of the reconstruction, including correction steps. The odd and even PE lines (positive and negative RO gradients) are processed in parallel before they are combined in the final steps. The different parameters extracted from the water references (right) are used at different stages of the reconstruction, marked by arrows. Correction steps are marked in bold with superscripts marking the relevant section in the main text as follows: 1even/odd inconsistencies: Nyquist ghosts, 2trajectory corrections kx and time t), 3off‐resonance inconsistencies, 4residual segment inconsistencies.
FIGURE 3
FIGURE 3
Simulated ringing artifacts in a readout‐segmented acquisition for an annulus object mimicking the subcutaneous lipid layer in the head. (A) Each segment acquisition starts at the same delay from the excitation; both on‐ and off‐resonance cases are shown (off‐resonance mimics the lipid signal). (B) Acquisitions with incrementally time‐shifted segments to achieve an effective continuous temporal evolution within each 3‐segment PE line. (C) Signal ringing along an image‐domain line (white, dashed) inside the annulus for cases (A) and (B). (D) Effect of scaling the RO amplitude (but not the corresponding prephasing gradients); a stretching that can occur between the segments. For simplicity, simulations used equidistant k‐space points instead of the nonuniform sampling (sine‐shaped gradients) used in the actual scan. RO, readout.
FIGURE 4
FIGURE 4
Signals from the trajectory reference scans on water (left: before trajectory correction; right: after; top: phantom scan; bottom: a scan performed in vivo). Signals shown are the zero‐frequency component of the reference scans raw data (after apodization and an FT along time). The stray blue points, even after correction, are probably transients due to switching of the receivers on/off, and where disregarded (the first and last 4 samples were always discarded in the analysis). FT, Fourier Transform.
FIGURE 5
FIGURE 5
The effect of the trajectory correction on the signal at the transition between overlapping segments (top, phantom example; bottom, data acquired in vivo). The full extent of the signals is shown to the left, with zooms into the overlap shown in the middle and on the right (middle before correction and right after correction). The corrected signals are overlayed with the gridded signal (black), which smooths the transition (see main text). After correction, the signal mismatch in vivo is mostly in amplitude, probably mainly due to physiological changes. Signals are shown for ky=0 and for the dominant frequency (lipids)
FIGURE 6
FIGURE 6
Phantom RS‐COKE results without and with RO‐segments corrections. (A) A GRE scan at the MRSI slice position (used to calibrate coil combination weights). (B) Spectral images for “lipids” (oil), NAA, Cho, and Cr, without trajectory corrections or smoothing of transitions. (C) Same as (B) but with corrections. (D) Spectra at the positions (1) and (2), marked on the NAA images. Red spectra are without the corrections and black spectra have been corrected. Spectra are displayed as the real part after a 3 × 3 voxel average. Images are the magnitude after integration over the complex spectrum in the corresponding voxel, with the lipid image summed over 227 Hz and the metabolites over 116 Hz. The lipid images scale is ×80 that of the metabolite images. The scaling of the intensity in the images was chosen to highlight the artifacts. The same scaling was used for the top (without correction) and bottom (with corrections) images. GRE, gradient echo.
FIGURE 7
FIGURE 7
In vivo RS‐COKE results without and with RO‐segments corrections. (A) Images for reference: a localizer showing the slice position and a high‐resolution GRE scan at the slice (with IR for T1 weighting). (B) Spectral images of lipids, NAA, Cho, and Cr, without trajectory corrections or smoothing of transitions. (C) Same as (B) but with corrections. (D) Spectra at the positions (1) and (2), marked on the NAA images. Red spectra are without the corrections and black spectra have been corrected. Spectra are displayed as the real part after a 3 × 3 voxel average. Images are the magnitude after integration over the complex spectrum in the corresponding voxel, with the lipid image summed over 227 Hz and the metabolites over 116 Hz. The lipid images scale is ×15 that of the metabolites. The scaling of the intensity in the images was chosen to highlight the artifacts and the features. The same scaling was used for the top (without correction) and bottom (with corrections) images.
FIGURE 8
FIGURE 8
Spectra from RS‐COKE with different spectral width, number of segments, and spatial resolution. Left, spectra from three scans with ESP = 0.34 ms (SW = 2941 Hz): (i) 3 segments and 63 × 64 reconstructed voxels (4.1 × 4.7 mm2) in 5:49 min, (ii) 5 segments and 60 × 64 reconstructed voxels (4.3 × 4.7 mm2) in 9:26 min, and (iii) 5 segments and 85 × 90 reconstructed voxels (3.1 × 3.3 mm2) in 13:07 min. Right, scan (iv) with ESP = 0.28 ms (SW = 3571 Hz) and the rest as in (i). The top row shows the LCModel fitting for a single voxel, the bottom row for an average of 3 × 3 voxels. The image at the top‐left corner shows the NAA image from Figure 6 with the location of the voxel marked by a red plus symbol. ESP, echo spacing; SW, spectral width.
FIGURE 9
FIGURE 9
NAA images from RS‐COKE for varying scan parameters: SW, number of segments, and spatial resolution. From left to right: the first three with ESP = 0.34 ms (SW = 2941 Hz) having: (i) 3 segments and 63 × 64 reconstructed voxels (4.1 × 4.7 mm2) in 5:49 min, (ii) 5 segments and 60 × 64 reconstructed voxels (4.3 × 4.7 mm2) in 9:26 min, (iii) 5 segments and 85 × 90 reconstructed voxels (3.1 × 3.3 mm2) in 13:07 min, and the last scan (iv) with ESP = 0.28 ms (SW = 3571 Hz) but otherwise the same as (i). The top row shows the NAA images integrated over 116 Hz around the NAA peak. The middle row shows the LCModel‐estimated NAA maps, and the bottom row shows the corresponding CRLB maps. The image at the top‐left corner shows the high‐resolution reference GRE image with the outline for the mask used on the NAA images marked in red. The arrows in the top‐right image point to residual artifacts in the integral image: one in the PE direction and one in the readout direction, which were removed with the LCModel fitting. Each of the integral images was scaled separately to visualize the features. The metabolite maps (based on LCModel) were all scaled the same, normalized to the maximum of the right most image. The FOV of the images was cropped to reduce surrounding empty space. CRLB, Cramer‐Rao lower bounds.
FIGURE 10
FIGURE 10
Metabolite maps from LCModel: NAA, Cr, Cho, and Glu + Gln/NAA ratio. The images shown are for scan (i): ESP = 0.34 ms (SW = 2941 Hz), 3 segments, 63 × 64 reconstructed voxels (4.1 × 4.7 mm2) in 5:49 min; and for scan (iii): 5 segments, 85 × 90 reconstructed voxels (3.1 × 3.3 mm2) in 13:07 min. The metabolite maps and the corresponding CRLB maps are shown. The color bars of the metabolite maps were chosen to highlight the features for each metabolite. The maps were normalized the same as in Figure 9. The black overlay highlights a region with high B0 inhomogeneity. The FOV of the images was cropped to reduce surrounding empty space.

Similar articles

References

    1. Gillies RJ, Morse DL. In vivo magnetic resonance spectroscopy in cancer. Annu Rev Biomed Eng. 2005;7:287‐326. - PubMed
    1. Keshavan MS, Stanley JA, Pettegrew JW. Magnetic resonance spectroscopy in schizophrenia: methodological issues and findings—part II. Biol Psychiatry. 2000;48:369‐380. - PubMed
    1. Auer DP, Pütz B, Kraft E, Lipinski B, Schill J, Holsboer F. Reduced glutamate in the anterior cingulate cortex in depression: an in vivo proton magnetic resonance spectroscopy study. Biol Psychiatry. 2000;47:305‐313. - PubMed
    1. Emir UE, Tuite PJ, Öz G. Elevated pontine and putamenal GABA levels in mild‐moderate Parkinson disease detected by 7 Tesla proton MRS. PLoS One. 2012;7:e30918. - PMC - PubMed
    1. Emir UE, Auerbach EJ, Moortele PFVD, et al. Regional neurochemical profiles in the human brain measured by 1H MRS at 7 T using local B1 shimming: sIngle‐voxel MRS AT 7 T with transceiver array coil. NMR Biomed. 2012;25:152‐160. - PMC - PubMed

Publication types