. 2022 Sep 19;29(11):589-598.
doi: 10.1530/ERC-22-0020. Print 2022 Nov 1.

The immune cell infiltrate in the tumour microenvironment of phaeochromocytomas and paragangliomas

Affiliations

The immune cell infiltrate in the tumour microenvironment of phaeochromocytomas and paragangliomas

N Tufton et al. Endocr Relat Cancer. .

Abstract

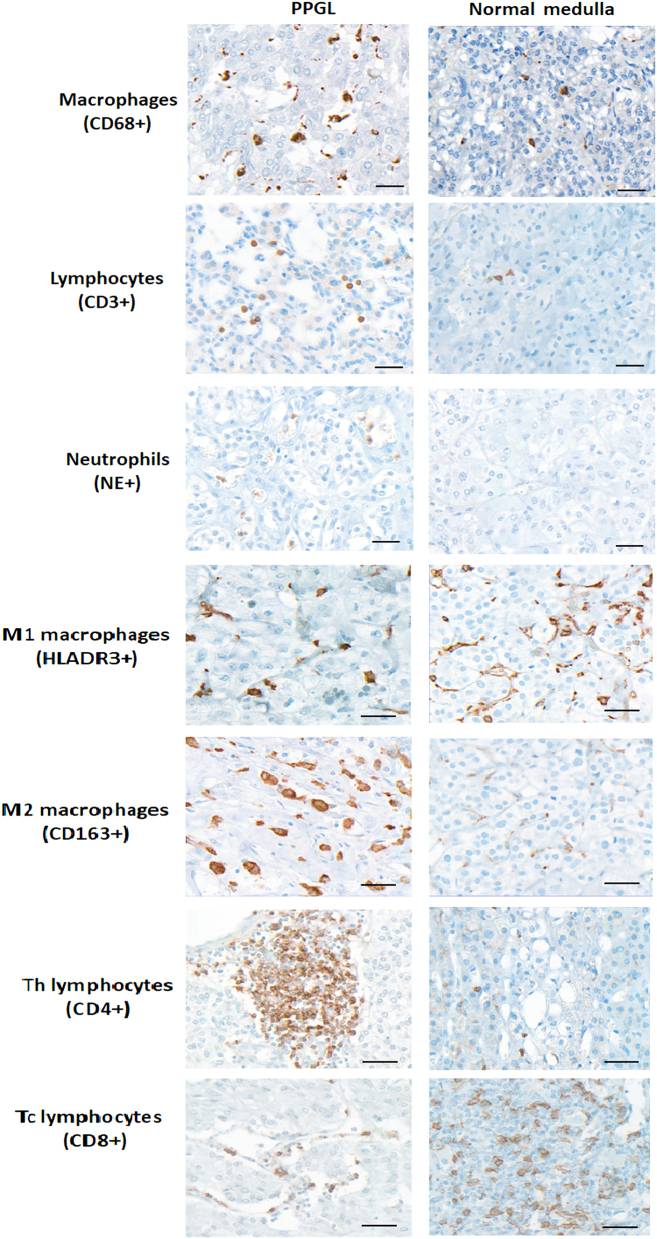
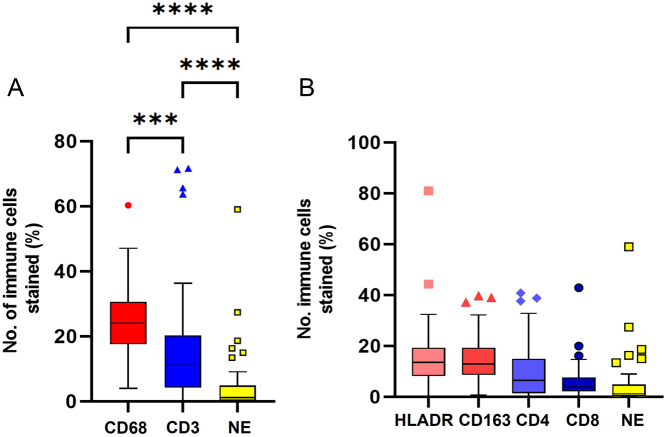
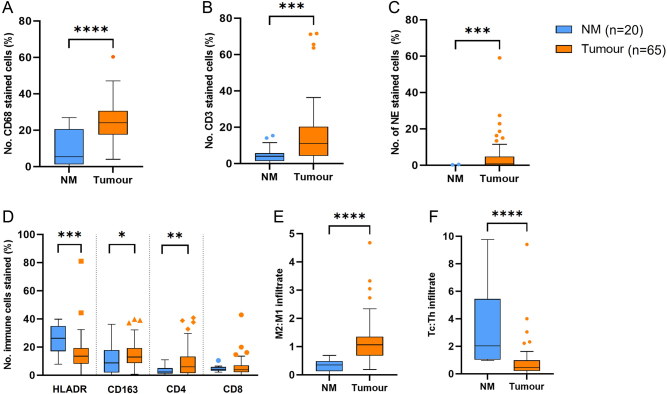
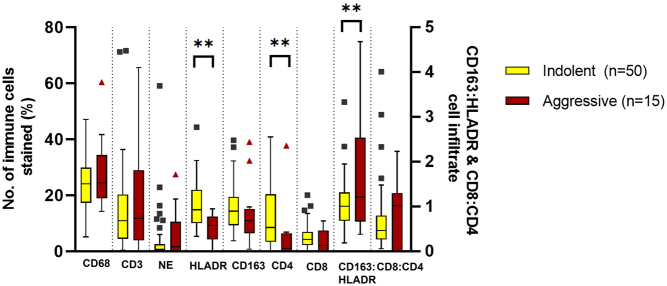
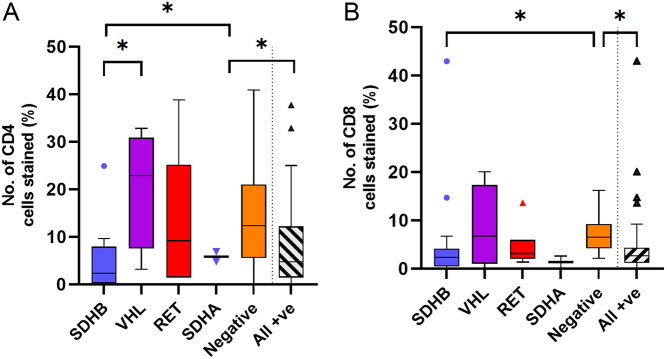
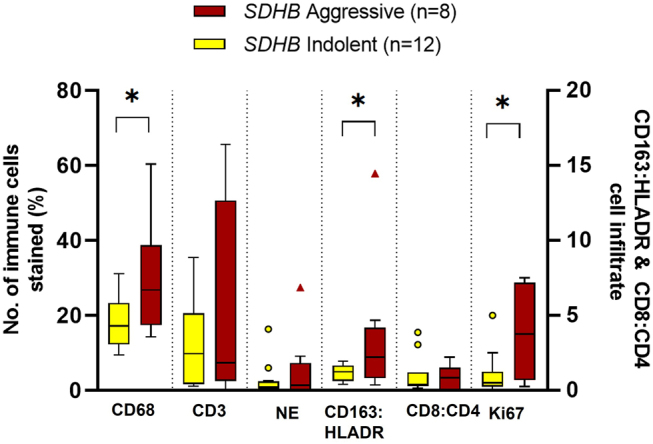
Emerging evidence suggests the composition of the tumour microenvironment (TME) correlates with clinical outcome and that each tumour type has a unique TME including a variable population of inflammatory cells. We performed immunohistochemistry on 65 phaeochromocytoma and paraganglioma (PPGL) tumour samples with 20 normal adrenal medulla samples for comparison. The immune cells assessed were macrophages, lymphocytes and neutrophils, and we compared the proportion of infiltration of these immune cells with clinical and histopathological factors. There was a higher proportion of immune cells in tumour tissue compared to non-neoplastic adrenal medulla tissue, with a predominance of macrophages. There was a higher proportion of M2:M1 macrophages and T-helper lymphocytes in aggressive tumours compared to indolent ones. For SDHB-associated tumours, there was a higher proportion of M2 macrophage infiltration, with higher M2:M1 in aggressive SDHB PPGLs compared to indolent tumours. These data demonstrate that immune cells do infiltrate the TME of PPGLs, confirming that PPGLs are immunologically active tumours. Differences in the TME of PPGLs were observed between aggressive and indolent tumours. These differences could potentially be exploited as an aid in predicting tumour behaviour.

Keywords: immune cells; lymphocyte; macrophage; paraganglioma; phaeochromocytoma; tumour microenvironment.


Figures

Figure 1
Figure 1
Representative images of PPGLs and non-neoplastic medulla immunohistochemical staining for immune cell markers. Formalin-fixed, paraffin-embedded tissue sections were immunolabelled with CD68+ (macrophages), CD3+ T-cell lymphocytes), neutrophil elastase+ (NE, neutrophils), HLADR+ (M1 macrophages), CD163+ (M2 macrophages), CD4+ (Th T-helper lymphocytes) and CD8+ (Tc cytotoxic T lymphocytes). Scale bar = 40 μm.
Figure 2
Figure 2
Immunohistochemical analysis of immune cells in PPGL tumours. Immune cells analysed: macrophages (CD68+, M1 HLADR+, M2 CD163+), lymphocytes (CD3+, Th CD4+, Tc CD8+) and neutrophils (NE, neutrophil elastase+). Box-and-whisker plots of mean, IQR and outlying points of the percentage of immunopositive cells as a proportion of the total number of cells for PPGL tumour tissue (n = 65). (A) Comparison between major immune cell types. Statistical analysis by ANOVA with Tukey’s multi-comparison tests (P < 0.001). Macrophages vs lymphocytes (P = 0.0002), macrophages vs neutrophils (P < 0.001), lymphocyte vs neutrophils (P < 0.001). (B) Subsets of macrophages (HLADR+, CD163+) and lymphocytes (CD4+, CD8+). ANOVA with Tukey’s multi-comparison tests (P < 0.001). Th, T-cell helper lymphocyte, Tc, T-cell cytotoxic lymphocytes. A full colour version of this figure is available at https://doi.org/10.1530/ERC-22-0020.
Figure 3
Figure 3
Immunohistochemical analysis of immune cells in PPGL tumours compared to non-neoplastic adrenal medulla. Immune cells analysed: (A) macrophages (CD68+), (B) lymphocytes (CD3+), (C) neutrophils (NE, neutrophil elastase+), (D and E) M1 (HLADR3), M2 (CD163+), (D and E) T-helper lymphocytes (CD4+), Cytotoxic T cells (CD8+). Box-and-whisker plots of mean, IQR and outlying points of the percentage of immunopositive cells as a proportion of the total number of cells for PPGL tumour tissue (n = 65) and non-neoplastic adrenal medulla tissue (NM n = 20). (A) CD68 normal distributed data (****P < 0.0001) (Student two-tailed t-test), (B) lymphocytes (P = 0.0003). (C) Neutrophils (P = 0.0004) are non-parametric data Mann–Whitney U test (***P < 0.001). (D) Subset of macrophages: HLADR3 (P = 0.0008), CD163 (P = 0.0259), CD4 (P = 0.0015) and CD8 (P = 0.4). (E) M2:M1 (P < 0.001). (F) Tc:Th (P = 0.0019). A full colour version of this figure is available at https://doi.org/10.1530/ERC-22-0020.
Figure 4
Figure 4
Immunohistochemical analysis of immune cells in indolent and aggressive PPGL tumours. Immune cells analysed: macrophages (CD68+), lymphocytes (CD3+), neutrophils (NE, neutrophil elastase+), M1 (HLADR3), M2 (CD163+), T-helper lymphocytes (CD4+) and cytotoxic T cells (CD8+). Box-and-whisker plot of mean, IQR and outlying points of the percentage of immunopositive cells as a proportion of the total number of cells for indolent tumours (n = 50), aggressive tumours (n = 15). **P < 0.01 (Mann–Whitney U test. M1 macrophages (P = 0.0001), CD4 lymphocytes (P = 0.0039), M2:M1 (P = 0.01). Non-significant results of indolent vs aggressive tumour tissue CD68 P = 0.358, CD3 P = 0.999, NE P = 0.53, CD163 P = 0.138, CD8 P = 0.24 and Tc:Th P = 0.893. A full colour version of this figure is available at https://doi.org/10.1530/ERC-22-0020.
Figure 5
Figure 5
Immunohistochemical analysis of immune cells in PPGL tumours divided into genetic groups. Immune cells analysed: macrophages (CD68+), lymphocytes (CD3+), neutrophils (NE, neutrophil elastase+), M2:M1 (CD163+:HLADR+) and T-helper lymphocytes:Cytotoxic T cells (Tc:Th, CD4+:CD8+). (A) Box-and-whisker plot of mean, IQR and outlying points of the percentage of immunopositive cells as a proportion of the total number of cells for the different underlying genetic mutations for number of T-helper lymphocytes (CD4+). Statistical analysis by Kruskal–-allis test with Dunn’s multiple comparison tests (P = 0.0315*), SDHB vs VHL (P = 0.0211*), SDHB vs negative (P = 0.0427*), all positive vs negative (P = 0.027*). (B) Box-and-whisker plot of mean, IQR and outlying points of the percentage of immunopositive cells as a proportion of the total number of cells for the different underlying genetic mutations for number of cytotoxic T lymphocytes (CD8+). Statistical analysis by Kruskal–Wallis test with Dunn’s multiple comparison tests (P = 0.0185), SDHB vs negative (P = 0.033*), all positive vs negative (P = 0.00473*). A full colour version of this figure is available at https://doi.org/10.1530/ERC-22-0020.
Figure 6
Figure 6
Immunohistochemical analysis of immune cells in PPGL tumours that arose in patients with SDHB mutations. Immune cells analysed: macrophages (CD68+), lymphocytes (CD3+), neutrophils (NE, neutrophil elastase+), M2 (CD163+):M1 (HLADR+) macrophages, Tc (CD8+):Th (CD4+) lymphocytes and Ki67 index. Box-and-whisker plot of mean, IQR and outlying points of the percentage of immunopositive cells as a proportion of the total number of cells of immune cell infiltration in indolent (n = 12) and aggressive (n = 8) PPGLs in patients with SDHB mutations. Macrophages (P = 0.029) (Student t-test), lymphocytes (P = 0.45) (Welch’s t-test), neutrophils (P = 0.955) (Mann–Whitney U test), M2:M1 (P = 0.02) (Mann–Whitney U test), CD8:CD4 (P = 0.868) (Mann–Whitney U test) and Ki67 (P = 0.03) (Welch’s t-test). A full colour version of this figure is available at https://doi.org/10.1530/ERC-22-0020.

References

    1. Balkwill FR, Capasso M, Hagemann T.2012The tumor microenvironment at a glance. Journal of Cell Science 1255591–5596. (10.1242/jcs.116392) - DOI - PubMed
    1. Batchu S.2021Age-related differences of immune infiltrates in pheochromocytomas and paragangliomas. Journal of Endocrinological Investigation 441543–1546. (10.1007/s40618-020-01443-x) - DOI - PubMed
    1. Bosanska L, Petrak O, Zelinka T, Mraz M, Widimsky Jr J, Haluzik M.2009The effect of pheochromocytoma treatment on subclinical inflammation and endocrine function of adipose tissue. Physiological Research 58319–325. (10.33549/physiolres.931483) - DOI - PubMed
    1. Carron EC, Homra S, Rosenberg J, Coffelt SB, Kittrell F, Zhang Y, Creighton CJ, Fuqua SA, Medina D, Machado HL.2017Macrophages promote the progression of premalignant mammary lesions to invasive cancer. Oncotarget 850731–50746. (10.18632/oncotarget.14913) - DOI - PMC - PubMed
    1. Edgar VA, Silberman DM, Cremaschi GA, Zieher LM, Genaro AM.2003Altered lymphocyte catecholamine reactivity in mice subjected to chronic mild stress. Biochemical Pharmacology 6515–23. (10.1016/s0006-2952(0201457-0) - DOI - PubMed

Publication types