Global stroke statistics 2022
- PMID: 35975986
- PMCID: PMC9980380
- DOI: 10.1177/17474930221123175
Global stroke statistics 2022
Abstract
Background: Contemporary data on stroke epidemiology and the availability of national stroke clinical registries are important for providing evidence to improve practice and support policy decisions.
Aims: To update the most current incidence, case-fatality, and mortality rates on stroke and identify national stroke clinical registries worldwide.
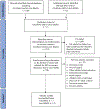
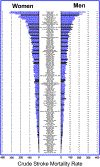
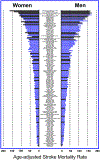
Methods: We searched multiple databases (based on our existing search strategy) to identify new original papers, published between 1 November 2018 and 15 December 2021, that met ideal criteria for data on stroke incidence and case-fatality, and added these to the studies reported in our last review. To identify national stroke clinical registries, we updated our last search, using PubMed, from 6 February 2015 until 6 January 2022. We also screened reference lists of review papers, citation history of papers, and the gray literature. Mortality codes for International Classification of Diseases (ICD)-9 and ICD-10 were extracted from the World Health Organization (WHO) for each country providing these data. Population denominators were obtained from the United Nations (UN) or WHO (when data were unavailable in the UN database). Crude and adjusted stroke mortality rates were calculated using country-specific population denominators, and the most recent years of mortality data available for each country.
Results: Since our last report in 2020, there were two countries (Chile and France) with new incidence studies meeting criteria for ideal population-based studies. New data on case-fatality were found for Chile and Kenya. The most current mortality data were available for the year 2014 (1 country), 2015 (2 countries), 2016 (11 countries), 2017 (10 countries), 2018 (19 countries), 2019 (36 countries), and 2020 (29 countries). Four countries (Libya, Solomon Islands, United Arab Emirates, and Lebanon) reported mortality data for the first time. Since our last report on registries in 2017, we identified seven more national stroke clinical registries, predominantly in high-income countries. These newly identified registries yielded limited information.
Conclusions: Up-to-date data on stroke incidence, case-fatality, and mortality continue to provide evidence of disparities and the scale of burden in low- and middle-income countries. Although more national stroke clinical registries were identified, information from these newly identified registries was limited. Highlighting data scarcity or even where a country is ranked might help facilitate more research or greater policy attention in this field.
Keywords: Incidence; case-fatality rate; epidemiology; mortality; stroke; worldwide.
Conflict of interest statement
Declaration of conflicting interests
The author(s) declared no potential conflicts of interest with respect to the research, authorship, and/or publication of this article.
Figures


References
-
- Kim J, Thayabaranathan T, Donnan GA, Howard G, Howard VJ, Rothwell PM, et al. Global Stroke Statistics 2019. Int J Stroke 2020; 15: 819–838. - PubMed
-
- Thrift AG, Cadilhac DA, Thayabaranathan T, Howard G, Howard VJ, Rothwell PM, et al. Global Stroke Statistics. Int J Stroke 2014; 9: 6–18. - PubMed
-
- Thrift AG, Thayabaranathan T, Howard G, Howard VJ, Rothwell PM, Feigin VL, et al. Global stroke statistics. Int J Stroke 2017; 12: 13–32. - PubMed
-
- Cadilhac DA, Kim J, Lannin NA, Kapral MK, Schwamm LH, Dennis MS, et al. National stroke registries for monitoring and improving the quality of hospital care: a systematic review. Int J Stroke 2016; 11: 28–40. - PubMed
-
- Sudlow CL and Warlow CP. Comparing stroke incidence worldwide: what makes studies comparable. Stroke 1996; 27: 550–558. - PubMed
Publication types
MeSH terms
Grants and funding
LinkOut - more resources
Full Text Sources
Medical
Miscellaneous

