. 2023 Mar 1;77(3):802-815.
doi: 10.1002/hep.32733. Epub 2023 Feb 17.

Adeno-associated virus serotype 2 capsid variants for improved liver-directed gene therapy

Affiliations

Adeno-associated virus serotype 2 capsid variants for improved liver-directed gene therapy

Nadja Meumann et al. Hepatology. .

Abstract

Background and aims: Current liver-directed gene therapies look for adeno-associated virus (AAV) vectors with improved efficacy. With this background, capsid engineering is explored. Whereas shuffled capsid library screenings have resulted in potent liver targeting variants with one first vector in human clinical trials, modifying natural serotypes by peptide insertion has so far been less successful. Here, we now report on two capsid variants, MLIV.K and MLIV.A, both derived from a high-throughput in vivo AAV peptide display selection screen in mice.

Approach and results: The variants transduce primary murine and human hepatocytes at comparable efficiencies, a valuable feature in clinical development, and show significantly improved liver transduction efficacy, thereby allowing a dose reduction, and outperform parental AAV2 and AAV8 in targeting human hepatocytes in humanized mice. The natural heparan sulfate proteoglycan binding ability is markedly reduced, a feature that correlates with improved hepatocyte transduction. A further property that might contribute to the improved transduction efficacy is the lower capsid melting temperature. Peptide insertion also caused a moderate change in sensitivity to human sera containing anti-AAV2 neutralizing antibodies, revealing the impact of epitopes located at the basis of the AAV capsid protrusions.

Conclusions: In conclusion, MLIV.K and MLIV.A are AAV peptide display variants selected in immunocompetent mice with improved hepatocyte tropism and transduction efficiency. Because these features are maintained across species, MLIV variants provide remarkable potential for translation of therapeutic approaches from mice to men.


Conflict of interest statement

Leszek Lisowski owns stock in LogicBio Therapeutics. He received grants from Gyroscope Therapeutics and DiNAQOR. Joachim Schwäble advises BioMarin Pharmaceutical. He received grants from uniQure Biopharma. Hildegard Büning, Nadja Meumann, Joachim Schwäble, and Karin Nien‐Huber are filed as inventors in a patent on MLIV.K and MLIV.A held by Fraunhofer‐Gesellschaft.

Figures

None
Graphical abstract
FIGURE 1
FIGURE 1
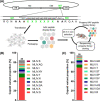
Schematic representation of in vivo high‐throughput adeno‐associated virus (AAV) peptide display selection and capsid variant contribution to the total pool. (A) AAV2 peptide display library production and in vivo high‐throughput selection. The 50 most abundant capsid variants identified in the nontumor liver tissue of (B) transforming growth factor (TGF) α/c‐myc hepatocellular carcinoma (HCC) mouse model and (C) Hepa129‐grafted HCC mouse model after three rounds of in vivo selection. Proportion of variants on total pool is presented as percentage, setting total next‐generation sequencing reads in the nontumor liver tissue to 100%. The total percentage of the 50 most abundant capsid variants is indicated. The 10 most abundant capsid variants are listed and color‐coded. Cherry red (lowest bar) to dark purple (top bar) equals the first to the tenth rank. Capsid variants with the same nomenclature are identical and were found in both models. ITR, inverted terminal repeat; NNB, N represents any of the four bases, B represents cytosine, guanine, or thymine
FIGURE 2
FIGURE 2
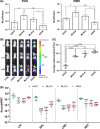
MLIV.K and MLIV.A show hepatocyte tropism in primary cells and in vivo. (A) Transduction of primary human hepatocytes (PHH; n = 4) and primary murine hepatocytes (PMH; n = 3) with MLIV.K and MLIV.A compared with adeno‐associated virus (AAV) 2 (parental serotype) and AAV8 (state‐of‐the‐art reference). Primary cells were transduced with indicated vectors delivering sc.AAV.SFFV.Fluc (genomic particles of infection [GOI] 1 × 104). After 72 h, firefly luciferase (Fluc) activity was measured as relative light units (RLU) in cell lysates by luciferase assay and normalized to total protein content. Data shown in log10‐scale as mean RLU/protein with SD. (B) Animals were intravenously (i.v.) injected with 5 × 1011 particles of indicated vectors delivering sc.AAV.SFFV.Fluc genomes, and Fluc was monitored for 28 days. Representative images of in vivo imaging system (IVIS) measurements at day 7 (d7), day 14 (d14), and day 28 (d28). AAV2: n = 4; MLIV.K: n = 4; MLIV.A: n = 5; AAV8: n = 6. CTRL (nontreated): n = 2. (C) Average radiance (p/s/cm2/sr) measured over liver on day 28. Data shown in log10‐scale as average RLU with means and SD. (D) AAV vector genomes measured by relative quantitative polymerase chain reaction (qPCR) quantification of DNA samples isolated from liver (LIV), spleen (SPL), lung (LNG), and heart (HRT) on day 28. Data shown in log10‐scale as efficiency‐scaled ratio of Fluc to murine hypoxanthine‐guanine phosphoribosyltransferase (mHPRT) with means and SD. Statistics: (A,C) ordinary one‐way ANOVA with log10‐transformed data. (A: p = 0.0006; C: p < 0.0001); Tukey's multiple comparisons; (D) two‐way ANOVA within each tissue group with log10‐transformed data. (Interaction tissue/AAV: p ≤ 0.001; tissue: p ≤ 0.0001; AAV: p ≤ 0.0001); Dunnett's multiple comparisons with AAV2 as control group; *p < 0.05; **p < 0.01; ***p < 0.001; ****p ≤ 0.0001
FIGURE 3
FIGURE 3
Reduced affinity and dependency of MLIV variants on heparan sulfate proteoglycan (HSPG) compared with adeno‐associated virus (AAV) 2. (A) Heparin affinity chromatography of MLIV.K and MLIV.A compared with AAV2 (n = 3). Vectors encoding for sc.CMV.GFP were loaded on a heparin affinity column, and flow‐through (FT) and wash (WS) fraction were collected. AAVs were eluted by a salt gradient of sodium chloride (NaCl) (0.2–1.1 M) in PBS/MgCl2/KCl (wash buffer [0.137 M NaCl]), and elution fractions were collected. Samples were quantified by quantitative polymerase chain reaction (qPCR). Data are shown in linear scale as mean percentage of total vector genomes with SD. (B) Heparin competition assay with MLIV.K and MLIV.A compared with AAV2 on Pop10 hepatocyte cell line (n = 4). Indicated vectors delivering sc.SFFV.Fluc were preincubated with increasing heparin concentrations (0–24 U/ml) for 30 min at RT, thereafter Pop10 were transduced with genomic particles of infection (GOI) 1 × 103. After 24 h, luciferase activity in cell lysates was measured and normalized to mock‐treated AAV (0 U/ml heparin) transduction. Data are shown in linear scale as mean relative light units (RLU) in % of mock‐treated with SD. Statistics: two‐way ANOVA within each heparin concentration group (Interaction concentration/AAV: p < 0.0001; concentration: p < 0.0001; AAV: p < 0.0001; concentration: p < 0.0001; AAV: p < 0.0001); Dunnett's multiple comparisons with AAV2 as the control group; *p < 0.05; **p < 0.01; ***p < 0.001; ****p < 0.0001
FIGURE 4
FIGURE 4
Comparison of adeno‐associated virus (AAV) 2 structure and heparin binding to structural models of MLIV.K and MLIV.A. (A) Overlay of variable region (VR)VIII loop tertiary structure of MLIV.K (orange) and MLIV.A (blue) with AAV2 (green). Capsid variant sequences include wild‐type AAV2 sequence RGN[…]R and left (AAA) and right (AA) peptide linker. Highlighted AA residues are illustrated as stick representation. (B) Surface model of heparin docking in the heparin‐binding pocket of AAV2, MLIV.K, and MLIV.A viral protein (VP) 3 trimer. (C) Closeup of heparin interactions with the VRIII loop, with crucial residues highlighted in stick representation. For clarity, residue numbering follows the AAV2 numbering scheme, with exception of K591 (in peptide insertion of MLIV.K, orange) and H596 (in peptide insertion of MLIV.A, blue). (D) Violin plot of the distance between R585 and R588/R600 in AAV2, MLIV.K, and MLIV.A MD simulations. For each variant, three 500 ns long simulations were performed
FIGURE 5
FIGURE 5
Capsid variants mediate correction of blood clotting factor 9 (FIX) deficiency in hemophilia B (HB) mice. Animals were administered with 5 × 1010 particles of indicated vectors delivering scAAV.LP1.hFIX genomes. HB CTRL: nontreated HB (FIX−/−) mouse model; Bl6: healthy mouse control. (A) FIX activity analyzed by activated partial thromboplastin time (aPTT) measurement at 1 week (W1), 2 weeks (W2), and (A + B) 8 weeks (W8) post transduction (p.t.). normalized to human serum reference standard; because of background blood clotting effects, all samples were spiked with HB serum. Data shown in (A) log10‐scale and (B) linear scale as FIX activity in % of normal FIX activity with mean and SD. (C) Human blood clotting factor (hFIX) serum level analyzed by enzyme‐linked immunosorbent assay (ELISA) W2 p.t.; normalized to human serum reference standard. Data shown in log10‐scale as hFIX antigen (AG) in nanograms per milliliter with mean and SD. Animal cohorts aPTT: adeno‐associated virus (AAV) 2 n(W1) = 6/n(W2) = 7/n(W8) = 7; MLIV.K n(W1) = 9/n(W2) = 10/n(W8) = 8; MLIV.A n(W1) = 8/n(W2) = 10/n(W8) = 9; n(W1) = 8/n(W2) = 10/n(W8) = 9; AAV8 n(W1) = 10/n(W2) = 10/n(W8) = 8; HB CTRL: n(W1) = 9/n(W2) = 9/n(W8) = 6; Bl6 CTRL: n(W1) = 9/n(W2) = 10/n(W8) = 10. Animal cohorts ELISA: AAV2 n(W1) = 6/n(W2) = 7/n(W8) = 6; MLIV.K n(W1) = 9/n(W2) = 10/n(W8) = 1 n(W1) = 8/n(W2) = 10/n(W8) = 9; MLIV.A n(W1) = 7/n(W2) = 10/n(W8) = 3; AAV8 n(W1) = 8/n(W2) = 10/n(W8) = 4; HB CTRL: n(W1) = 9/n(W2) = 9/n(W8) = 3; Bl6 CTRL: n(W1) = 9/n(W2) = 10/n(W8) = 5. Statistics: (B,C) ordinary one‐way ANOVA with log10‐transformed data, Tukey's multiple comparisons; *p < 0.05; **p < 0.01; ***p < 0.001; ****p < 0.0001. For simplification, the statistical significances of AAV2 vs. MLIV.K and MLIV.A; AAV8 vs. MLIV.K and MLIV.A; and HB CTRL vs. MLIV.K and MLIV.A are shown exclusively (see Supporting Information S6 for complete post‐hoc p‐value reports).
FIGURE 6
FIGURE 6
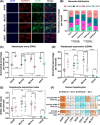
MLIV.K and MLIV.A efficiently transduce human and mouse hepatocytes in the humanized (h)FRG mouse model. (A) Representative immunohistochemical liver tissue analysis of the hFRG mouse model (n = 1) administered with 5 × 1010 particles of indicated vectors delivering ss.AAV.LSP.eGFP.BC genomes after 7 days. Red: human glyceraldehyde‐3‐phosphate dehydrogenase (GAPDH); green: adeno‐associated virus (AAV) vector‐expressed eGFP; blue: 4′6‐diamidino‐2‐phenylindole (DAPI) (nuclei). Scale bar, 100 μm. (B–F) In vivo comparison of cell entry (DNA) and functional transduction (complementary DNA [cDNA]) of MLIV variants in the xenograft liver of the hFRG mouse model (B–E: n = 1; F: n = 2) administered with an equimolar pool of the indicated vectors (defined as input) delivering ss.AAV.LSP.eGFP.BC genomes (n = 8 uniquely barcoded genomes per capsid, 1 × 1010 particles per capsid) after (B–E) 1 and (F) 2 week(s). (B) Percentages of next‐generation sequencing reads assigned to each capsid at entry (DNA reads normalized to input DNA reads) and expression (cDNA reads normalized to input DNA reads) level in human and murine hepatocytes. Data are shown in linear scale as % of reads in parts‐of‐a‐whole bars. (C) Hepatocyte entry index per BC (DNA reads normalized to input DNA reads) in human (gray diamonds) and murine (clear diamonds) hepatocytes. (D) Overall expression per BC in hepatocytes (cDNA reads normalized to input DNA reads) in human and murine hepatocyte populations. (E) Hepatocyte expression index per BC (cDNA reads normalized to DNA reads). (F) Average human hepatocyte entry (DNA reads normalized to input DNA reads), overall expression (cDNA reads normalized to input DNA reads), and expression index (cDNA reads normalized to DNA reads). (C–E) Data are shown in linear scale as the respective ratio (C,D) in % (C–E) with mean and SD. Statistics: (B–E) two‐way ANOVA (interaction species/AAV: p < 0.001; Species: p < 0.0001; AAV: p < 0.0001), Tukey's multiple comparisons test; (F) Ordinary one‐way ANOVA (p < 0.0001), Tukey’s multiple comparisons test; For a clear overview, only the following statistical (non)significances are depicted: (C–E) AAV2 human and murine hepatocytes vs. the equivalent hepatocyte population of MLIV.K and MLIV.A; AAV8 human hepatocytes vs. MLIV.K and MLIV.A human hepatocytes; human vs. murine hepatocytes within each group. *p < 0.05; **p < 0.01; ***p < 0.001; ****p < 0.0001 (see Supporting Information S6 for complete post‐hoc p‐value reports of 6C–F). eGFP, enhanced green fluorescent protein; RI, replacement index

References

    1. ASGCT. Gene, Cell, and RNA Therapy Landscape [Internet]. Q2 2021 Quarterly Data Report. https://asgct.org/global/documents/asgct‐pharma‐intelligence‐quarterly‐r... (2021). Accessed 6 Feb 2022.
    1. Keeler AM, Flotte TR. Recombinant adeno‐associated virus gene therapy in light of luxturna (and Zolgensma and Glybera): where are we, and how did we get here? Annu Rev Virol. 2019;6:601–21. - PMC - PubMed
    1. Croteau SE, Wang M, Wheeler AP. 2021 clinical trials update: innovations in hemophilia therapy. Am J Hematol. 2021;96:128–44. - PubMed
    1. Rodríguez‐Márquez E, Meumann N, Büning H. Adeno‐associated virus (AAV) capsid engineering in liver‐directed gene therapy. Expert Opin Biol Ther. 2021;21:749–66. - PubMed
    1. Boutin S, Monteilhet V, Veron P, Leborgne C, Benveniste O, Montus MF, et al. . Prevalence of serum IgG and neutralizing factors against adeno‐associated virus (AAV) types 1, 2, 5, 6, 8, and 9 in the healthy population: implications for gene therapy using AAV vectors. Hum Gene Ther. 2010;21:704–12. - PubMed

Publication types

Supplementary concepts