

Guided interactive image segmentation using machine learning and color-based image set clustering
- PMID: 35976110
- PMCID: PMC9525009
- DOI: 10.1093/bioinformatics/btac547
Guided interactive image segmentation using machine learning and color-based image set clustering
Abstract
Motivation: Over the last decades, image processing and analysis have become one of the key technologies in systems biology and medicine. The quantification of anatomical structures and dynamic processes in living systems is essential for understanding the complex underlying mechanisms and allows, i.e. the construction of spatio-temporal models that illuminate the interplay between architecture and function. Recently, deep learning significantly improved the performance of traditional image analysis in cases where imaging techniques provide large amounts of data. However, if only a few images are available or qualified annotations are expensive to produce, the applicability of deep learning is still limited.
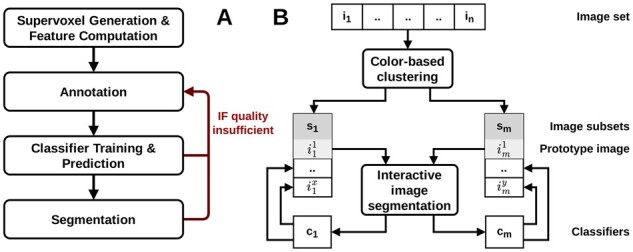
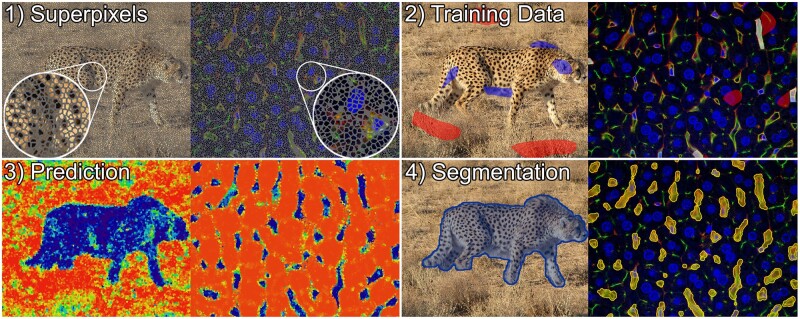
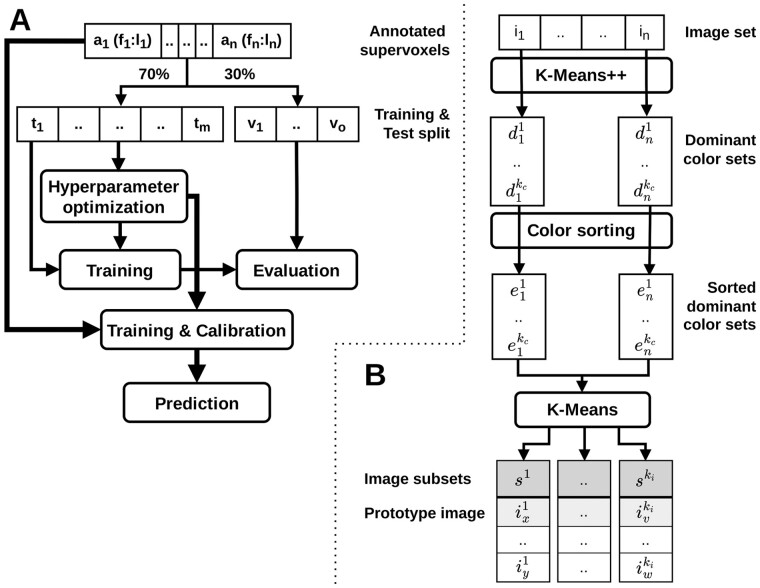
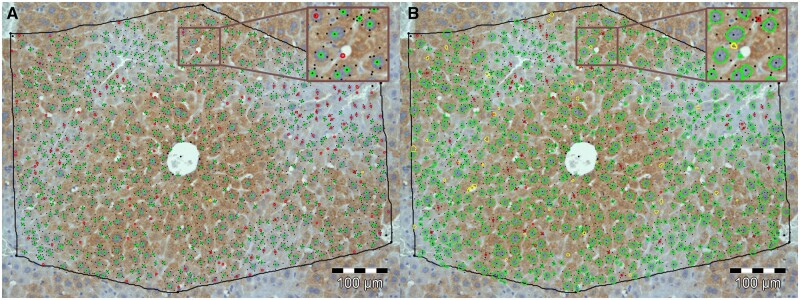
Results: We present a novel approach that combines machine learning-based interactive image segmentation using supervoxels with a clustering method for the automated identification of similarly colored images in large image sets which enables a guided reuse of interactively trained classifiers. Our approach solves the problem of deteriorated segmentation and quantification accuracy when reusing trained classifiers which is due to significant color variability prevalent and often unavoidable in biological and medical images. This increase in efficiency improves the suitability of interactive segmentation for larger image sets, enabling efficient quantification or the rapid generation of training data for deep learning with minimal effort. The presented methods are applicable for almost any image type and represent a useful tool for image analysis tasks in general.
Availability and implementation: The presented methods are implemented in our image processing software TiQuant which is freely available at tiquant.hoehme.com.
Supplementary information: Supplementary data are available at Bioinformatics online.
© The Author(s) 2022. Published by Oxford University Press.
Figures
Similar articles
-
TiQuant: software for tissue analysis, quantification and surface reconstruction.Bioinformatics. 2015 Oct 1;31(19):3234-6. doi: 10.1093/bioinformatics/btv346. Epub 2015 Jun 3. Bioinformatics. 2015. PMID: 26040455
-
Trainable Weka Segmentation: a machine learning tool for microscopy pixel classification.Bioinformatics. 2017 Aug 1;33(15):2424-2426. doi: 10.1093/bioinformatics/btx180. Bioinformatics. 2017. PMID: 28369169
-
PyMIC: A deep learning toolkit for annotation-efficient medical image segmentation.Comput Methods Programs Biomed. 2023 Apr;231:107398. doi: 10.1016/j.cmpb.2023.107398. Epub 2023 Feb 7. Comput Methods Programs Biomed. 2023. PMID: 36773591
-
A review of image analysis and machine learning techniques for automated cervical cancer screening from pap-smear images.Comput Methods Programs Biomed. 2018 Oct;164:15-22. doi: 10.1016/j.cmpb.2018.05.034. Epub 2018 Jun 26. Comput Methods Programs Biomed. 2018. PMID: 30195423 Review.
-
ilastik: interactive machine learning for (bio)image analysis.Nat Methods. 2019 Dec;16(12):1226-1232. doi: 10.1038/s41592-019-0582-9. Epub 2019 Sep 30. Nat Methods. 2019. PMID: 31570887 Review.
Cited by
-
Digital twin demonstrates significance of biomechanical growth control in liver regeneration after partial hepatectomy.iScience. 2022 Dec 5;26(1):105714. doi: 10.1016/j.isci.2022.105714. eCollection 2023 Jan 20. iScience. 2022. PMID: 36691615 Free PMC article.
References
-
- Achanta R. et al. (2012) SLIC superpixels compared to state-of-the-art superpixel methods. IEEE Trans. Pattern Anal. Mach. Intell., 34, 2274–2282. - PubMed
-
- Arganda-Carreras I. et al. (2017) Trainable weka segmentation: a machine learning tool for microscopy pixel classification. Bioinformatics (Oxford, England), 33, 2424–2426. - PubMed
-
- Arthur D., Vassilvitskii S. (2007) k-means++: The advantages of careful seeding. In: Proc. Symp. Discrete Algorithms, pp. 1027–1035.
-
- Barlow R.E. (1972) Statistical inference under order restrictions; the theory and application of isotonic regression. Wiley, New York, USA.
-
- Beare R., Jackway P. (2011) Parallel algorithms via scaled paraboloid structuring functions for spatially-variant and label-set dilations and erosions. In: 2011 International Conference on Digital Image Computing: Techniques and Applications, Noosa, Australia. pp. 180–185.
