. 2022 Sep 27;34(10):3512-3542.
doi: 10.1093/plcell/koac219.

The renaissance and enlightenment of Marchantia as a model system

Affiliations

The renaissance and enlightenment of Marchantia as a model system

John L Bowman et al. Plant Cell. .

Abstract

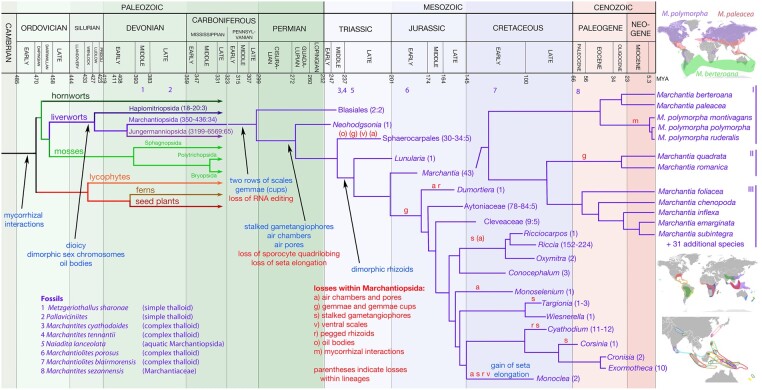
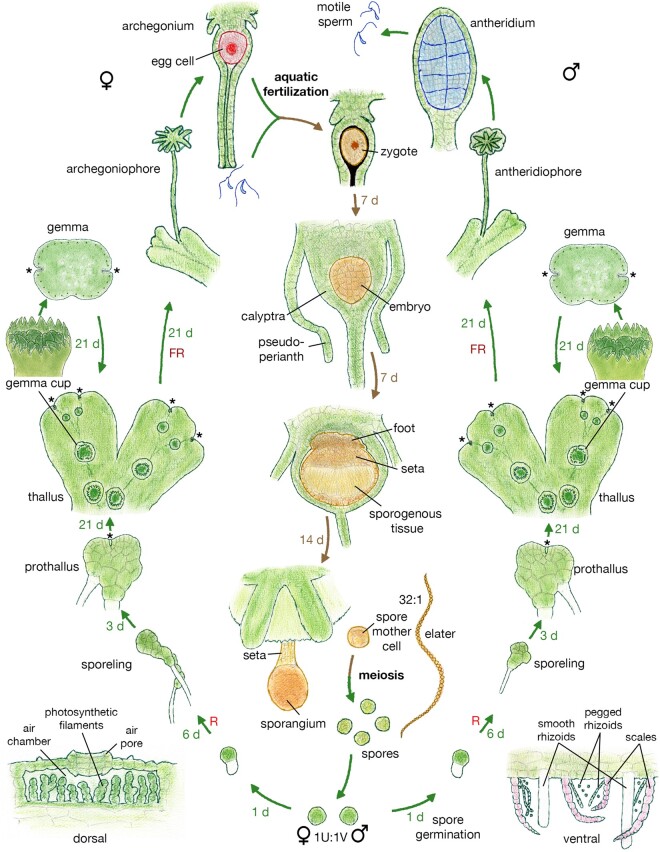
The liverwort Marchantia polymorpha has been utilized as a model for biological studies since the 18th century. In the past few decades, there has been a Renaissance in its utilization in genomic and genetic approaches to investigating physiological, developmental, and evolutionary aspects of land plant biology. The reasons for its adoption are similar to those of other genetic models, e.g. simple cultivation, ready access via its worldwide distribution, ease of crossing, facile genetics, and more recently, efficient transformation, genome editing, and genomic resources. The haploid gametophyte dominant life cycle of M. polymorpha is conducive to forward genetic approaches. The lack of ancient whole-genome duplications within liverworts facilitates reverse genetic approaches, and possibly related to this genomic stability, liverworts possess sex chromosomes that evolved in the ancestral liverwort. As a representative of one of the three bryophyte lineages, its phylogenetic position allows comparative approaches to provide insights into ancestral land plants. Given the karyotype and genome stability within liverworts, the resources developed for M. polymorpha have facilitated the development of related species as models for biological processes lacking in M. polymorpha.


Figures

Figure 1
Figure 1
Phylogenetic context of Marchantia. The consensus phylogenetic history of Marchantia is plotted against the geologic timescale (top). The approximate divergence times of nodes in the trees were adapted from previous estimates of early land plant divergences (Morris et al., 2018) and nodes within the Marchantiopsida (Villarreal et al., 2016); Marchantiopsida phylogeny adapted from Villarreal et al. (2016). As there is substantial uncertainty in dating specific nodes, these should only be taken as an approximation. Further, the timing of the initial divergence between bryophytes and tracheophytes was adjusted to 470 MYA, the time of a shift in cryptospore morphology from irregular groupings (charophycean) to those typical of bryophytic meioses (i.e. land plant; Strother and Taylor, 2018). Previous estimates of divergence times (Villarreal et al., 2016; Morris et al., 2018) were calibrated with the fossil record. Just below the geologic time line are noted fossils relevant to Marchantiophyta evolution (e.g. Oostendorp, 1987; Townrow, 1958; Anderson, 1976; Tomescu et al., 2018; Lundblad, 1954; Brown and Robison, 1976; Hueber, 1961; Hernick et al., 2008; Harris, 1939; Kelber, 2019; de Saporta, 1868). Character evolution within the lineage leading to Marchantia is noted by origins (blue) and losses (red) of traits. Following taxa are numbers of extant species:genera; the lower numbers reflect accepted taxa (triple asterisks in Soderstrom et al., 2016) and the higher numbers include taxa not fully acknowledged (double asterisks in Soderstrom et al., 2016); numbers include accepted subspecies. In families with only a single genus, the genus name is provided rather than a higher order name. The three distinct Marchantia clades are denoted, I, II, and III. The approximate distributions of three clade I species are indicated in the top map. The lower two maps demarcate the distribution of clade III species, with each colour representing a different species, highlighting the diverse and restricted nature of their geographical distributions (Bischler, 1984; Bischler-Causse, 1989; Bischler-Causse, 1993).
Figure 2
Figure 2
Life cycle of M. polymorpha. The haploid stages of the life cycle are depicted in shades of green, except for the female and male gametes; diploid stages of the life cycle are depicted in shades of brown. Gametophytic vegetative growth is largely indistinguishable between males and females, but this is not the case for all liverworts. Asterisks mark the apical meristems during the vegetative stages of the life cycle. Lower left and lower right show cross-sections of the dorsal (left) and ventral (right) regions of the complex thallus. Approximate times for the transitions between stages under optimal growth conditions is listed in days (d). R, red light; FR, far-red light. See text for more detailed description of life cycle stages. Some drawings were adapted from early literature: prothallus (Leitgeb, 1881), gemma and gemma cup (Mirbel, 1835), archegonium and antheridium (Strasburger et al., 1912), elater (Henfrey, 1853), air chamber (Kny, 1890); all other drawings by JLB.
Figure 3
Figure 3
Cytoskeleton and organelles in M. polymorpha cells. A and B, Microtubules and actin filaments in M. polymorpha thallus cells visualized with mCitrine–MpTUB2 (A) and Lifeact–Venus(B), respectively. C, Citrine tagged with the transit peptide of MpSIG2 (TP) is targeted to chloroplasts. D, The endoplasmic reticulum (ER) visualized with mGFP–HDEL. E and F, The Golgi apparatus and trans-Golgi network (TGN) visualized with ST–Venus and mCitrine–MpSYP4, respectively. G and H, Thevacuolar membrane and the plasma membrane (PM) visualized with mCitrine–MpSYP2 and mCitrine–MpSYP13B, respectively. I, Oil body cells expressing mRFP–MpSYP13B and mCitrine–MpSYP12Bunder their own promoters, which target the PMs and the oil body membrane, respectively. J and K, M. polymorpha thallus cells expressing sec–mRFP (J), or sec–mRFP–3×HA (K) under the constitutiveMpSYP2 promoter. sec–mRFP is transported to the extracellular space and oil body lumen in non-oil body and oil body cells, respectively, whereas it is mistargeted to the vacuolar lumen when tagged with 3×HA at the C-terminus. An asterisk in K indicates the oil body. Green, magenta, and blue pseudocolor indicate the fluorescence from mGFP or YFP (mCitrine, Venus, or Citrine), mRFP, and chlorophyll, respectively. Bars = 10 μm.
Figure 4
Figure 4
Pictorial depictions of some research highlights. A, Outline of the genetic regulation of reproduction in M. polymorpha, with the haploid gametophyte (left) and diploid sporophyte (right). Arrows represent promotion and bars represent repression within the genetic networks (as outlined in the text); some interactions are known to be direct, while others may be indirect. Sex is determined by the distinct regulation of the FGMYB-SUF module (red and blue ovals for female and male, respectively), by BPCU carried by the U chromosome in females. B, Growth of wild-type gemmalings in the presence of exogenous auxin leads to suppression of growth and ectopic rhizoid formation. In contrast, reduction of MpARF1 function, as in this line in which an artificial microRNA targeting MpARF1 transcripts is constitutively expressed, results in loss of auxin sensitivity. C, Model for redox control of MpTCP1 activity in the nucleus. Under reducing conditions, MpTCP1 (yellow dots) binds to TAD boundaries and to genomic regions in MpTCP1-rich TADs. In contrast, oxidization causes dissociation of MpTCP1 from the DNA consequently altering gene expression, leading to cell proliferation repression and reduced thallus growth. D, Oil body cells (the bright cells at the arrowheads) are conspicuous near the gemma margin in wild type, but are lacking in Mpc1hdz gemmae. The formation of a toothed marginal cells is also lacking in Mpc1dhz mutants whose margins are smooth. E, Nutrient deprivation induces production of the cell wall localized red pigment auronidin. Ventral and dorsal views are shown in the upper and lower panels, respectively. The ventral image is of a plant on minimal medium. The upper right image shows a close up off a single scale, with the scale edge indicated. Photos courtesy of Nick Albert and Yanfei Zhou. F, The miR529c-MpSPL2 module regulates sexual reproductive development. While the vegetative to reproductive transition in wild-type requires a FR light stimulus, either loss-of-function Mpmir529c alleles and gain-of-function miR529-resistant MpSPL2 (MpSPL2*) developed antheridiophores or archegoniophores in males and female, respectively, in the absence of FR light stimulus. Arrowheads indicate archegoniophores formed at the apical region. The putative gene regulatory pathways in M. polymorpha and A. thaliana are presented at lower right. Scale bars: 5 mm.

References

    1. Aguilar-cruz A, Grimanelli D, Haseloff J, Arteaga-vazquez MA (2019) DNA methylation in Marchantia polymorpha. New Phytol 223: 575–581 - PubMed
    1. Aki SS, Mikami T, Naramoto S, Nishihama R, Ishizaki K, Kojima M, Takebayashi Y, Sakakibara H, Kyozuka J, Kohchi T, et al. (2019) Cytokinin signaling is essential for organ formation in Marchantia polymorpha. Plant & Cell Physiol 60: 1842–1854 - PubMed
    1. Albert NW, Thrimawithana AH, Mcghie TK, Clayton WA, Deroles SC, Schwinn KE, Bowman JL, Jordan BR, Davies KM (2018) Genetic analysis of the liverwort Marchantia polymorpha reveals that R2R3MYB activation of flavonoid production in response to abiotic stress is an ancient character in land plants. New Phytol 218: 554–566 - PubMed
    1. Alcaraz LD, Peimbert M, Barajas HR, Dorantes-acosta AE, Bowman JL, Arteaga-vazquez MA (2018) Marchantia liverworts as a proxy to plants’ basal microbiomes. Sci Rep 8: 12712. - PMC - PubMed
    1. Allen CE (1917) A chromosome difference correlated with sex differences in Sphærocarpos. Science 46: 466–467 - PubMed

Publication types