. 2022 Oct 27;190(3):1896-1914.
doi: 10.1093/plphys/kiac377.

The photosynthesis apparatus of European mistletoe (Viscum album)

Affiliations

The photosynthesis apparatus of European mistletoe (Viscum album)

Lucie Schröder et al. Plant Physiol. .

Abstract

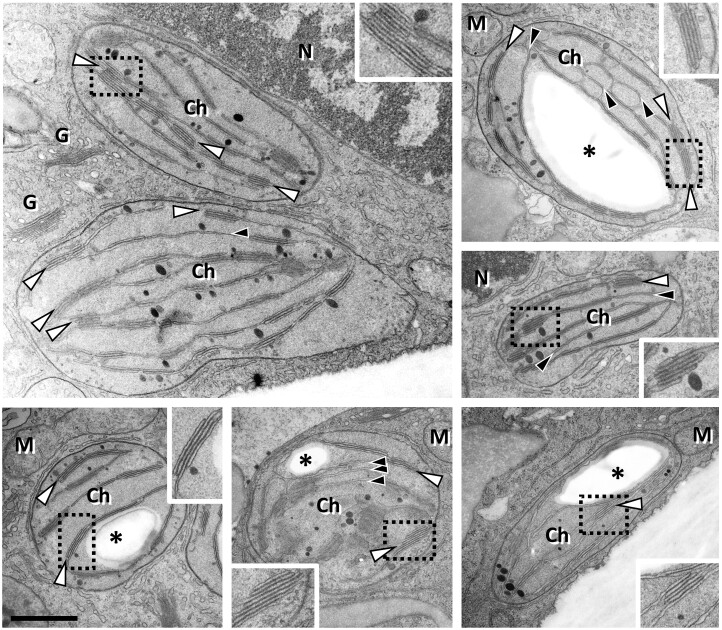
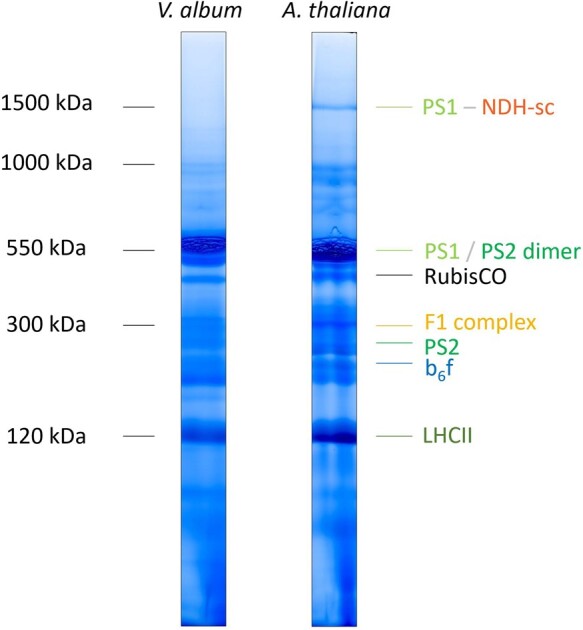
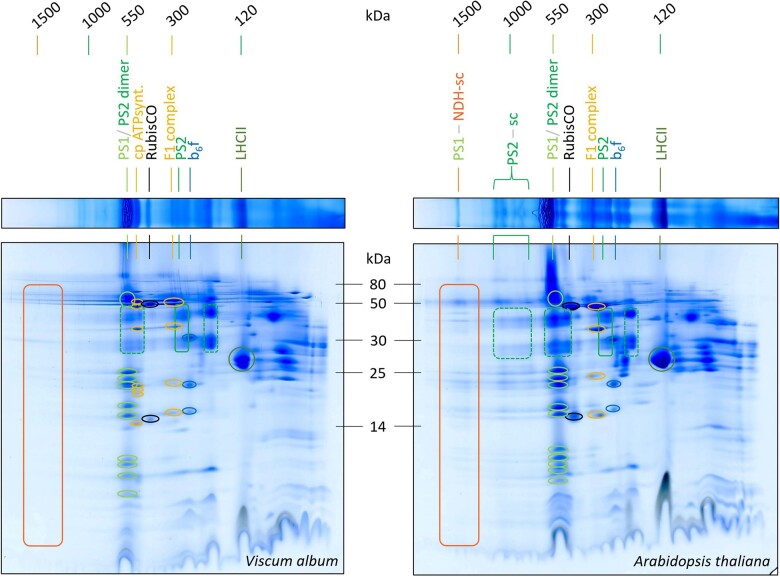
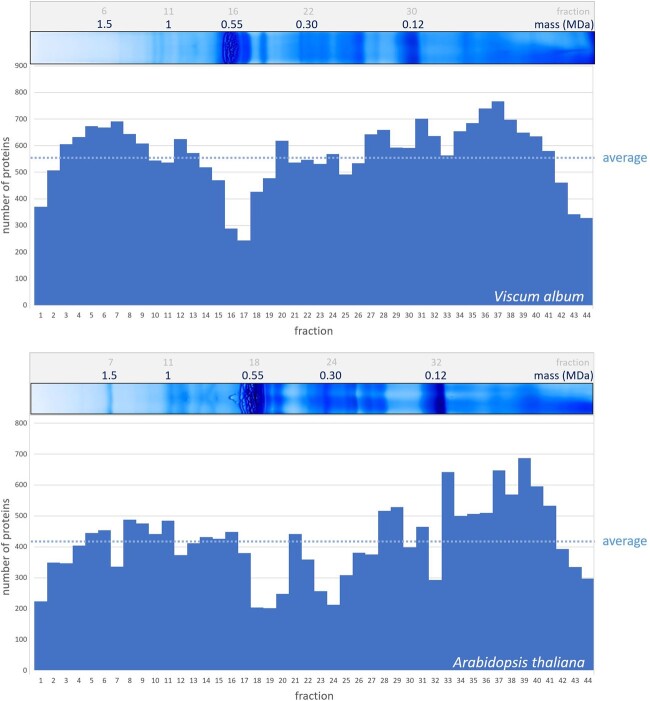
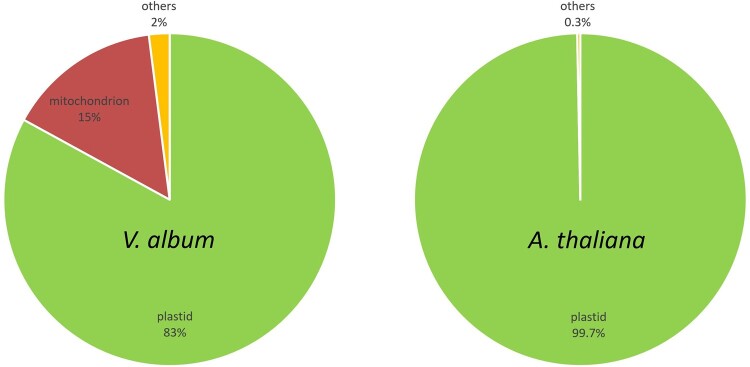
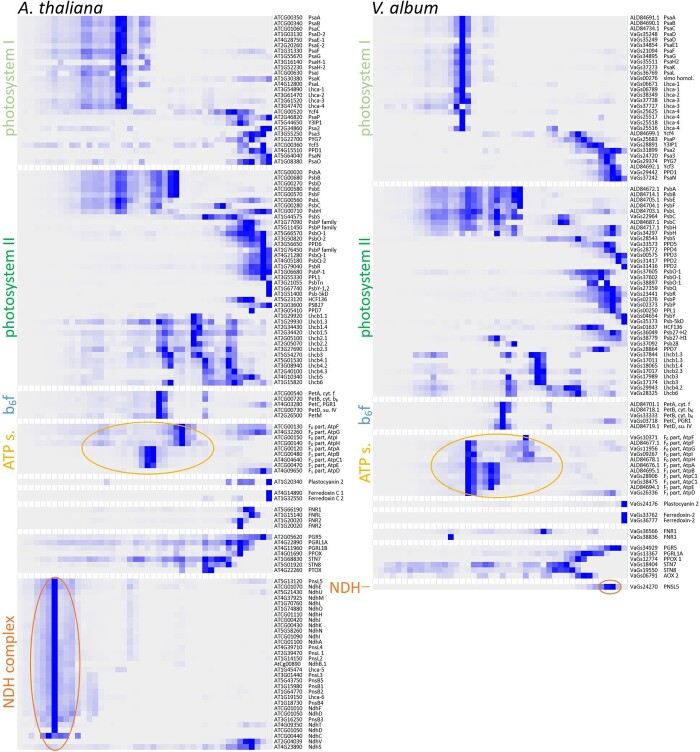
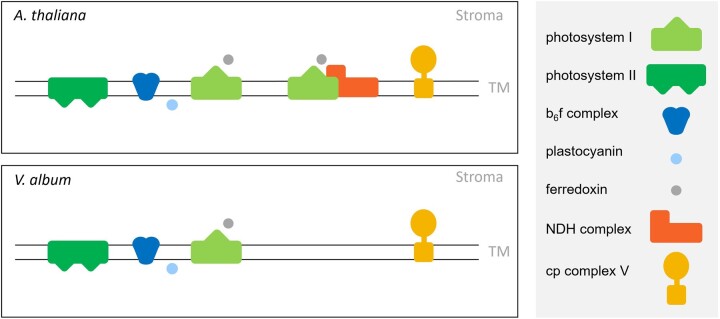
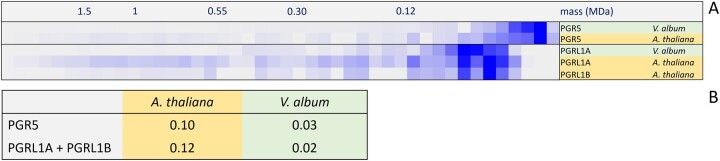
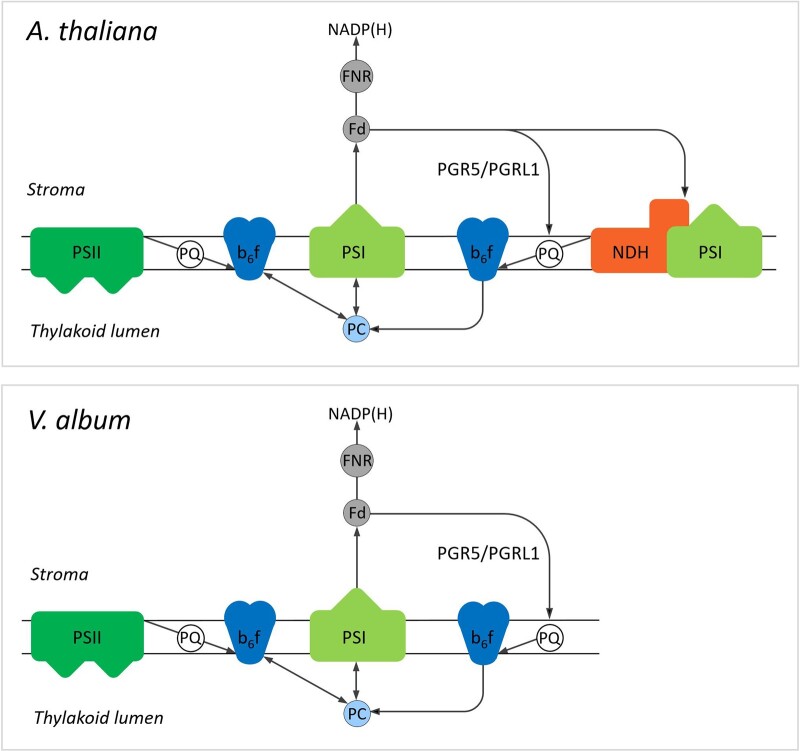
European mistletoe (Viscum album) is known for its special mode of cellular respiration. It lacks the mitochondrial NADH dehydrogenase complex (Complex I of the respiratory chain) and has restricted capacities to generate mitochondrial adenosine triphosphate (ATP). Here, we present an investigation of the V. album energy metabolism taking place in chloroplasts. Thylakoids were purified from young V. album leaves, and membrane-bound protein complexes were characterized by Blue native polyacrylamide gel electrophoresis as well as by the complexome profiling approach. Proteins were systematically identified by label-free quantitative shotgun proteomics. We identified >1,800 distinct proteins (accessible at https://complexomemap.de/va_leaves), including nearly 100 proteins forming part of the protein complexes involved in the light-dependent part of photosynthesis. The photosynthesis apparatus of V. album has distinct features: (1) comparatively low amounts of Photosystem I; (2) absence of the NDH complex (the chloroplast pendant of mitochondrial Complex I involved in cyclic electron transport (CET) around Photosystem I); (3) reduced levels of the proton gradient regulation 5 (PGR5) and proton gradient regulation 5-like 1 (PGRL1) proteins, which offer an alternative route for CET around Photosystem I; (4) comparable amounts of Photosystem II and the chloroplast ATP synthase complex to other seed plants. Our data suggest a restricted capacity for chloroplast ATP biosynthesis by the photophosphorylation process. This is in addition to the limited ATP supply by the mitochondria. We propose a view on mistletoe's mode of life, according to which its metabolism relies to a greater extent on energy-rich compounds provided by the host trees.


Figures

Figure 1
Figure 1
Chloroplasts in V. album leaf cells as revealed by transmission electron microscopy. Chloroplasts (Ch) contain single layered thylakoids (black arrowheads), lipid droplets (black dots) as well as grana (white arrowheads) consisting of stacked thylakoids. In some sections a single starch granule (asterisks) is visible. The boxed areas are shown in the insets in double magnification. N, nucleus; M, mitochondria; G, Golgi. Scale bar: 1 µm for all images; 0.5 µm for all insets.
Figure 2
Figure 2
Analysis of chloroplast protein complexes from A. thaliana and V. album by 1D BN-PAGE. Thylakoid membranes were solubilized using DDM and 1D BN-PAGE was carried out as described in “Materials and methods” section. Gel lanes were Coomassie-stained. The molecular masses of standard protein complexes are given to the left of the gel lanes (in kDa) and the identity of the chloroplast protein complexes from A. thaliana to the right (protein complex identification is based on comparison with reference gels, Järvi et al., 2011). Designations: PS1, Photosystem I; PS2, Photosystem II; NDH, chloroplast Complex I (chloroplast NADH dehydrogenase-like complex); RubisCO, Ribulose-1,5-bisphosphate-carboxylase/-oxygenase; F1 complex, F1 part of the chloroplast ATP synthase; b6f, cytochrome b6f complex; LHCII, Light-harvesting Complex II; PSI-NDH-sc, supercomplex (sc) of NDH and two copies of monomeric PS1. The colors correspond to those given in Figures 2, 6, 8, 10, and Supplemental Figures 2 and 3.
Figure 3
Figure 3
Analyses of chloroplast protein complexes from V. album and A. thaliana by 2D BN/SDS-PAGE. Lanes of 1D BN gels (Figure 2) were transferred horizontally onto SDS gels for electrophoresis in orthogonal direction (see “Materials and methods” section for details). Two-dimensional gels were Coomassie-stained. Molecular masses of standard protein complexes are given above the gels (in kDa); molecular masses of monomeric standard proteins in between the 2D gels (in kDa). The identities of protein complexes are indicated above the gels (identifications based on reference gels, see https://www.gelmap.de/arabidopsis-chloro/ and Behrens et al., 2013). For designations see legend of Figure 2. PS2-sc, supercomplexes (sc) consisting of Photosystem II. Boxes and circles on the 2D gels indicate subunits of defined protein complexes; the color code corresponds to the colors of the names of the protein complexes given above the gels. Note that the Photosystem I-NDH supercomplex and the Photosystem II supercomplexes are present in A. thaliana but not detectable in V. album.
Figure 4
Figure 4
Number of proteins identified in the complexome profiling fractions of V. album and A. thaliana. BN gel lanes were each horizontally dissected into 44 gel slices, and subjected to label-free quantitative shotgun proteomics (Supplemental Figure 4). Top: Identified proteins per gel slice fraction in V. album; evaluation of MS data was based on the V. album gene space database; https://viscumalbum.pflanzenproteomik.de/, Schröder et al. (2022a). Bottom: Identified proteins per gel slice fraction in A. thaliana; evaluation of MS data was based on the Araport11 database (https://www.arabidopsis.org/). The lanes of the 1D BN gel used for complexome profiling are shown above the diagrams (same gel images as shown in Figure 2). MS data of V. album were additionally evaluated using the Araport11 database (Supplemental Figure 5).
Figure 5
Figure 5
Evaluation of the purity of the thylakoid fractions from A. thaliana and V. album by cumulated protein quantities (iBAQ values) assigned to subcellular compartments according to SUBAcon (https://suba.live/). iBAQ values of all proteins identified in all complexome profiling fractions were included in this evaluation. For V. album, the evaluation was based on A. thaliana homologs of the identified proteins because SUBAcon only includes subcellular localization information for A. thaliana.
Figure 6
Figure 6
Selective display of the complexome profiling data for subunits of the Photosystem I, the Photosystem II, the cytochrome b6f complex, the chloroplast ATP synthase complex, the NDH complex, and some further monomeric proteins involved in photosynthesis from A. thaliana (left) and V. album (right). Relative quantities of all proteins (125 proteins in A. thaliana and 96 of V. album) along two BN gel lanes (44 fractions, respectively; Supplemental Figure 4) are displayed as heatmap (dark blue stands for high quantity, light blue/white for low quantity/no detection). For complete complexome profiling maps (1,374 proteins in A. thaliana and 1,833 proteins in V. album) see Supplemental Figure 6. Accession numbers of the proteins in the Araport11 (https://www.arabidopsis.org/) and V. album gene space databases (https://viscumalbum.pflanzenproteomik.de/, Schröder et al., 2022a) are given to the right of the maps; in addition, names/abbreviations of the protein names are displayed. Subunits of the chloroplast ATP synthase and the NDH complex are indicated by circles. For complete complexome profiling data see Supplemental Data Sets S1 and S2. Data also can be accessed and probed at the ComplexomeMap portal at https://complexomemap.de/va_chloroplasts and https://complexomemap.de/at_chloroplasts.
Figure 7
Figure 7
Abundance profiles of PnsL5 from V. album and A. thaliana upon complexome profiling. The molecular masses of standard protein complexes (in MDa) are given above the profiles.
Figure 8
Figure 8
Chloroplast protein complexes involved in photosynthesis in A. thaliana and V. album. Yellow, chloroplast (cp) complex V; orange, cp Complex I (NDH complex); dark blue, cytochrome b6f complex; light green, Photosystem I; dark green, Photosystem II; light blue, plastocyanin; grey, ferredoxin. TM, thylakoid membrane.
Figure 9
Figure 9
Complexome profiling results for PGR5- and PGR5-like proteins (PGRL1) of V. album and A. thaliana. A, Relative abundances of the proteins along the 1D BN gel lane used for complexome profiling. The molecular masses of standard protein complexes (in MDa) are given above the abundance profiles. B, Summed up iBAQ values of the PGR5 and PGRL1 proteins in relation to the total iBAQ values of the corresponding thylakoid fraction (percent of total protein).
Figure 10
Figure 10
Model of the linear and CET pathways in V. album and A. thaliana. In LET, electrons originate from Photosystem II (PSII). They are transferred via plastoquinol (PQ) to the cytochrome b6f complex (b6f) and via plastocyanin (PC) from the cytochrome b6f complex to Photosystem I (PSI). LET terminates by electron transfer from PSI to ferredoxin (Fd) and from Fd to NADP+, which is reduced to NADPH (the latter step is catalyzed by ferredoxin-NADP+ reductase (FNR)). In contrast, in CET, electrons originate from Photosystem I. They are transferred onto Fd, but afterward not further transferred to NADP+, but to the cytochrome b6f complex. In A. thaliana, this electron transfer requires either the PGR5/PGRL1 proteins or the NDH complex, which forms a supercomplex with the Photosystem I. CET is completed by transfer of electrons from the cytochrome b6f complex via PC back to PSI. In V. album, electron transport from Fd to b6f depends entirely on PGR5/PGRL1, since the NDH complex is absent. The colors of the involved components correspond to those introduced in Figure 2. Note that further CET pathways were suggested to occur but so far could not be precisely defined (Nawrocki et al., 2019). The figure is based on Figure 1 in Johnson (2011).

References

    1. Arike L, Valgepea K, Peil L, Nahku R, Adamberg K, Vilu R (2012) Comparison and applications of label-free absolute proteome quantification methods on Escherichia coli. J Proteomics 75: 5437–5448 - PubMed
    1. Arnold S, Braun HP (2022) The complexome profiling approach for direct biochemical analysis of multiprotein assemblies. Biochim Biophys Acta Bioenerg 1863: 148522. - PubMed
    1. Becker H (1986) Botany of European mistletoe (Viscum album L.). Oncology 43 Suppl 1: 2–7 - PubMed
    1. Behrens C, Blume C, Senkler M, Eubel H, Peterhänsel C, Braun HP (2013) The ‘protein complex proteome’ of chloroplasts in Arabidopsis thaliana. J Proteomics 91: 73–83 - PubMed
    1. Berger N, Vignols F, Touraine B, Taupin-Broggini M, Rofidal V, Demolombe V, Santoni V, Rouhier N, Gaymard F, Dubos C (2020) A global proteomic approach sheds new light on potential iron-sulfur client proteins of the chloroplastic maturation factor NFU3. Int J Mol Sci 21: 8121 - PMC - PubMed

Publication types

MeSH terms