. 2023 Feb;33(2):884-892.
doi: 10.1007/s00330-022-09047-0. Epub 2022 Aug 17.

Deep learning for standardized, MRI-based quantification of subcutaneous and subfascial tissue volume for patients with lipedema and lymphedema

Affiliations

Deep learning for standardized, MRI-based quantification of subcutaneous and subfascial tissue volume for patients with lipedema and lymphedema

Sebastian Nowak et al. Eur Radiol. 2023 Feb.

Abstract

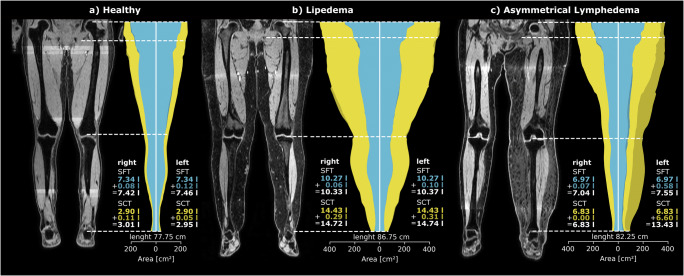
Objectives: To contribute to a more in-depth assessment of shape, volume, and asymmetry of the lower extremities in patients with lipedema or lymphedema utilizing volume information from MR imaging.

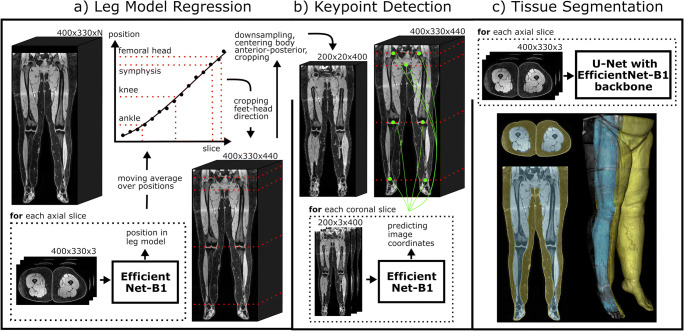
Methods: A deep learning (DL) pipeline was developed including (i) localization of anatomical landmarks (femoral heads, symphysis, knees, ankles) and (ii) quality-assured tissue segmentation to enable standardized quantification of subcutaneous (SCT) and subfascial tissue (SFT) volumes. The retrospectively derived dataset for method development consisted of 45 patients (42 female, 44.2 ± 14.8 years) who underwent clinical 3D DIXON MR-lymphangiography examinations of the lower extremities. Five-fold cross-validated training was performed on 16,573 axial slices from 40 patients and testing on 2187 axial slices from 5 patients. For landmark detection, two EfficientNet-B1 convolutional neural networks (CNNs) were applied in an ensemble. One determines the relative foot-head position of each axial slice with respect to the landmarks by regression, the other identifies all landmarks in coronal reconstructed slices using keypoint detection. After landmark detection, segmentation of SCT and SFT was performed on axial slices employing a U-Net architecture with EfficientNet-B1 as encoder. Finally, the determined landmarks were used for standardized analysis and visualization of tissue volume, distribution, and symmetry, independent of leg length, slice thickness, and patient position.

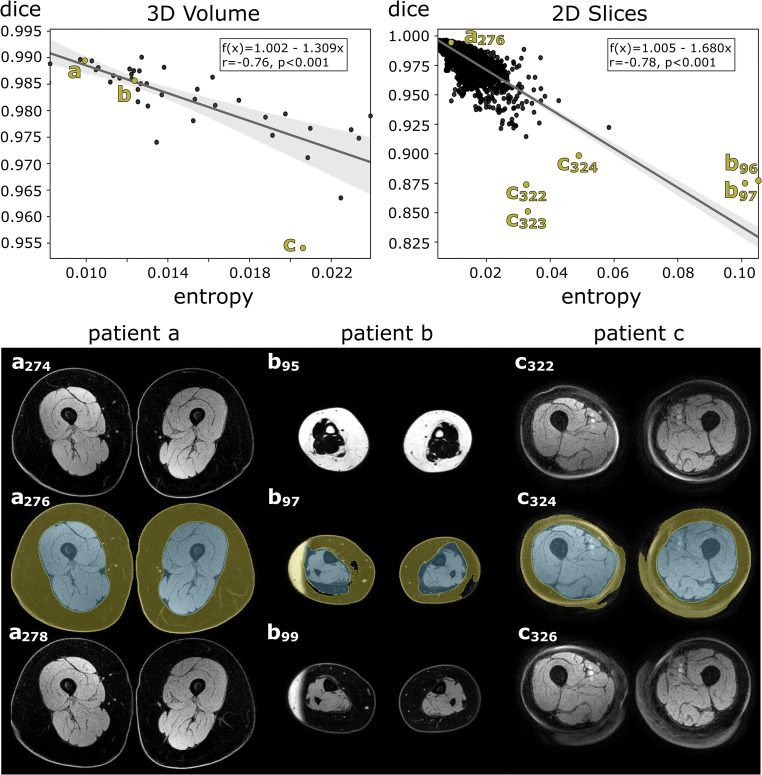
Results: Excellent test results were observed for landmark detection (z-deviation = 4.5 ± 3.1 mm) and segmentation (Dice score: SCT = 0.989 ± 0.004, SFT = 0.994 ± 0.002).

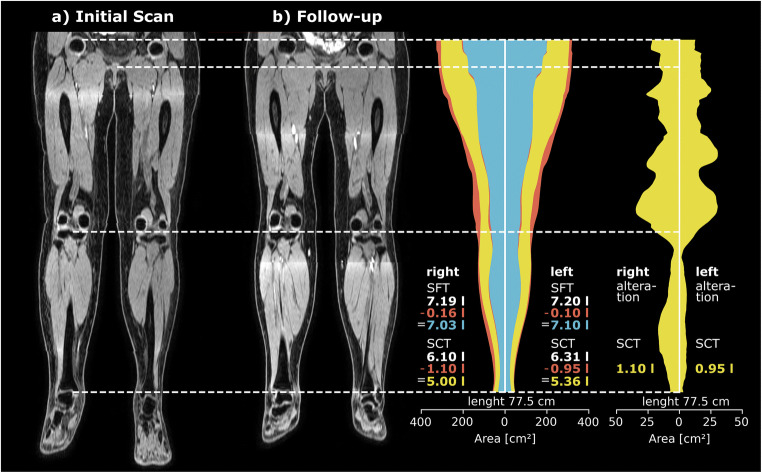
Conclusions: The proposed DL pipeline allows for standardized analysis of tissue volume and distribution and may assist in diagnosis of lipedema and lymphedema or monitoring of conservative and surgical treatments.

Key points: • Efficient use of volume information that MRI inherently provides can be extracted automatically by deep learning and enables in-depth assessment of tissue volumes in lipedema and lymphedema. • The deep learning pipeline consisting of body part regression, keypoint detection, and quality-assured tissue segmentation provides detailed information about the volume, distribution, and asymmetry of lower extremity tissues, independent of leg length, slice thickness, and patient position.

Keywords: Deep learning; Leg; Lymphography; Magnetic resonance imaging; Subcutaneous tissue.


Conflict of interest statement

The authors of this manuscript declare no relationships with any companies, whose products or services may be related to the subject matter of the article.

Figures

Fig. 1
Fig. 1
Overview of the DL pipeline. (a) First, the 3D MRI scan is analyzed in axial slices by a 2.5D EfficientNet-B1 to identify the relative foot-head position of each slice with respect to a leg model consisting of ankles, knees, symphysis, and femoral heads. Afterwards, the image dataset is automatically cropped to the legs. (b) To increase the accuracy of the leg normalization, all landmarks are predicted by another 2.5D EfficientNet-B1 in coronal slices of a down-sampled cropped image using keypoint detection, where the lower limbs were centered slice-by-slice in anterior-posterior direction to the image center. (c) Then, a 2.5D U-Net with EfficientNet-B1 as backbone is used for segmentation of subcutaneous adipose tissue and subfascial tissue volume in axial slices. Finally, the identified landmarks and tissue volumes are combined to allow standardized quantification of the tissues (see Figs. 3 and 4)
Fig. 2
Fig. 2
The two linear regression models developed for quality control of the tissue segmentation convolutional neural network (CNN) are shown in the upper section of the figure. These are used for predicting the segmentation quality of the subcutaneous tissue class in terms of the Dice score. The first regression model was based on the entropy of the entire probability map of the 3D segmentation (top left). A second regression model was developed to predict segmentation quality slice by slice (top right). Gray areas represent 95% confidence intervals. Pearson correlation coefficient (r) along with the two-tailed p-value is given in the boxes. The lower section of the figure shows the 3 channel inputs of the 2.5D segmentation CNN for three patients (a, b, c), respectively, whose entropy of probability map and Dice scores are highlighted in the plot above. The digits represent the slice numbers. Excellent overall segmentation quality with high Dice scores and low entropy was observed for the majority of the entire 3D volumes and 2D slices (c.f. patient a). The slice-wise prediction of the Dice score allows to additionally capture local effects on segmentation quality caused, e.g., by water-fat swap (as seen in patient b) or partial volume artefacts (as seen in patient c). For patients b and c, adjacent artifact-affected slices, which also had low predicted Dice scores, are also highlighted in the plot above
Fig. 3
Fig. 3
Use cases for assessment of volume, distribution, and symmetry utilizing volume information from MRI. On the left (a) is a patient (female, 45 years old) without swelling of the lower extremities, in the middle (b) is a patient with lipedema (female, 46 years old), and on the right (c) is a patient with asymmetric left secondary lymphedema (female, 66 years old). Cumulative axial tissue areas are displayed per slice for each patient, with the distribution of the subfascial tissue (SFT) shown in blue and of the subcutaneous tissue (SCT) in yellow separated for the left and right leg between the femoral heads and the ankles. The detected landmarks are indicated by dotted lines. In order to highlight the differences in tissue volume between the two legs, asymmetric tissue portions are shown in darker blue for SFT and darker yellow for SCT. This is particularly apparent in the illustration of the patient with asymmetrical lymphedema (c). Next to the right and left leg, the tissue volumes are indicated in liters with corresponding colored font, and the total volume of SFT and SCT is indicated with white font
Fig. 4
Fig. 4
Use case for evaluating success of surgical treatment. The figure illustrates normalized visualizations of a pre-therapeutic and 1-year follow-up scan of a lymphedema patient (female, 55 years old) who received surgical treatment (lympho-venous anastomoses). Cumulative axial tissue areas for the follow-up examination are illustrated, with the distribution of the subfascial tissue (SFT) shown in blue and of the subcutaneous tissue (SCT) in yellow separated for the left and the right leg between the femoral heads and the ankles. The differences in tissue volumes between the initial and the follow-up scan, i.e., tissue portions that have decreased in the course of the treatment, are indicated in red color. Next to the right and left leg, the total volume of SFT and SCT measured at the initial examination is indicated with white font, the total volume of SFT and SCT measured at the follow-up examination is indicated with blue and yellow font, and the decrease in volume is indicated with red font. On the right side of the figure, the alterations in SCT volume between initial and follow-up scan is presented in yellow and in a different scale to highlight where predominantly decrease of tissue volume has occurred during the course of treatment

References

    1. Kruppa P, Georgiou I, Biermann N, Prantl L, Klein-Weigel P, Ghods M. Lipedema-pathogenesis, diagnosis, and treatment options. Dtsch Arztebl Int. 2020;117(22-23):396. - PMC - PubMed
    1. Warren AG, Brorson H, Borud LJ, Slavin SA. Lymphedema: a comprehensive review. Ann Plast Surg. 2007;59(4):464–472. doi: 10.1097/01.sap.0000257149.42922.7e. - DOI - PubMed
    1. Halk AB, Damstra RJ. First Dutch guidelines on lipedema using the international classification of functioning, disability and health. Phlebology. 2017;32(3):152–159. doi: 10.1177/0268355516639421. - DOI - PubMed
    1. Reich-Schupke S, Schmeller W, Brauer WJ, et al. S1 guidelines: lipedema. J Dtsch Dermatol Ges. 2017;15(7):758–767. - PubMed
    1. Forner-Cordero I, Szolnoky G, Forner-Cordero A, Kemény L. Lipedema: an overview of its clinical manifestations, diagnosis and treatment of the disproportional fatty deposition syndrome–systematic review. Clin Obes. 2012;2(3-4):86–95. doi: 10.1111/j.1758-8111.2012.00045.x. - DOI - PubMed