Case Reports
. 2022 Nov;42(8):1766-1777.
doi: 10.1007/s10875-022-01346-x. Epub 2022 Aug 17.

SOCS1 Haploinsufficiency Presenting as Severe Enthesitis, Bone Marrow Hypocellularity, and Refractory Thrombocytopenia in a Pediatric Patient with Subsequent Response to JAK Inhibition

Affiliations
Case Reports

SOCS1 Haploinsufficiency Presenting as Severe Enthesitis, Bone Marrow Hypocellularity, and Refractory Thrombocytopenia in a Pediatric Patient with Subsequent Response to JAK Inhibition

Thomas F Michniacki et al. J Clin Immunol. 2022 Nov.

Abstract

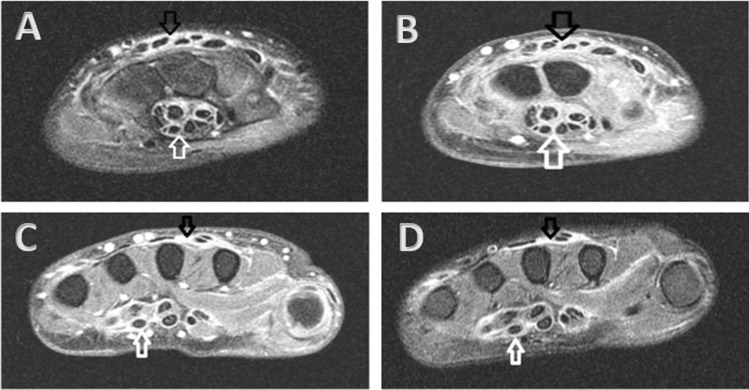
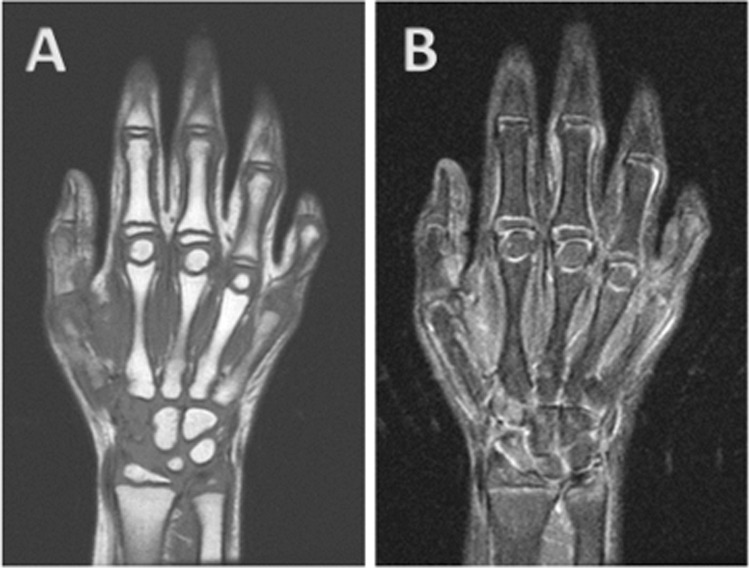
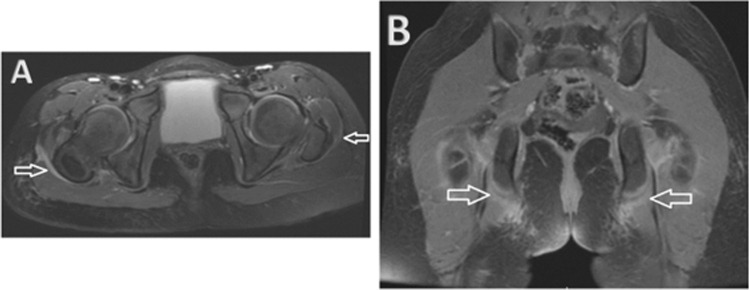
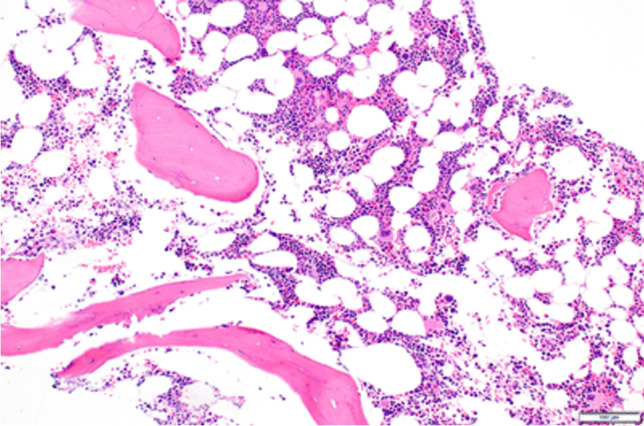
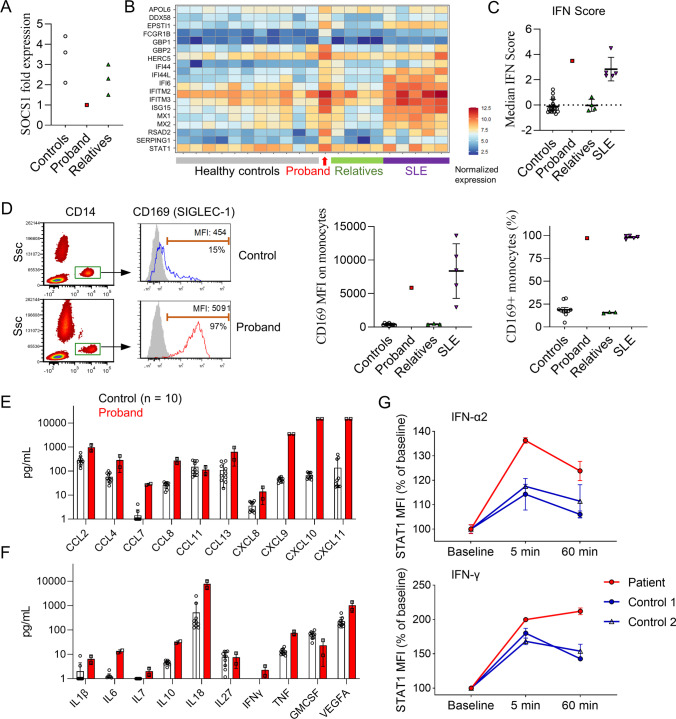
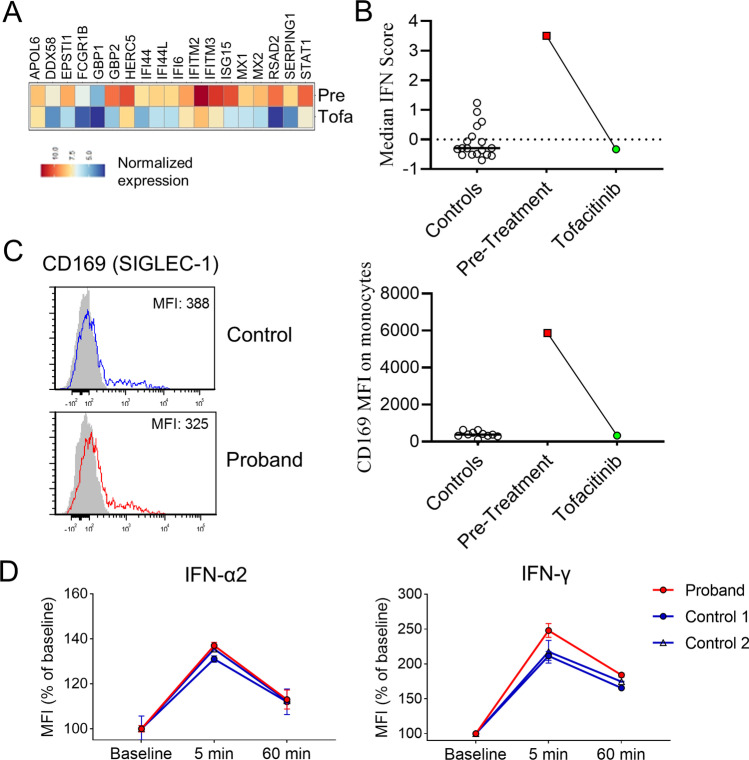
Haploinsufficiency of suppressor of cytokine signaling 1 (SOCS1) is a recently discovered autoinflammatory disorder with significant rheumatologic, immunologic, and hematologic manifestations. Here we report a case of SOCS1 haploinsufficiency in a 5-year-old child with profound arthralgias and immune-mediated thrombocytopenia unmasked by SARS-CoV-2 infection. Her clinical manifestations were accompanied by excessive B cell activity, eosinophilia, and elevated IgE levels. Uniquely, this is the first report of SOCS1 haploinsufficiency in the setting of a chromosomal deletion resulting in complete loss of a single SOCS1 gene with additional clinical findings of bone marrow hypocellularity and radiologic evidence of severe enthesitis. Immunologic profiling showed a prominent interferon signature in the patient's peripheral blood mononuclear cells, which were also hypersensitive to stimulation by type I and type II interferons. The patient showed excellent clinical and functional laboratory response to tofacitinib, a Janus kinase inhibitor that disrupts interferon signaling. Our case highlights the need to utilize a multidisciplinary diagnostic approach and consider a comprehensive genetic evaluation for inborn errors of immunity in patients with an atypical immune-mediated thrombocytopenia phenotype.

Keywords: Autoinflammatory syndrome; Bone marrow hypocellularity; Immune thrombocytopenia; Interferonopathy; JAK inhibition; SOCS1 haploinsufficiency.


Conflict of interest statement

No authors have competing interests. Michniacki, Saad, Hannibal, DeMeyer, Brown, Mohan, Lee, Ngo, Simoneau, Chen, Brodeur, Du, Basiaga, Horst: No disclosures. Frame: Research Funding from Jazz Pharmaceuticals. Walkovich: Horizon Pharmaceuticals: Honoraria, Membership on an entity’s Board of Directors or advisory committees; Pharming: Honoraria, Membership on an entity’s Board of Directors or advisory committees; Swedish Orphan Biovitrum AB (Sobi): Consultancy, Honoraria; X4 Pharmaceuticals: Other: Local PI for clinical trial involving mavorixafor and patients with neutropenia.

Figures

Fig. 1
Fig. 1
Axial MR image of the right wrist demonstrated T2 hyperintense signal (A) with T1 post-contrast enhancement (B) throughout the flexor (white arrow) and extensor (black arrow) tendon sheaths at the level of the carpal tunnel (white arrow). These findings were also seen at the level of the metacarpals on T2 (C) and T1 post-contrast (D) MR images. Findings were bilateral
Fig. 2
Fig. 2
Coronal T2 (A) and T1 (B) images of the right hand showed no bone marrow edema, joint effusion, or erosions. Findings were bilateral
Fig. 3
Fig. 3
(A) Axial T2 images of the pelvis showed thickening and hyperintensity of the iliotibial bands, right greater than left (white arrows), indicating inflammation. (B) Coronal spoiled gradient recalled echo (SPGR) post-contrast sequences showed enhancement at the insertion sites of the hamstring tendons on the ischial tuberosities (white arrows)
Fig. 4
Fig. 4
Bone marrow biopsy pathology showing hypocellularity at 50%
Fig. 5
Fig. 5
Patient’s platelet values with medical interventions noted and response in platelet counts
Fig. 6
Fig. 6
Enhanced interferon response associated with SOCS1 haploinsufficiency. (A) SOCS1 mRNA expression in PBMCs from the proband, unaffected family members (n = 3), and healthy controls (n = 3) measured by quantitative PCR. SOCS1 expression for each individual was normalized to β-actin expression. (B) Heat map display of IFN-inducible genes from bulk RNAseq of PBMC from the proband, healthy controls (n = 11), unaffected family members (n = 4), and patients with active systemic lupus erythematosus (n = 5). Values were normalized to the mean of the healthy control group. (C) Comparison of IFN-inducible gene score derived from bulk RNAseq of PBMC. (D) Flow cytometry plot (left) and comparisons of CD169 expression by mean fluorescence intensity (MFI; middle pane) and by percentage of monocyte with positive staining (right). Gray shade indicates isotype control staining. (E) Quantification of chemokine and (F) cytokine levels in the plasma of healthy controls (n = 10) and the proband (2 replicates) prior to treatment as measured by Olink proximity extension assay. (G) Flow cytometry quantification of phospho-STAT1 induced by IFN-α2 and IFN-γ stimulation in CD14 + in monocytes from healthy controls (n = 2) and the proband (2 replicates each). Data were normalized to baseline MFI. Error bars represent standard deviation in panels (C), (D), (E), (F), and (G)
Fig. 7
Fig. 7
Correction of the interferon signature after treatment with the JAK inhibitor tofacitinib. (A) Heat map display of IFN-inducible gene expression in the proband’s PBMC pre- and post-treatment with tofacitinib. (B) Calculation of IFN-inducible gene score and comparison with healthy controls. (C) Flow cytometry plot (left) and comparisons of CD169 expression by MFI on monocytes. (D) Quantification of phospho-STAT1 induced by IFN-α2 and IFN-γ stimulation in CD14 + in monocytes from healthy controls (n = 2) and the proband 4 weeks after initiation of tofacitinib treatment (2 replicates each). Error bars represent standard deviation in panel (D)

References

    1. Lee PY, et al. Immune dysregulation and multisystem inflammatory syndrome in children (MIS-C) in individuals with haploinsufficiency of SOCS1. J Allergy Clin Immunol. 2020;146(5):1194–1200.e1. doi: 10.1016/j.jaci.2020.07.033. - DOI - PMC - PubMed
    1. Hadjadj J, et al. Early-onset autoimmunity associated with SOCS1 haploinsufficiency. Nat Commun. 2020;11(1):5341. doi: 10.1038/s41467-020-18925-4. - DOI - PMC - PubMed
    1. N. P. D. Liau et al, (2018) “The molecular basis of JAK/STAT inhibition by SOCS1,” Nat Commun, vol. 9, no. 1, Art. no. 1, 10.1038/s41467-018-04013-1 - PMC - PubMed
    1. J Körholz et al 2021 One gene, many facets: multiple immune pathway dysregulation in SOCS1 haploinsufficiency Front Immunol 12 680334 10.3389/fimmu.2021.680334 - PMC - PubMed
    1. Thaventhiran JED, et al. Whole-genome sequencing of a sporadic primary immunodeficiency cohort. Nature. 2020;583(7814):90–95. doi: 10.1038/s41586-020-2265-1. - DOI - PMC - PubMed

Publication types

MeSH terms

Substances