

Development and Validation of Models to Predict Poor Health-Related Quality of Life Among Adult Survivors of Childhood Cancer
- PMID: 35976647
- PMCID: PMC9386537
- DOI: 10.1001/jamanetworkopen.2022.27225
Development and Validation of Models to Predict Poor Health-Related Quality of Life Among Adult Survivors of Childhood Cancer
Abstract
Importance: Risk prediction models are important to identify survivors of childhood cancer who are at risk of experiencing poor health-related quality of life (HRQOL) as they age.
Objective: To develop and validate prediction models for a decline in HRQOL among adult survivors of childhood cancer.
Designs, setting, and participants: This prognostic study included 4755 adults from the Childhood Cancer Survivor Study (CCSS) diagnosed between January 5, 1970, and December 31, 1986, who completed baseline (time 0 [November 3, 1992, to August 28, 2003]) and 2 follow-up (time 1 [February 12, 2002, to May 21, 2005] and time 2 [January 6, 2014, to November 30, 2016]) surveys. Data were analyzed from June 19, 2019, to February 2, 2022.
Exposures: Sociodemographic, lifestyle, and emotional factors, and chronic health conditions (CHCs) were assessed at time 0 and time 1, and neurocognitive factors were assessed at time 1 to predict HRQOL at time 2 and a decline in HRQOL between time 1 and time 2. Impaired health states were defined as CHC grades 2 to 4 using the modified Common Terminology Criteria for Adverse Events, version 4.03, and mental and neurocognitive status as 1 SD or more below reference levels.
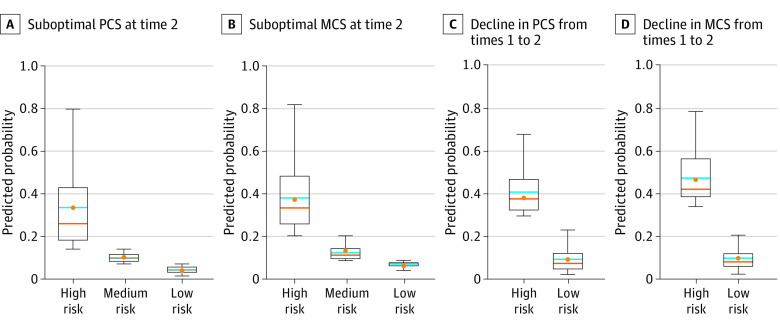
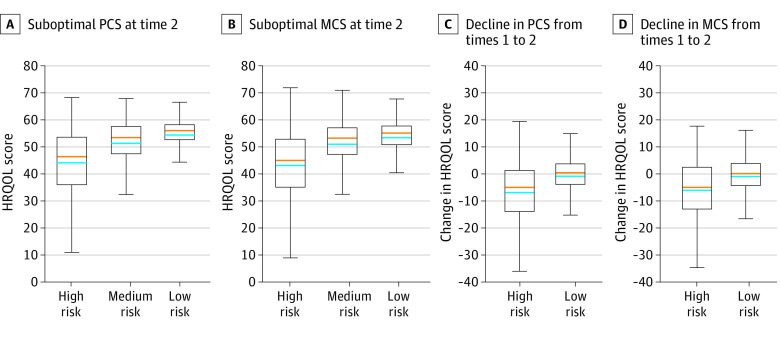
Main outcomes and measures: Health-related quality of life was operationalized using the Medical Outcomes Study 36-Item Short Form Health Survey Physical (PCS) and Mental (MCS) Component Summary and classified by optimal (≥40) or suboptimal (<40) at each point (main outcome). A decline in HRQOL was defined as a change from optimal to suboptimal between time 1 and time 2. Multivariable logistic regression identified factors associated with HRQOL decline. The cohort was randomly split into training (80%) and test (20%) data sets for model development and validation; the area under the receiver operating characteristic curve was used to evaluate prediction performance.
Results: A total of 4755 adults (mean [SD] age at time 0, 24.3 [7.6] years; 2623 [55.2%] women) were included in the analysis. Between time 1 and time 2, 285 of 3294 survivors (8.7%) had declining PCS and 278 of 3294 (8.4%) had declining MCS. Risk factors associated with PCS decline included female sex (odds ratio [OR], 1.67 [95% CI, 1.25-2.24]), family income less than $20 000 vs $80 000 or more (OR, 2.00 [95% CI, 1.21-3.30]), presence of CHCs (OR for neurological, 2.16 [95% CI, 1.51-3.10]; OR for endocrine, 2.25 [95% CI, 1.44-3.52]; OR for gastrointestinal tract, 1.89 [95% CI, 1.32-2.69]; OR for respiratory, 1.66 [95% CI, 1.06-2.59]; OR for cardiovascular, 1.53 [95% CI, 1.14-2.06]), and depression (OR, 1.79 [95% CI, 1.20-2.67]). Risk factors associated with MCS decline included unemployment vs full-time employment (OR, 1.68; [95% CI, 1.19-2.38]), current vs never cigarette smoking (OR, 2.03 [95% CI, 1.37-3.00]), depression (OR, 4.29 [95% CI, 2.44-7.55]), somatization (OR, 1.63 [95% CI, 1.05-2.53]), impaired task efficiency (OR, 1.90 [95% CI, 1.34-2.68]), and impaired organization (OR, 1.67 [95% CI, 1.12-2.48]). The areas under the receiver operating characteristic curve for the test models were 0.74 (95% CI, 0.67-0.81) for declining PCS and 0.68 (95% CI, 0.60-0.75) for declining MCS.
Conclusions and relevance: In this prognostic study of adult survivors of childhood cancer who experienced declining HRQOL, CHCs were associated with a decline in physical HRQOL, whereas current smoking and emotional and neurocognitive impairment were associated with a decline in mental HRQOL. These findings suggest that interventions targeting modifiable risk factors are needed to prevent poor HRQOL in this population.
Conflict of interest statement
Figures
Similar articles
-
Lifestyle factors and health-related quality of life in adult survivors of childhood cancer: A report from the St. Jude Lifetime Cohort Study.Cancer. 2018 Oct 1;124(19):3918-3923. doi: 10.1002/cncr.31647. Epub 2018 Sep 11. Cancer. 2018. PMID: 30204245 Free PMC article.
-
Association of Modifiable Health Conditions and Social Determinants of Health With Late Mortality in Survivors of Childhood Cancer.JAMA Netw Open. 2023 Feb 1;6(2):e2255395. doi: 10.1001/jamanetworkopen.2022.55395. JAMA Netw Open. 2023. PMID: 36763361 Free PMC article.
-
Posttraumatic stress as a contributor to behavioral health outcomes and healthcare utilization in adult survivors of childhood cancer: a report from the Childhood Cancer Survivor Study.J Cancer Surviv. 2019 Dec;13(6):981-992. doi: 10.1007/s11764-019-00822-5. Epub 2019 Nov 5. J Cancer Surviv. 2019. PMID: 31691097 Free PMC article.
-
Psychological status in childhood cancer survivors: a report from the Childhood Cancer Survivor Study.J Clin Oncol. 2009 May 10;27(14):2396-404. doi: 10.1200/JCO.2008.21.1433. Epub 2009 Mar 2. J Clin Oncol. 2009. PMID: 19255309 Free PMC article. Review.
-
Determinants of quality of life as measured with variants of SF-36 in patients with predialysis chronic kidney disease.Saudi Med J. 2018 Jul;39(7):653-661. doi: 10.15537/smj.2018.7.21352. Saudi Med J. 2018. PMID: 29968886 Free PMC article.
Cited by
-
Neighborhood vulnerability and associations with poor health-related quality of life among adult survivors of childhood cancer.JNCI Cancer Spectr. 2024 Nov 1;8(6):pkae088. doi: 10.1093/jncics/pkae088. JNCI Cancer Spectr. 2024. PMID: 39288319 Free PMC article.
-
Improving quality and quantity of life for childhood cancer survivors globally in the twenty-first century.Nat Rev Clin Oncol. 2023 Oct;20(10):678-696. doi: 10.1038/s41571-023-00802-w. Epub 2023 Jul 24. Nat Rev Clin Oncol. 2023. PMID: 37488230 Review.
-
Exploration of the factors influencing the quality of life among adolescents during the COVID-19 pandemic: the data from a cross-sectional study in Shandong.BMC Public Health. 2024 Feb 22;24(1):573. doi: 10.1186/s12889-024-17981-5. BMC Public Health. 2024. PMID: 38388446 Free PMC article.
-
Comparison of long-term quality of life and their predictors in survivors between paediatric and adult nasopharyngeal carcinoma in the intensity-modulated radiotherapy era.BMC Cancer. 2024 Oct 2;24(1):1223. doi: 10.1186/s12885-024-12966-4. BMC Cancer. 2024. PMID: 39358733 Free PMC article.
References
-
- Howlader N, Noone AM, Krapcho M, et al. , eds. SEER Cancer Statistics Review, 1975-2018. April 15, 2021. Accessed July 2, 2022. https://seer.cancer.gov/archive/csr/1975_2018/
-
- Gibson TM, Mostoufi-Moab S, Stratton KL, et al. . Temporal patterns in the risk of chronic health conditions in survivors of childhood cancer diagnosed 1970-99: a report from the Childhood Cancer Survivor Study cohort. Lancet Oncol. 2018;19(12):1590-1601. doi:10.1016/S1470-2045(18)30537-0 - DOI - PMC - PubMed
Publication types
MeSH terms
Grants and funding
LinkOut - more resources
Full Text Sources
Medical
