. 2022 Aug 17;17(8):e0272120.
doi: 10.1371/journal.pone.0272120. eCollection 2022.

Social-ecological vulnerability of fishing communities to climate change: A U.S. West Coast case study

Affiliations

Social-ecological vulnerability of fishing communities to climate change: A U.S. West Coast case study

Laura E Koehn et al. PLoS One. .

Abstract

Climate change is already impacting coastal communities, and ongoing and future shifts in fisheries species productivity from climate change have implications for the livelihoods and cultures of coastal communities. Harvested marine species in the California Current Large Marine Ecosystem support U.S. West Coast communities economically, socially, and culturally. Ecological vulnerability assessments exist for individual species in the California Current but ecological and human vulnerability are linked and vulnerability is expected to vary by community. Here, we present automatable, reproducible methods for assessing the vulnerability of U.S. West Coast fishing dependent communities to climate change within a social-ecological vulnerability framework. We first assessed the ecological risk of marine resources, on which fishing communities rely, to 50 years of climate change projections. We then combined this with the adaptive capacity of fishing communities, based on social indicators, to assess the potential ability of communities to cope with future changes. Specific communities (particularly in Washington state) were determined to be at risk to climate change mainly due to economic reliance on at risk marine fisheries species, like salmon, hake, or sea urchins. But, due to higher social adaptive capacity, these communities were often not found to be the most vulnerable overall. Conversely, certain communities that were not the most at risk, ecologically and economically, ranked in the category of highly vulnerable communities due to low adaptive capacity based on social indicators (particularly in Southern California). Certain communities were both ecologically at risk due to catch composition and socially vulnerable (low adaptive capacity) leading to the highest tier of vulnerability. The integration of climatic, ecological, economic, and societal data reveals that factors underlying vulnerability are variable across fishing communities on the U.S West Coast, and suggests the need to develop a variety of well-aligned strategies to adapt to the ecological impacts of climate change.


Conflict of interest statement

The authors have declared that no competing interests exist.

Figures

Fig 1
Fig 1. Vulnerability assessment framework.
Framework used to determine the coupled social-ecological vulnerability of fishing communities to climate change on the U.S. West Coast. The initial components of the framework are the ecological sensitivity and exposure to climate change of marine resources that fishing communities depend on. Ecological sensitivity and exposure are determined for four climate change variables–temperature, pH, oxygen, and chlorophyll–and are combined to determine ecological risk. Community exposure is derived by weighting ecological risk of species by the economic importance to each community. When community exposure is combined with community sensitivity, this forms community risk to climate change. When community risk is combined with adaptive capacity, which is made up of 15 social indicators, this produces overall community vulnerability which is made up of ecological (yellow), economic (green), and social indicators (blue). Design by SJ Bowden.
Fig 2
Fig 2. Ecological exposure and ecological sensitivity to climate changes for fisheries species.
Ecological risk to climate change (changes in pH, temperature, chlorophyll, and oxygen) which is the Euclidean distance between ecological exposure and ecological sensitivity. Ecological exposure and sensitivity are averaged across the four climate variables (each ranging from 0 to 1) for each climate model and then averaged across three climate models for species in top 90% of landings (by weight) for US West Coast fishing communities. See S2 Table for individual species risk. Transparency of the name corresponds to standard deviation in exposure (more transparent equals higher deviation/uncertainty) across the three climate models (relative to the other species groups).
Fig 3
Fig 3. Percent revenue composition by community for species landed.
Major fishery landings by community by state, where transparency of red is based on percent revenue for that species/catch group (solid red = greater percent revenue). Percent revenue is out of the total revenue for that community, for the species that were in the top 90% of landings for that community. Communities are ordered from highest risk (community exposure combined with community sensitivity [reliance]) to lowest (“Risk” on figure). For communities with the same landings composition (part of the same port group), a random community was picked and plotted (190 communities), to specifically show landings compositions that give high risk. Depending on the random community in each port group, risk will change due to variation in sensitivity but landings composition does not vary. Port group name abbreviations are in “()” and see S5 Table for full port group names. Species are plotted from highest to lowest ecological risk. Communities above the red dotted line are in the top 10 percentile for risk. Overall there are different combinations of species landings that lead to high community risk.
Fig 4
Fig 4. Social indicators and themes that make up adaptive capacity and relation to final adaptive capacity scores.
(A) the four themes of adaptive capacity and individual indicators that make up each. Theme 1 is socioeconomic indicators (orange), theme 2 (green) is household composition and disability, theme 3 (yellow) is minority status and language, and theme 4 (blue) is housing/transportation. (B) The correlation between adaptive capacity and each individual indicator colored by theme. (C) The density distribution of scores for each theme and overall adaptive capacity (where greater values = lower adaptive capacity) for each geographic region.
Fig 5
Fig 5. Community vulnerability as a function of community risk versus adaptive capacity (where greater values = lower adaptive capacity).
Quadrants represent high, medium, or low community vulnerability where communities can have medium vulnerability either be having low adaptive capacity (and low risk) or high adaptive capacity but high risk. Points are color coordinated by state. All states have communities with high vulnerability but the most vulnerable communities are disproportionately represented in Washington and California.
Fig 6
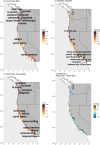
Fig 6. Top communities by risk, adaptive capacity, and vulnerability, as well as difference in rank scores between risk and vulnerability by community.
Communities ranked by risk (top left) and adaptive capacity (top right), community vulnerability (bottom left) across the U.S. West Coast. Communities labeled are those in top 5 percentile of risk, adaptive capacity, or vulnerability. Considering social information (adaptive capacity) compared to solely ecological/economic data (risk) changes which communities are in the top for most imperiled, though others are ranked high across the board. Also, the “difference” (bottom right) is the rank position of the community based on vulnerability (#1 rank is most vulnerable) minus it’s rank position from risk.

References

    1. Bhattachan A, Jurjonas MD, Moody AC, Morris PR, Sanchez GM, Smart LS, et al.. Sea level rise impacts on rural coastal social-ecological systems and the implications for decision making. Environmental Science and Policy. Elsevier Ltd; 2018. pp. 122–134. doi: 10.1016/j.envsci.2018.10.006 - DOI
    1. Kunz M, Mühr B, Kunz-Plapp T, Daniell JE, Khazai B, Wenzel F, et al.. Investigation of superstorm Sandy 2012 in a multi-disciplinary approach. Nat Hazards Earth Syst Sci. 2013;13: 2579–2598. doi: 10.5194/nhess-13-2579-2013 - DOI
    1. Padgett J, DesRoches R, Nielson B, Yashinsky M, Kwon O-S, Burdette N, et al.. Bridge Damage and Repair Costs from Hurricane Katrina. J Bridg Eng. 2008;13: 6–14. doi: 10.1061/(ASCE)1084-0702(2008)13:1(6) - DOI
    1. Wang X, Xu LL, Cui SH, Wang CH. Reflections on coastal inundation, climate change impact, and adaptation in built environment: progresses and constraints. Adv Clim Chang Res. 2020;11: 317–331. doi: 10.1016/j.accre.2020.11.010 - DOI
    1. Cheung WWL, Lam VWY, Sarmiento JL, Kearney K, Watson R, Zeller D, et al.. Large-scale redistribution of maximum fisheries catch potential in the global ocean under climate change. Glob Chang Biol. 2010;16: 24–35. doi: 10.1111/j.1365-2486.2009.01995.x - DOI

Publication types