. 2022 Aug 19;8(33):eabp9245.
doi: 10.1126/sciadv.abp9245. Epub 2022 Aug 17.

High-efficiency quantitative control of mitochondrial transfer based on droplet microfluidics and its application on muscle regeneration

Affiliations

High-efficiency quantitative control of mitochondrial transfer based on droplet microfluidics and its application on muscle regeneration

Jiayu Sun et al. Sci Adv. .

Abstract

Mitochondrial transfer is a spontaneous process to restore damaged cells in various pathological conditions. The transfer of mitochondria to cell therapy products before their administration can enhance therapeutic outcomes. However, the low efficiency of previously reported methods limits their clinical application. Here, we developed a droplet microfluidics-based mitochondrial transfer technique that can achieve high-efficiency and high-throughput quantitative mitochondrial transfer to single cells. Because mitochondria are essential for muscles, myoblast cells and a muscle injury model were used as a proof-of-concept model to evaluate the proposed technique. In vitro and in vivo experiments demonstrated that C2C12 cells with 31 transferred mitochondria had significant improvements in cellular functions compared to those with 0, 8, and 14 transferred mitochondria and also had better therapeutic effects on muscle regeneration. The proposed technique can considerably promote the clinical application of mitochondrial transfer, with optimized cell function improvements, for the cell therapy of mitochondria-related diseases.


Figures
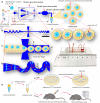
Fig. 1.
Fig. 1.. Schematic of the system setup, workflow of the droplet microfluidics–based mitochondrial transfer technique, and experimental assessments.
(A) System setup for the droplet microfluidics–based mitochondrial transfer technique. (B) Wave-like structure for cell pairing before encapsulation and wave-like structure for mitochondria and cell suspension mixing after encapsulation (56, 57). (C) Coencapsulation of cells and mitochondria in droplets. (D) Demonstration of cell focusing in the wave-like structure. (E) Demonstration of mitochondrial transfer process via endocytosis in the droplet. (F) Fabricated chip for droplet generation and observation. (G) Experimental workflow to demonstrate the effectiveness of mitochondrial transfer recipient cells on myogenic differentiation in vitro and quality and functional outcome of muscle regeneration in vivo.
Fig. 2.
Fig. 2.. Presentation of droplet microfluidics–based mitochondrial transfer system.
(A) Coflow of cell and isolated mitochondria suspensions to the wave-like structure for cell focusing. (B) Wave-like structure used for cell focusing to improve single-cell encapsulation efficiency (more details in fig. S1). (C) Flow-focusing structure for droplet generation and wave-like structure for mixing of cell and mitochondria suspensions within the generated droplets. (D) MitoTracker Green FM–stained mitochondria were isolated from C2C12 myoblasts and observed under confocal microscope for 2D and 3D Z-stack images. (E) An aliquot portion of droplets were collected for further confocal imaging analysis to verify the extent of mitochondrial transfer by counting the number of transferred mitochondria prestained with MitoTracker Green FM. The recipient cell membrane was stained with CellMask Deep Red. Representative 3D image of a droplet (gray) was segmented to visualize the encapsulated mitochondria (green) inside a recipient cell (red). (F) Cell encapsulation efficiency using the wave-like structure under different concentrations of cell suspension and different flow rates. Here, 1 and 2 stand for one and two or more cells encapsulated in one droplet, respectively. L stands for 0.85 × 10⁷ cells/ml, and H stands for 1.7 × 10⁷ cells/ml. (G) Influence of oil/water flow rate ratio on droplet size. (H) Influence of droplet size on mitochondrial transfer efficiency. (I) Influence of cell suspension flow rate on cell viability. All images from (D and E) were acquired with a confocal microscope (see Materials and Methods for details). All data from (F to I) were acquired from three independent experiments, presented as means ± SD, and analyzed by one-way analysis of variance (ANOVA) with Dunn’s multiple comparisons test. *P < 0.05 and **P < 0.01. The red arrows from (A to C) indicate the flow directions inside channels.
Fig. 3.
Fig. 3.. Quantitative control of mitochondrial transfer using the proposed droplet–based method.
(A and B) Mitochondrial transfer recipient cells (using 0.25, 0.5, and 1.0 U of mitochondria suspensions, where 1.0 U of mitochondria stands for the concentration of mitochondria isolated from 1 × 10⁶ cells and suspended in 10 μl mitochondria storing reagent) observed under the confocal microscope. The cell membranes of recipient cells were stained with CellMask Deep Red (excitation/emission: 633/655 nm). (C) The presence of transferred mitochondria inside recipient cells was visualized using MitoTracker Green FM (excitation/emission: 488/512 nm); mitochondria were stained before isolation and transfer. (D) Representative 3D Z-stack images reconstructed from 2D confocal images of the mitochondrial transfer recipient cell in (A and B). The 3D images of recipient cells (red) were segmented to visualize the transferred mitochondria (green). White circles denote the selected recipient cells in low magnification. (E) Average number of transferred mitochondria per cell under different mitochondria concentrations. The number of mitochondria was counted in the 3D images using a confocal fluorescence microscope. (F) Transfer efficiency calculated as the ratio of the number of isolated mitochondria transferred into a recipient cell to the total number of isolated mitochondria encapsulated in a droplet. All images from (A) were acquired with a confocal microscope (see Materials and Methods for details). All data in (E and F) were acquired from three independent experiments, presented as means ± SD, and analyzed by one-way ANOVA with Dunn’s multiple comparisons test. *P < 0.05. ns, not significant.
Fig. 4.
Fig. 4.. In vitro study of mitochondrial transfer effect on myogenic differentiation of C2C12 myoblast cells.
(A) Representative bright-field images of mitochondria-transferred C2C12 cells during the myogenic induction process. C2C12 cells were subjected to mitochondrial transfer at different concentrations before myogenic induction (8, 14, and 31 exogenous isolated mitochondria transferred per cell were defined as low-mito, mid-mito, and high-mito transferred groups, respectively). The cell morphology and formed myotubes were imaged right before the induction started and on days 3 and 7 of the induction process. (B and C) On day 7, the myotube area and length were determined using ImageJ, and three field of views were taken per well. (D) Cellular proliferation of C2C12 cells was determined by MTT assay on days 1 to 4 after mitochondrial transfer. (E and F) Intracellular ATP levels and mtDNA content of C2C12 cells were quantified on days 0 and 7 after mitochondrial transfer. ATP was measured with the ATP Colorimetric Assay Kit, while mtDNA content was indicated by the ratio of mtDNA’s cytochrome c oxidase subunit I (Cox1) gene to 18S nuclear DNA (mtDNA/nDNA) with qPCR. All the values were normalized to day 0. Data were acquired from three independent experiments, presented as means ± SD, and analyzed with one-way ANOVA followed by Dunn’s multiple comparison test. *P < 0.05 (or #), **P < 0.01 (or ##), ***P < 0.001 (or ###), and ****P < 0.0001 (or ####).
Fig. 5.
Fig. 5.. Expression of myogenic and mitochondria-related genes during myogenic differentiation in C2C12 cells after mitochondrial transfer.
(A to C) Expression levels of muscle regeneration–related genes. (D to F) Expression levels of mitochondria-related genes. (G) mRNA expression level in different treatment groups and control group at day 7. The expression level was presented as fold change with respect to the control group. All data were acquired from three independent experiments, presented as means ± SD, and analyzed with one-way ANOVA followed by Dunn’s multiple comparisons test. *P < 0.05, **P < 0.01, ***P < 0.001, and ****P < 0. 0001.
Fig. 6.
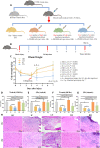
Fig. 6.. In vivo study of mitochondria-transferred C2C12 injection effect on muscle regeneration.
(A) Five groups of C57BL/6 mice were used to study the therapeutic effects (Materials and Methods). (B) Timeline of the mouse treatments. Muscle injuries were induced with 1.2% BaCl2 on day 0, followed by cell injections on day 3. Gastrocnemius muscle tissue from all five groups was collected on day 7. (C) The whole-body grip strengths of IC, LN, LH, and HH groups were tested and normalized to the mouse body weight. LH and HH groups showed larger whole-body grip strength than IC and LN groups from days 4 to 7. (D to G) Fo, SFo, Ft, and SFt of all five groups on day 7. LH and HH groups were recovered to the BC group, whereas IC and LN groups still showed performance defects. Force measurements were performed ex vivo on gastrocnemius muscle from anesthetized mice. (H) H&E staining of gastrocnemius muscle tissue from all five groups. LH and HH groups showed regenerated myofibers undergoing progressive growth and maturation, highlighted by the increasing cross-sectional area and nuclear relocation toward the periphery. All data were presented as means ± SD and analyzed with two-way ANOVA followed by Tukey’s post hoc test (n = 5). *P < 0.05 (# or +), **P < 0.01 (## or ++), ***P < 0.001 (### or +++), and ****P < 0.0001 (#### or ++++).
Fig. 7.
Fig. 7.. Muscle myogenic and mitochondria metabolic gene expression levels of muscle tissue–injured mice after C2C12 cell injections.
(A to C) Expression levels of muscle regeneration–related genes. (D) Expression levels of structural protein Acta1 gene. (E to H) Expression levels of mitochondria metabolic genes. All data were presented as means ± SD and analyzed with two-way ANOVA followed by Tukey’s post hoc test. *P < 0.05 (# or +), **P < 0.01 (## or ++), ***P < 0.001 (### or +++), and ****P < 0.0001 (#### or ++++).

References

    1. Patananan A. N., Wu T. H., Chiou P. Y., Teitell M. A., Modifying the mitochondrial genome. Cell Metab. 23, 785–796 (2016). - PMC - PubMed
    1. Picard M., Zhang J., Hancock S., Derbeneva O., Golhar R., Golik P., O’Hearn S., Levy S., Potluri P., Lvova M., Davila A., Lin C. S., Perin J. C., Rappaport E. F., Hakonarson H., Trounce I. A., Procaccio V., Wallace D. C., Progressive increase in mtDNA 3243A > G heteroplasmy causes abrupt transcriptional reprogramming. Proc. Natl. Acad. Sci. U.S.A. 111, E4033–E4042 (2014). - PMC - PubMed
    1. Shadel G. S., Horvath T. L., Mitochondrial ROS signaling in organismal homeostasis. Cell 163, 560–569 (2015). - PMC - PubMed
    1. Weinberg F., Chandel N. S., Reactive oxygen species-dependent signaling regulates cancer. Cell. Mol. Life Sci. 66, 3663–3673 (2009). - PMC - PubMed
    1. Romanello V., Sandri M., Mitochondrial quality control and muscle mass maintenance. Front. Physiol. 6, 422 (2016). - PMC - PubMed