. 2022 Aug 19;8(33):eabo7112.
doi: 10.1126/sciadv.abo7112. Epub 2022 Aug 17.

De novo variants in genes regulating stress granule assembly associate with neurodevelopmental disorders

Affiliations

De novo variants in genes regulating stress granule assembly associate with neurodevelopmental disorders

Xiangbin Jia et al. Sci Adv. .

Abstract

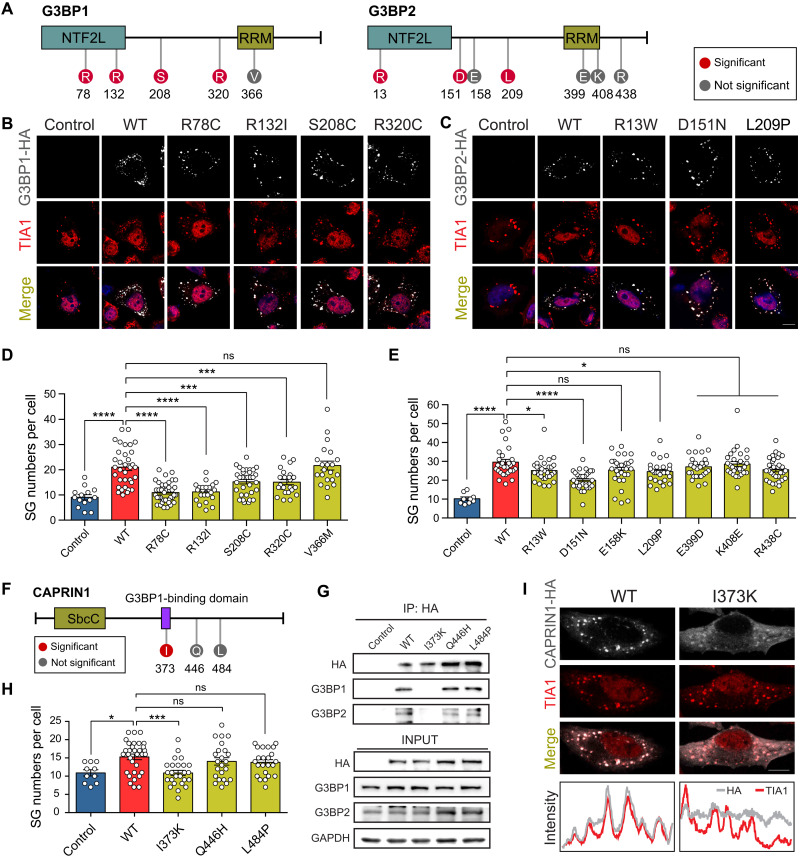
Stress granules (SGs) are cytoplasmic assemblies in response to a variety of stressors. We report a new neurodevelopmental disorder (NDD) with common features of language problems, intellectual disability, and behavioral issues caused by de novo likely gene-disruptive variants in UBAP2L, which encodes an essential regulator of SG assembly. Ubap2l haploinsufficiency in mouse led to social and cognitive impairments accompanied by disrupted neurogenesis and reduced SG formation during early brain development. On the basis of data from 40,853 individuals with NDDs, we report a nominally significant excess of de novo variants within 29 genes that are not implicated in NDDs, including 3 essential genes (G3BP1, G3BP2, and UBAP2L) in the core SG interaction network. We validated that NDD-related de novo variants in newly implicated and known NDD genes, such as CAPRIN1, disrupt the interaction of the core SG network and interfere with SG formation. Together, our findings suggest the common SG pathology in NDDs.


Figures

Fig. 1.
Fig. 1.. Disruptive variants in UBAP2L lead to a new NDD.
(A) Distribution of de novo nonsense and frameshift variants in UBAP2L identified in NDDs is shown in a protein model. aa, amino acids. (B) Distribution of de novo splicing variants in UBAP2L identified in NDDs is shown in a gene model. (C) Minigene assay shows that de novo variants c.590+1G>A, c.703+3dup, and c.3168+3A>G in UBAP2L impair normal splicing. Sanger sequencing confirmed that the variants resulted in skipping of exons 7, 8, and 26, respectively, which are highlighted by blue. M represents marker. Sequence highlighted by green above the Sanger trace is from exon 25. Sequence highlighted by pink is from exon 27. (D) Phenotypic spectrum of individuals carrying UBAP2L disruptive variants (n = 12); ADHD, attention-deficit hyperactivity disorder; M, male; F, female; +, present; −, absent; /, no data or undetermined. (E) Facial features and hand abnormalities of individuals with UBAP2L disruptive variants. Photo credit: Shujie Zhang, Child Health Hospital of Guangxi Zhuang Autonomous Region; Chiara Leoni, Maternal Fondazione Policlinico Universitario A. Gemelli-IRCCS; Nicola Brunetti-Pierri, Telethon Institute of Genetics and Medicine (TIGEM); Claartje Meddens, University of Amsterdam; and Meredith Fuchs, Pediatrics and Genetics, Alpharetta.
Fig. 2.
Fig. 2.. Disruptive variants in UBAP2L interfere with SG formation.
(A) Immunoblotting of UBAP2L in patient-derived fibroblasts. UBAP2L proteins extracted from skin fibroblasts of healthy controls (NC1 and NC2) and patients with NDD (P1 and P4) were subjected to SDS-PAGE and immunoblotted with UBAP2L antibody. β-Actin was used as loading controls. P1 represents patient 1. P4 represents patient 4. Quantification of UBAP2L was obtained with densitometric analysis and normalized with β-actin. ***P < 0.001 and **P < 0.01; ns, not significant. (B) Immunofluorescence images of SGs in normal control (NC) and patient-derived fibroblasts under stress condition. Quantification and statistics of SG number per cell are shown on the right (NC1, 79 fibroblasts; NC2, 83 fibroblasts; P1, 61 fibroblasts; P4, 38 fibroblasts). (C) Immunofluorescence images of UBAP2L WT and variants (HA, gray) and endogenous TIA1 (red) as SG marker in transfected UBAP2L-KO cells under stress conditions. Quantification and statistics of SG number per cell are shown on the right (Control, 40 cells; UBAP2L-WT, 72 cells; p.Q30*, 24 cells; p.G182Efs*78, 18 cells; p.G188*, 34 cells; c.3168+3A>G, 43 cells). Scale bars, 10 μm. *P < 0.05, **P < 0.01, ***P < 0.001, and ****P < 0.0001.
Fig. 3.
Fig. 3.. Haploinsufficiency of Ubap2l in mouse leads to behavioral and cognitive impairments.
(A) Targeting strategy of Ubap2l conventional KO mice. (B) The percentage of mice with different genotypes [WT, heterozygous (HET), and homozygous (HOM)] at E15.5, E18.5, and P1. (C) The three-chamber test for the WT and HET mice. The time spent with empty (E), stranger 1 (S1), and stranger 2 (S2) of the WT and HET mice was recorded and compared. The preference indexes [(S1 − E)/(S1 + E) and (S2 − S1)/(S1 + S2)] were calculated and compared (n = 24 for WT and n = 22 for HET). (D) The Y-maze test for the WT and HET mice. The percentages of spontaneous alternation behavior of the WT and HET mice were calculated and compared (n = 11 for WT and n = 10 for HET). (E) The open-field test for the WT and HET mice. Time spent in the center zone and traveled distance of the WT and HET mice were recorded and compared, respectively (n = 31 for WT and n = 27 for HET). (F) The elevated-plus maze test for the WT and HET mice. Time spent and distance traveled in the open arms and closed arms of the WT and HET mice were recorded and compared, respectively (n = 23 for WT and n = 21 for HET). *P < 0.05 and **P < 0.01.
Fig. 4.
Fig. 4.. Ubap2l deficiency leads to abnormal cortex lamination and neural progenitor proliferation in a mouse developing brain.
(A) Comparison of brain size between the WT, HET, and KO mice at E18.5. Cortical area and cortical length were decreased in the Ubap2l KO mice compared with the WT mice (n = 5 for WT, n = 5 for HET, and n = 6 for KO). Scale bar, 2 mm. (B) Immunofluorescence imaging for the coronal section of the entire cortex stained with Satb2 (upper-layer marker), Ctip2, and Tbr1 (deeper-layer marker) at E18.5. Scale bar, 0.5 mm. (C) The higher magnification of cortical lamination stained shown in (B). Scale bar, 50 μm. (D and E) Quantification of cells expressing Satb2 (red), Ctip2 (cyan), and Tbr1 (gray) per 10,000 μm2 and the length of layers expressing these markers in each section (n = 4 for WT, n = 7 for HET, and n = 6 for KO). (F and G) Immunofluorescence imaging of neuronal progenitors at E15.5. The brains were harvested 30 min after EdU injection and immunolabeled with EdU, radial progenitors (Pax6), and intermediate progenitors (Tbr2). Percentage of cells expressing Pax6 and Tbr2 colabeled with EdU was calculated and compared (n = 6 for WT, n = 9 for HET, and n = 9 for KO). Scale bar, 25 μm. *P < 0.05, **P < 0.01, ***P < 0.001, and ****P < 0.0001.
Fig. 5.
Fig. 5.. Disruption of SG formation in Ubap2l-deficient mouse brain.
(A) Immunofluorescence imaging of the coronal section of the WT, HET, and KO mice brain labeled with the SG marker TIA1 at E18.5 without stress condition. Newborn neurons in the cortical plate were assayed. Quantification of the mean intensity of TIA1 immunosignals and SG numbers per 100 μm2 is shown, respectively (n = 16 for WT, n = 16 for HET, and n = 16 for KO). (B) Immunofluorescence imaging of the coronal section of the WT, HET, and KO mice brain labeled with the SG marker TIA1 at E18.5 under stress conditions. Newborn neurons in the cortical plate were assayed. Quantification of the mean intensity of TIA1 immunosignals and SG numbers per 100 μm2 is shown, respectively (n = 16 for WT, n = 15 for HET, and n = 16 for KO). Scale bar, 10 μm. *P < 0.05, **P < 0.01, and ****P < 0.0001.
Fig. 6.
Fig. 6.. Newly implicated core SG–related NDD genes and network enrichment analysis.
(A) The PPI and GCE network of 26 core SG genes. The color and size of each gene node represent the closeness and betweenness centrality in the network, respectively. The color of the edge line represents the type of network (GCE: blue; PPI: red). The width of the edge line represents the strength of interaction (|R| for GCE and combined score for PPI). Borderline types of the gene nodes represent different gene sets. (B) Schematic representation of de novo LGD (red) and missense (blue) variants in three SG-essential genes: G3BP1, G3BP2, and CAPRIN1. (C) Downsampling analysis of network edge density between networks formed by different gene sets. P values were calculated by empirically estimating the probability of observing a denser network by randomly sampling 10,000 subnetworks of the same counts of genes from background interactome.
Fig. 7.
Fig. 7.. De novo missense variants in G3BP1, G3BP2, and CAPRIN1 disrupt SG formation and network interaction.
(A) Schematic protein structure of G3BP1 and G3BP2 showing the NTF2L domain and RRM region. The positions of de novo missense variants affecting SG formation are shown in red. The positions of de novo missense variants unaffecting SG assembly are shown in gray. (B and C) Immunofluorescence imaging of the WT and mutant proteins of G3BP1/2 (HA, gray) and endogenous TIA1 (red) as SG markers in transfected G3BP1/2 KO cells under stress conditions. Scale bar, 10 μm. (D and E) Quantification of SG numbers per cell for G3BP1/2 WT and variants. (D) Control, 14 cells; WT, 34 cells; R78C, 41 cells; R132I, 23 cells; S208C, 33 cells; R320C, 24 cells; V366M, 21 cells. (E) Control, 9 cells; WT, 30 cells; R13W, 32 cells; D151N, 32 cells; E158K, 29 cells; L209P, 28 cells; E399D, 27 cells; K408E, 30 cells; R438C, 32 cells. (F) Schematic protein structure of CAPRIN1 showing the domain of SbcC and G3BP1 binding. The positions of de novo missense variants that affected (red) and did not affect (gray) SG assembly are shown. (G) Coimmunoprecipitation assay of CAPRIN1 mutant proteins and G3BP1/2. CAPRIN1-HA-IP lysate from CAPRIN1 KO HeLa cells transfected with WT and mutant constructs was subjected to SDS-PAGE and immunoblot with G3BP1/2. Input was applied as protein-level controls. (H) Quantification of SG numbers per cell for CAPRIN1 WT and variants (Control, 10 cells; WT, 32 cells; I373K, 25 cells; Q446H, 23 cells; L484P, 23cells). (I) Immunofluorescence imaging of WT and mutant proteins of CAPRIN1 (HA, gray) and endogenous TIA1 (red) as SG marker in transfected CAPRIN1 KO cells under stress conditions. Scale bar, 10 μm. Immunofluorescence intensity lines of CAPRIN1 WT, CAPRIN1 I373K mutant, and SG marker TIA1 are plotted. *P < 0.05, ***P < 0.001, and ****P < 0.0001.

References

    1. Parenti I., Rabaneda L. G., Schoen H., Novarino G., Neurodevelopmental disorders: From genetics to functional pathways. Trends Neurosci. 43, 608–621 (2020). - PubMed
    1. Satterstrom F. K., Kosmicki J. A., Wang J., Breen M. S., De Rubeis S., An J. Y., Peng M., Collins R., Grove J., Klei L., Stevens C., Reichert J., Mulhern M. S., Artomov M., Gerges S., Sheppard B., Xu X., Bhaduri A., Norman U., Brand H., Schwartz G., Nguyen R., Guerrero E. E., Dias C.; Autism Sequencing Consortium; iPSYCH-Broad Consortium, Betancur C., Cook E. H., Gallagher L., Gill M., Sutcliffe J. S., Thurm A., Zwick M. E., Borglum A. D., State M. W., Cicek A. E., Talkowski M. E., Cutler D. J., Devlin B., Sanders S. J., Roeder K., Daly M. J., Buxbaum J. D., Large-scale exome sequencing study implicates both developmental and functional changes in the neurobiology of autism. Cell 180, 568–584.e23 (2020). - PMC - PubMed
    1. Coe B. P., Stessman H. A. F., Sulovari A., Geisheker M. R., Bakken T. E., Lake A. M., Dougherty J. D., Lein E. S., Hormozdiari F., Bernier R. A., Eichler E. E., Neurodevelopmental disease genes implicated by de novo mutation and copy number variation morbidity. Nat. Genet. 51, 106–116 (2019). - PMC - PubMed
    1. Kaplanis J., Samocha K. E., Wiel L., Zhang Z., Arvai K. J., Eberhardt R. Y., Gallone G., Lelieveld S. H., Martin H. C., McRae J. F., Short P. J., Torene R. I., de Boer E., Danecek P., Gardner E. J., Huang N., Lord J., Martincorena I., Pfundt R., Reijnders M. R. F., Yeung A., Yntema H. G.; Deciphering Developmental Disorders Study, Vissers L., Juusola J., Wright C. F., Brunner H. G., Firth H. V., FitzPatrick D. R., Barrett J. C., Hurles M. E., Gilissen C., Retterer K., Evidence for 28 genetic disorders discovered by combining healthcare and research data. Nature 586, 757–762 (2020). - PMC - PubMed
    1. Arlotta P., Molyneaux B. J., Chen J., Inoue J., Kominami R., Macklis J. D., Neuronal subtype-specific genes that control corticospinal motor neuron development in vivo. Neuron 45, 207–221 (2005). - PubMed