. 2022 Oct 3;219(10):e20212397.
doi: 10.1084/jem.20212397. Epub 2022 Aug 16.

A dysregulated sebum-microbial metabolite-IL-33 axis initiates skin inflammation in atopic dermatitis

Affiliations

A dysregulated sebum-microbial metabolite-IL-33 axis initiates skin inflammation in atopic dermatitis

Zhuoqiong Qiu et al. J Exp Med. .

Abstract

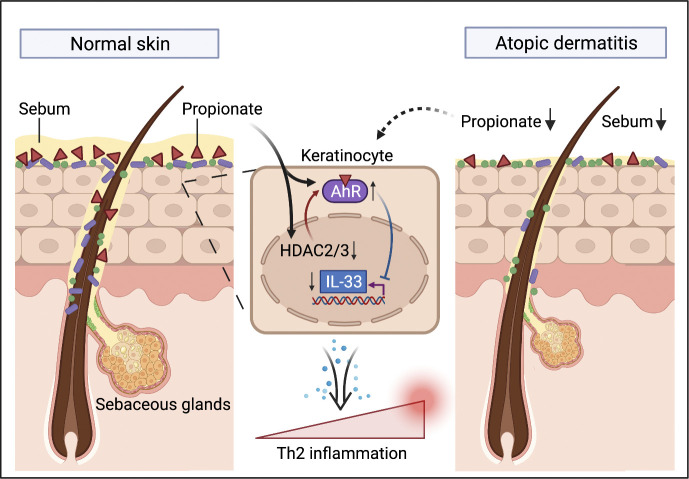
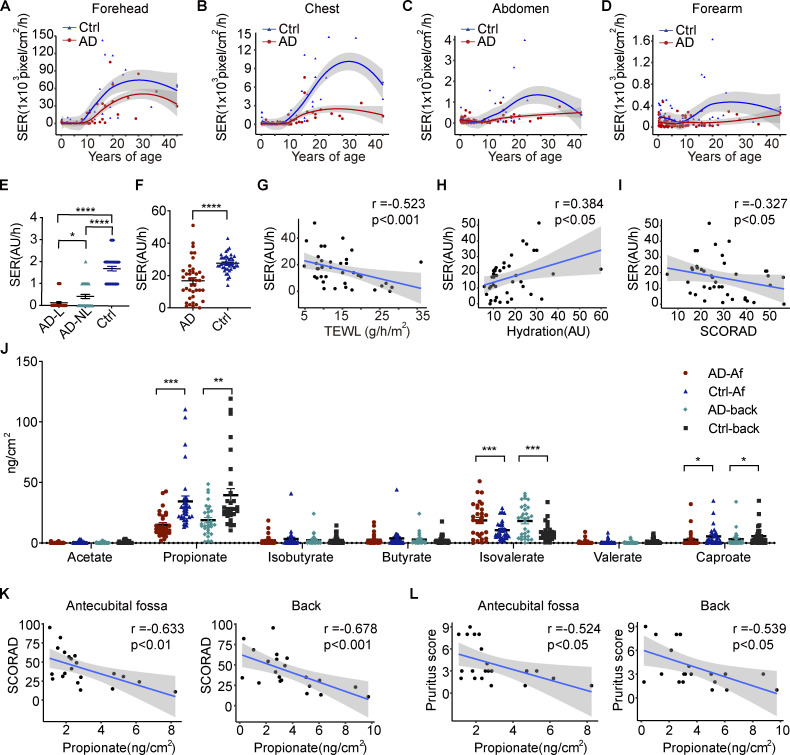
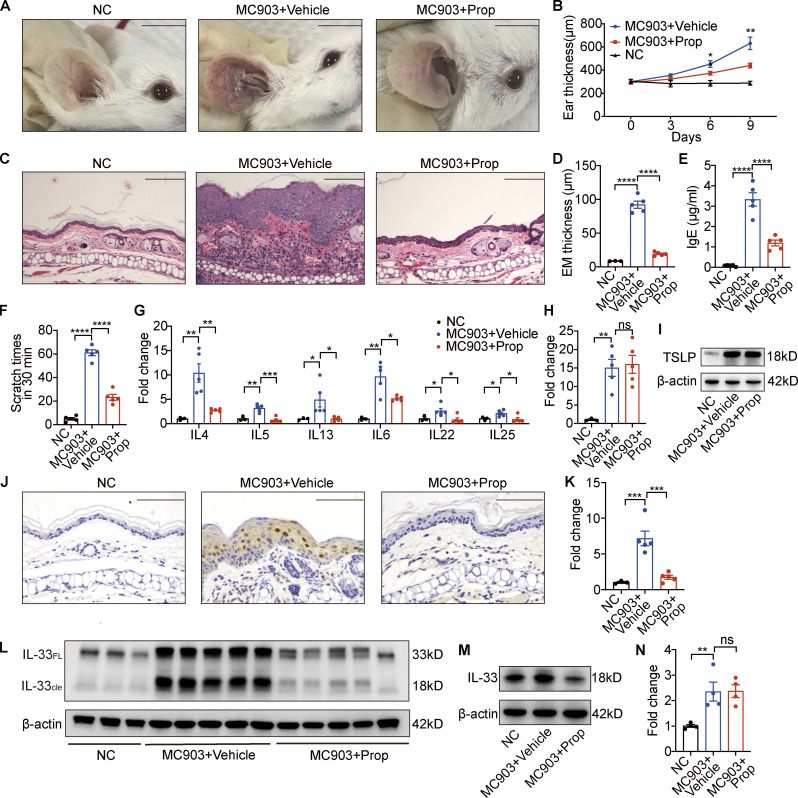
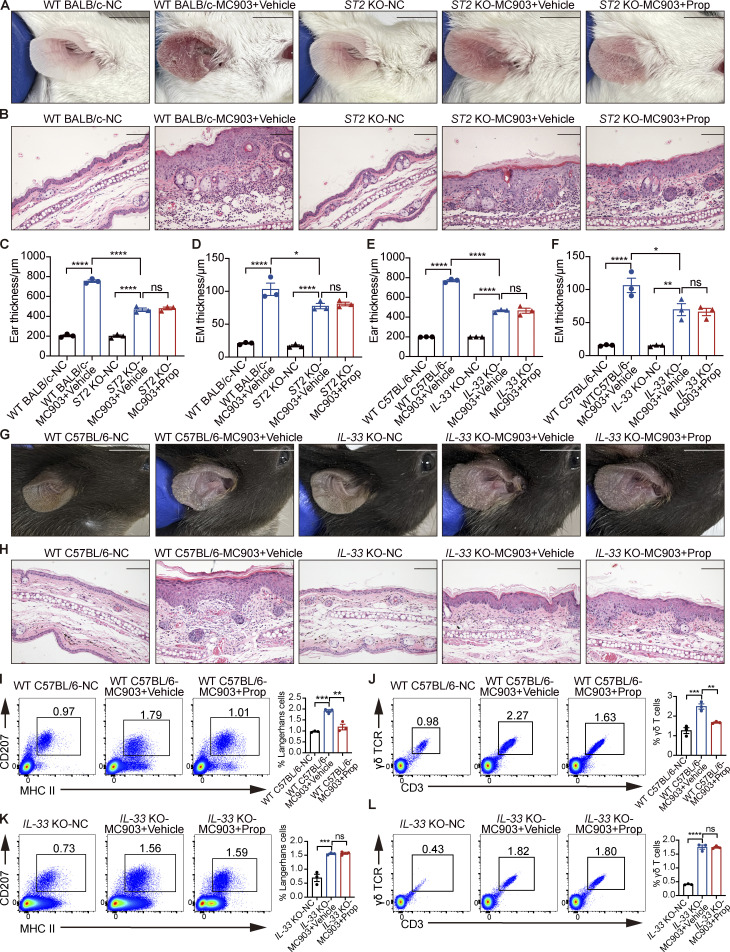
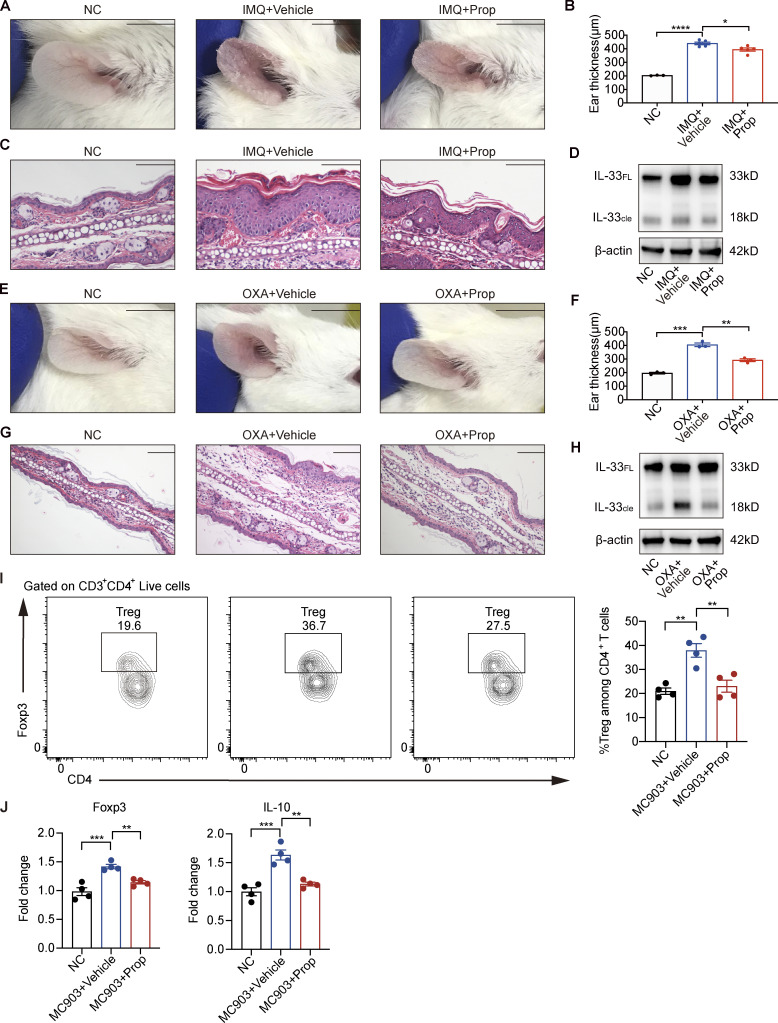
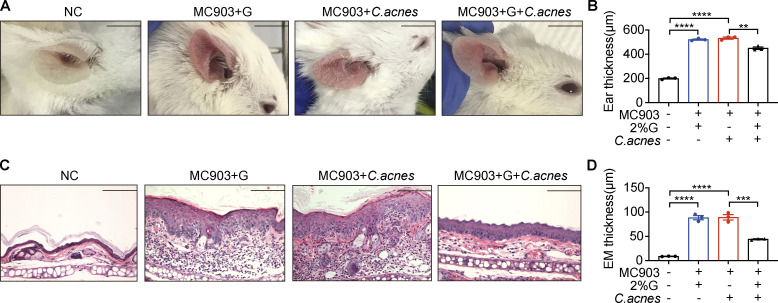
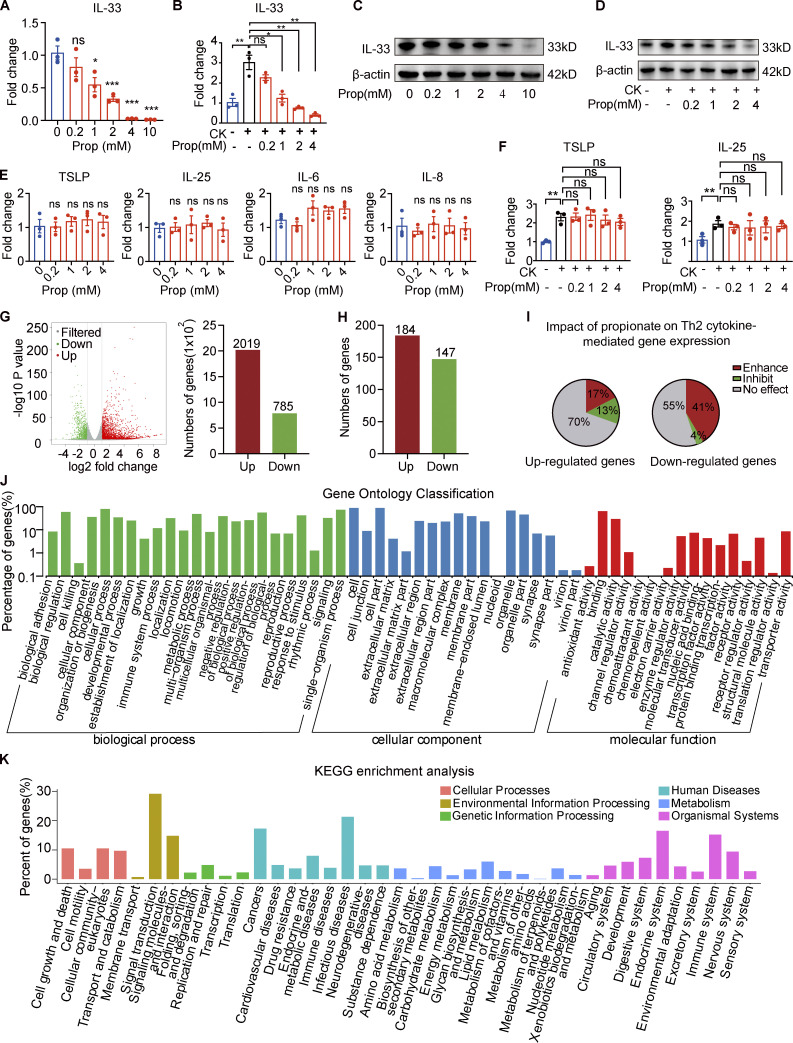
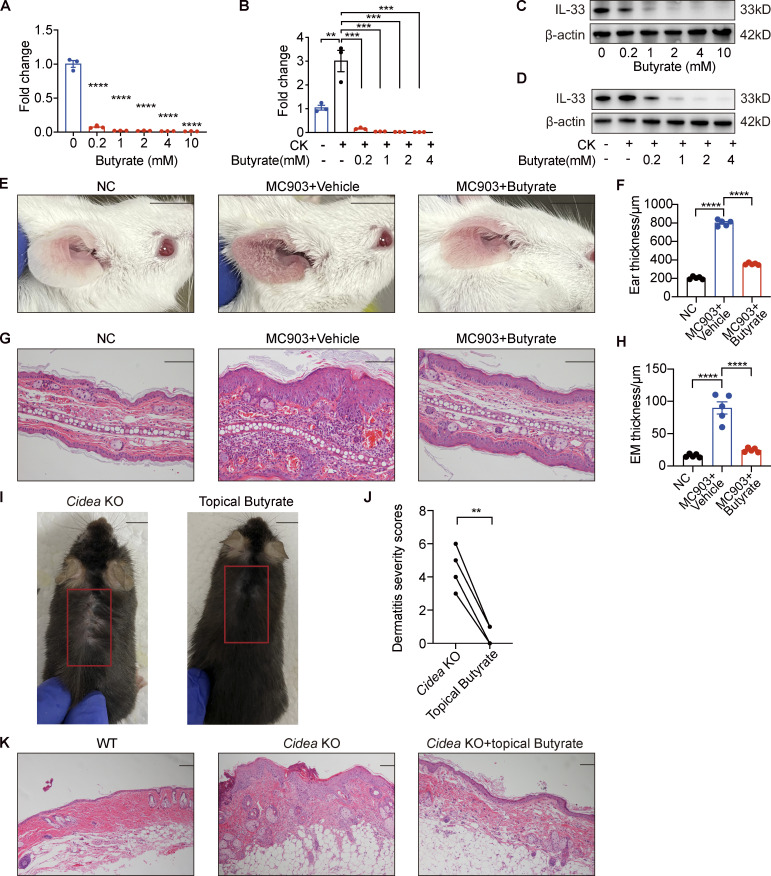
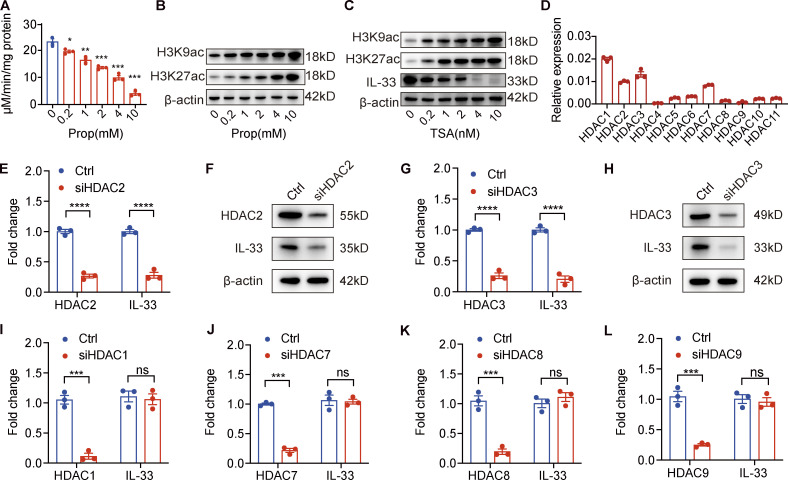
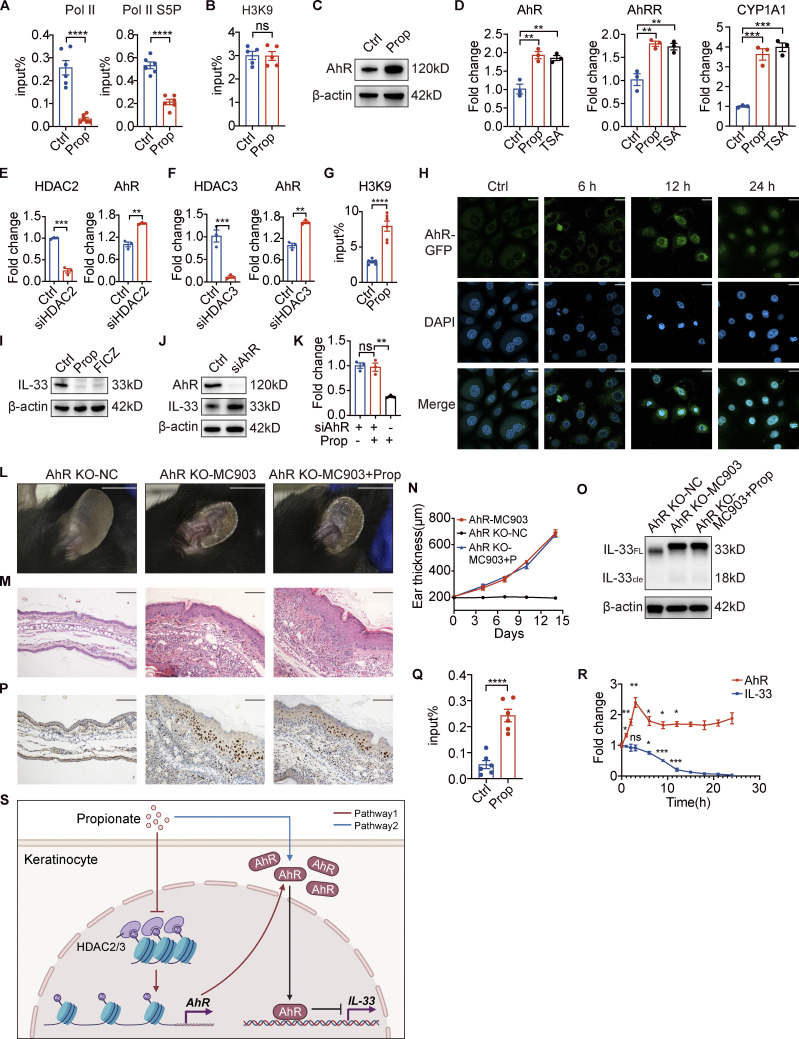
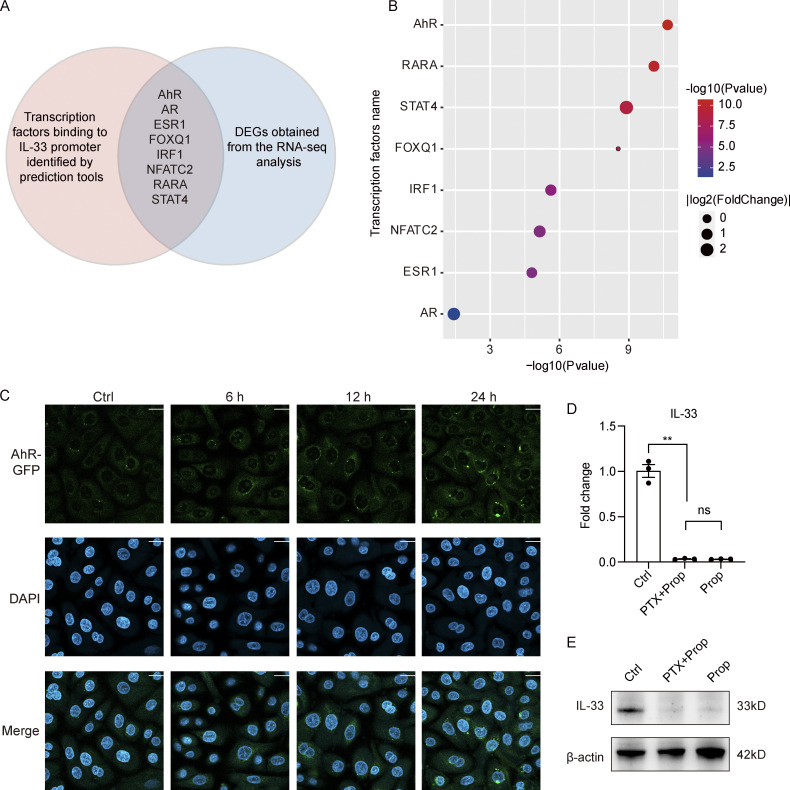
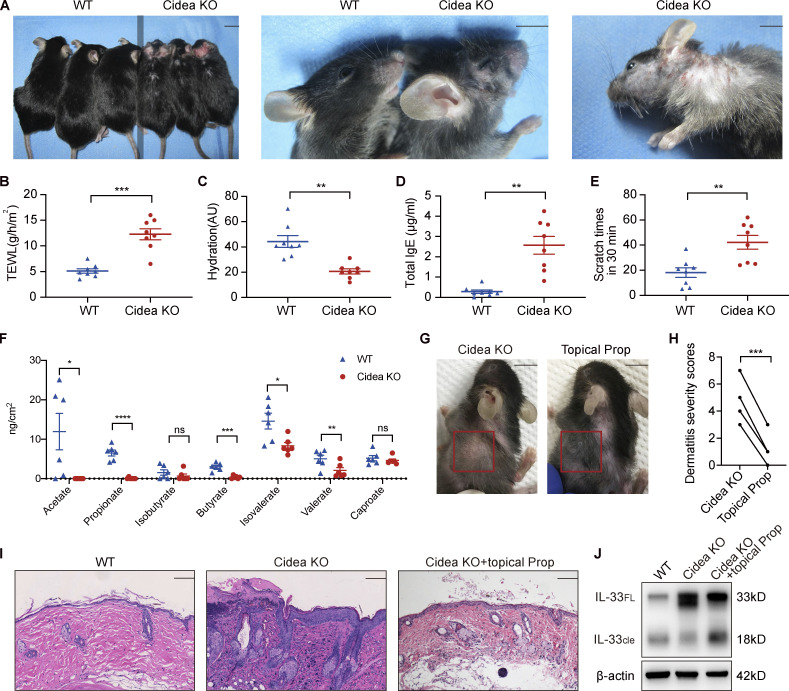
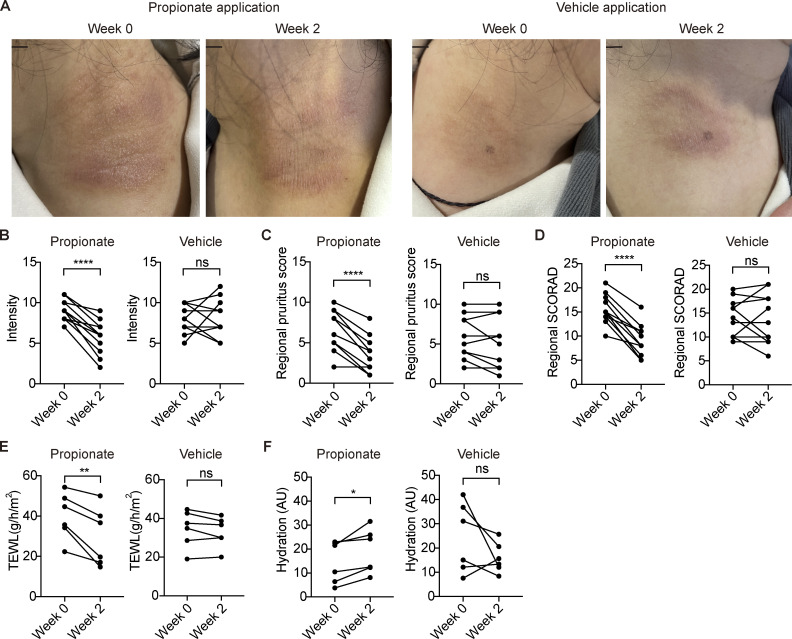
Microbial dysbiosis in the skin has been implicated in the pathogenesis of atopic dermatitis (AD); however, whether and how changes in the skin microbiome initiate skin inflammation, or vice versa, remains poorly understood. Here, we report that the levels of sebum and its microbial metabolite, propionate, were lower on the skin surface of AD patients compared with those of healthy individuals. Topical propionate application attenuated skin inflammation in mice with MC903-induced AD-like dermatitis by inhibiting IL-33 production in keratinocytes, an effect that was mediated through inhibition of HDAC and regulation of the AhR signaling pathway. Mice lacking sebum spontaneously developed AD-like dermatitis, which was improved by topical propionate application. A proof-of-concept clinical study further demonstrated the beneficial therapeutic effects of topical propionate application in AD patients. In summary, we have uncovered that the dysregulated sebum-microbial metabolite-IL-33 axis might play an initiating role in AD-related skin inflammation, thereby highlighting novel therapeutic strategies for the treatment of AD.


Conflict of interest statement

Disclosures: The authors declare no competing financial interests.

Figures

None
Graphical abstract
Figure 1.
Figure 1.
The production of sebum and microbial metabolites is decreased in the skin of AD patients. (A–D) SERs (pixels/cm2/h) measured using a Sebutape patch in nonlesional skin of different body sites of AD patients (n = 95) and healthy controls (n = 64) from different age groups. The solid lines represent LOESS fit lines. Gray shading around each line denotes 95% confidence intervals. (E) SERs (AU/h) measured by Delfin SebumScale in lesional (AD-L) and nonlesional (AD-NL) skin of AD patients and healthy individuals at the Af (n = 40 per group). (F) SERs (AU/h) measured by Delfin SebumScale in the nonlesional skin of forehead of AD patients and healthy controls (n = 40 per group). (G–I) Correlations between SERs and TEWL, epidermal hydration, and SCORAD of AD patients. The solid lines represent linear regression fit lines. Gray shading around each line denotes 95% confidence intervals. (J) SCFA levels on the nonlesional skin of the Af and the back of AD patients and healthy controls as measured by LC–MS/MS (n = 30 per group). (K) Correlations between the propionate level in the skin of Af/back and SCORAD of AD patients. (L) Correlations between the propionate level in the skin of Af/back and pruritus scores of AD patients. Data are expressed as means ± SEM. Statistical significance was analyzed by one-way ANOVA followed by Tukey’s test (E), unpaired t tests with Welch’s correction (F and J), and Spearman’s correlation test (G–I, K, and L). *, P < 0.05; **, P < 0.01; ***, P < 0.001; ****, P < 0.0001.
Figure 2.
Figure 2.
Topical propionate application attenuates MC903-induced AD-like dermatitis in mice by inhibiting IL-33 production. MC903 or MC903 plus propionate (Prop) was applied topically on the ears of BALB/c mice once a day for 9 d (n = 3–5 per group). (A) Representative gross appearance of the ears. (B) Dynamic changes in ear thickness on days 0, 3, 6, and 9. (C) H&E staining of ear sections. (D) Epidermal (EM) thickness of ear sections under high-power magnification. (E) Total serum IgE. (F) Scratching frequency. (G) mRNA expression of various cytokines in the ears of mice from each group. (H and I) Expression of TSLP mRNA and protein in the ears. (J–L) The expression of IL-33 in the ears of mice with MC903-induced AD-like dermatitis as determined by immunohistochemistry (J), RT-PCR (K), and Western blotting (L). IL-33FL, the full-length form of IL-33; IL-33cle, the cleaved form of IL-33. (M) Western blotting showing the protein expression of IL-33 in cultured JB6 cells treated with MC903 only or MC903 plus propionate. (N) The mRNA expression of IL-25 in cultured JB6 cells treated with MC903 only or MC903 plus propionate. Scale bar = 1 cm (A); 100 μm (C and J). Data are representative of three independent experiments and are expressed as means ± SEM. Statistical significance was analyzed by one-way ANOVA followed by Tukey’s test. *, P < 0.05; **, P < 0.01; ***, P < 0.001; ****, P < 0.0001. Source data are available for this figure: SourceData F2.
Figure S1.
Figure S1.
The absence of IL-33 or ST2 abolishes the propionate-mediated attenuation in skin inflammation of the MC903-treated mice. (A–D) MC903 or MC903 plus propionate (Prop)/vehicle was applied topically on the ears of WT BALB/c mice and ST2 KO mice once daily for 9 d (n = 3 per group). Representative gross appearance (A), H&E staining of ear sections on day 9 (B), ear thickness (C), and epidermal (EM) thickness of ear sections under high-power magnification (D) of each mice group are shown. (E–L) MC903 or MC903 plus propionate/vehicle was applied topically on the ears of WT C57BL/6 mice and IL-33 KO mice once daily for 14 d (n = 3 per group). Ear thickness (E), epidermal thickness of ear sections under high-power magnification (F), representative gross appearance (G), and H&E staining of ear sections on day 14 (H) of each mice group are shown. Representative flow cytometry dot plots of LCs (I and K) and γδ T cells (J and L) in ears of each mice group are shown. Bar graphs on the right showing the percentage of LCs/γδ T cells within MHC II+ CD207+ gates (LCs) or CD3+ γδ TCR+ gates (γδ T cells). Scale bar = 1 cm (A and G); 100 μm (B and H). Data are representative of three independent experiments and are expressed as means ± SEM. Statistical significance was analyzed by one-way ANOVA followed by Tukey’s test. *, P < 0.05; **, P < 0.01; ***, P < 0.001; ****, P < 0.0001.
Figure S2.
Figure S2.
Topical propionate treatment attenuates IMQ-, OXA-, or MC903-induced skin inflammation in mice. (A–D) IMQ-induced psoriatic dermatitis was produced in the ears of mice, following which the animals were topically treated with propionate once daily for 14 d (n = 3–5 per group). Gross appearance of the ears (A), ear thickness (B), H&E staining of ear sections (C), and the protein expression of IL-33 in lesional ears (D) are shown. (E–H) The mouse model of contact hypersensitivity was generated using OXA, after which propionate was topically applied during the sensitization and challenge stages (n = 3 per group). Gross appearance of the ears (E), ear thickness (F), H&E staining of ear sections (G), and the protein expression of IL-33 in lesional ears (H) are shown. (I and J) MC903 or MC903 plus propionate (Prop)/vehicle was applied topically on the ears of WT BALB/c mice once daily for 9 d (n = 4 per group). (I) Representative flow cytometry dot plots of Tregs in ears of each mice group gated on CD3+ CD4+ live cells. Bar graphs on the right showing the percentage of Tregs within CD3+ CD4+ Foxp3+ gates among CD4+ T cells. (J) The mRNA expression of Foxp3 and IL-10 in the ears of mice in each group. IL-33FL, the full-length form of IL-33; IL-33cle, the cleaved form of IL-33. Scale bar = 1 cm (A and E); 100 μm (C and G). Data are representative of three independent experiments and are expressed as means ± SEM. Statistical significance was analyzed by one-way ANOVA followed by Tukey’s test. *, P < 0.05; **, P < 0.01; ***, P < 0.001; ****, P < 0.0001. Source data are available for this figure: SourceData FS2.
Figure S3.
Figure S3.
Lipophilic microbes in lipid-rich conditions attenuate MC903-induced AD-like dermatitis in mice. C. acnes (1 × 10⁵ CFUs/ml) mixed with 2% glycerol (G) were topically applied onto MC903-treated mouse ears once daily for 9 consecutive days (n = 3 per group). (A) Gross appearance of the ears. (B) Ear thickness of mice. (C) H&E staining of ear sections. Scale bar = 100 μm. (D) Epidermal (EM) thickness of ear sections. Scale bar = 1 cm (A); 100 μm (C). Data are representative of three independent experiments and are expressed as means ± SEM. Statistical significance was analyzed by one-way ANOVA followed by Tukey’s test. **, P < 0.01; ***, P < 0.001; ****, P < 0.0001.
Figure 3.
Figure 3.
Propionate inhibits IL-33 production in keratinocytes. (A) RT-qPCR showing the expression of IL-33 mRNA in cultured human primary keratinocytes incubated with different concentrations of propionate for 24 h (n = 3 per group). (B) RT-qPCR showing the expression of IL-33 mRNA in cultured human primary keratinocytes stimulated with IL-4 (100 ng/ml) and IL-1α (10 ng/ml) for 1 h and then cocultured with different concentrations of propionate for 24 h (n = 3 per group). CK (cytokine) represents 100 ng/ml IL-4 + 10 ng/ml IL-1α. (C) Western blotting showing the protein expression of IL-33 in cultured human primary keratinocytes treated with different concentrations of propionate. (D) Western blotting showing the protein expression of IL-33 in keratinocytes cultured under Th2 inflammatory conditions and treated with different concentrations of propionate. (E) RT-qPCR showing the mRNA expression of inflammatory cytokines in human primary keratinocytes incubated with different concentrations of propionate (n = 3 per group). (F) RT-qPCR showing the mRNA expression of inflammatory cytokines in keratinocytes cultured under Th2 inflammatory conditions and treated with different concentrations of propionate (n = 3 per group). (G) Volcano plots and histogram showing the DEGs (|fold-change| >2 versus control, P < 0.05) in keratinocytes treated with propionate. (H) DEGs (|fold-change| >2 versus control, P < 0.05) in keratinocytes stimulated with Th2 cytokines. (I) The effects of propionate treatment on gene sets modulated by Th2 cytokines (enhancement: fold-change >1.5 with propionate + Th2 cytokines versus vehicle + Th2 cytokines; inhibition: fold-change <−1.5 with propionate + Th2 cytokines versus vehicle + Th2 cytokines; no effect: −1.5< fold-change <1.5). (J and K) Gene Ontology analysis and KEGG enrichment analysis of the Th2 cytokine-induced genes in keratinocytes after propionate treatment. Data are representative of three independent experiments and are expressed as means ± SEM. Statistical significance was analyzed by one-way ANOVA followed by Dunnett’s test. *, P < 0.05; **, P < 0.01; ***, P < 0.001. Source data are available for this figure: SourceData F3.
Figure S4.
Figure S4.
Butyrate suppresses IL-33 expression in keratinocytes and inhibits skin inflammation of AD mouse model. (A–D) IL-33 mRNA and protein expression in keratinocytes treated with different concentrations of butyrate (0.2–10 mM) in standard culture medium or supplemented with IL-4 and IL-1α for 24 h (n = 3 per group). (E–H) MC903 or MC903 plus butyrate (1 mM)/vehicle was applied topically on the ears of BALB/c mice once daily for 9 d (n = 5 per group). (E) Representative gross appearance of the ears. (F) Ear thickness of the mice in each group. (G) H&E staining of ear sections. (H) Epidermal (EM) thickness of ear sections under high-power magnification. (I–K) Cidea KO mice were topically applied with butyrate (1 mM) on the lesional skin twice daily for 21 d (n = 4 per group). (I) Gross appearance of skin lesions in Cidea KO mice before and after topical butyrate treatment. The red box indicates the skin lesions treated with butyrate. (J) Severity scores of skin lesions in Cidea KO mice before and after butyrate treatment. (K) H&E staining of skin samples from WT mice, lesional skin of Cidea KO mice, and lesional skin of Cidea KO mice treated with butyrate. Scale bar = 1 cm (E and I); 100 μm (G and K). Data are representative of three independent experiments and are expressed as means ± SEM. Statistical significance was analyzed by one-way ANOVA followed by Dunnett’s test (A and B) and paired t test (J). *, P < 0.05; **, P < 0.01; ***, P < 0.001; ****, P < 0.0001. Source data are available for this figure: SourceData FS4.
Figure 4.
Figure 4.
Propionate suppresses IL-33 expression in human primary keratinocytes through inhibiting HDAC2 and HDAC3. (A) HDAC enzyme activity in keratinocytes treated with different propionate (Prop) concentrations (n = 3 per group). (B) Western blotting showing histone acetylation in keratinocytes after treatment with different concentrations of propionate. (C) Western blotting of IL-33 expression and histone acetylation in keratinocytes treated with the HDAC inhibitor TSA. (D) The relative expression level of 11 HDACs in keratinocytes normalized to GAPDH as determined by RT-qPCR (n = 3 per group). (E–H) Expression of HDAC2/3 and IL-33 at the mRNA or protein level in keratinocytes after siRNA-mediated HDAC2/3 knockdown. (I–L) RT-qPCR results of the expression of IL-33 mRNA in keratinocytes treated with siRNA targeting HDAC1, HDAC7, HDAC8, or HDAC9. Data are representative of three independent experiments and are expressed as means ± SEM. Statistical significance was analyzed by one-way ANOVA followed by Dunnett’s test (A) and unpaired t tests (E, G, and I–L; n = 3 per group). *, P < 0.05; **, P < 0.01; ***, P < 0.001; ****, P < 0.0001. Source data are available for this figure: SourceData F4.
Figure 5.
Figure 5.
Propionate induces an increase in AhR expression and facilitates its recruitment to the IL-33 promoter. (A) A ChIP assay was used to assess the recruitment levels of polymerase II (Pol II) and its serine 5-phosphorylated form (Pol II S5P) to the IL-33 promoter in keratinocytes treated with propionate (Prop; n = 6 per group). (B) The levels of histone 3 lysine 9 acetylation (H3K9Ac) in the IL-33 promoter in keratinocytes treated with propionate as determined using a ChIP assay (n = 6 per group). (C) Western blotting of the protein expression of AhR in keratinocytes treated with propionate. (D) RT-qPCR analysis of the mRNA expression of AhR, AhRR, and CYP1A1 in keratinocytes treated with propionate or TSA (n = 3 per group). (E and F) RT-qPCR analysis of AhR mRNA expression levels in keratinocytes treated with siRNA specific for HDAC2 or HDAC3 (n = 3 per group). (G) A ChIP assay was used to measure the levels of H3K9Ac at the AhR promoter in keratinocytes treated with propionate (n = 6 per group). (H) Representative confocal images showing the localization of AhR in keratinocytes treated with propionate for different durations. (I) Western blotting analysis of the protein expression of IL-33 in keratinocytes treated with propionate or 6-formylindolo[3,2-b] carbazole (FICZ). (J) Western blotting analysis of the protein expression of IL-33 in keratinocytes treated with AhR-specific siRNA. (K) RT-qPCR analysis of IL-33 mRNA expression in keratinocytes treated with or without propionate when AhR was specifically silenced (n = 3 per group). (L–P) AhR KO mice with MC903-induced AD-like dermatitis were topically treated with propionate (n = 3 per group). Gross appearance (L), H&E staining of ear sections on day 14 (M), dynamic changes in ear thickness (N), Western blotting for IL-33 protein expression (O), and immunohistochemical staining of IL-33 in ear sections (P) are shown. (Q) The levels of AhR recruitment to the IL-33 promoter in keratinocytes following propionate treatment were assessed by ChIP assay (n = 6 per group). (R) RT-qPCR analysis of AhR and IL-33 mRNA levels in keratinocytes treated with propionate at different times (n = 3 per group). (S) A schematic figure showing the pathway through which propionate regulates IL-33. Pathway 1 (the red lines) reflects that propionate increases AhR expression by inhibiting HDAC2/3. Pathway 2 (the blue line) reflects that propionate induces AhR nuclear translocation. The black lines reflect that increased recruitment of AhR on the IL-33 promoter leads to IL-33 transcriptional repression. The schematic figure was created with BioRender.com. Scale bar = 20 μm (H); 1 cm (L); 100 μm (M and P). Data are representative of three independent experiments and are expressed as means ± SEM. Statistical significance was analyzed using unpaired t tests (A, B, E–G, and Q) and one-way ANOVA followed by Dunnett’s test (D, K, and R). *, P < 0.05; **, P < 0.01; ***, P < 0.001; ****, P < 0.0001. Source data are available for this figure: SourceData F5.
Figure S5.
Figure S5.
Mechanism for the inhibitory effect of propionate on IL-33 expression. (A and B) Analysis of potential transcription factors binding to IL-33 promoter. (A) The Venn diagram of intersection between transcription factors predicted to bind IL-33 promoter and DEGs obtained from the RNA-seq analysis. The red circle represents transcription factors predicted by PROMO database (http://alggen.lsi.upc.es/cgi-bin/promo_v3/promo/promoinit.cgi?dirDB=TF_8.3) and further verified by the online software LASAGNA-search 2.0 (https://biogrid-lasagna.engr.uconn.edu/lasagna_search/). The blue circle represents DEGs (|fold-change| >1.5 versus control, P < 0.05) obtained from the RNA-seq analysis. The intersection lists transcription factors that exist in both circles. (B) The bubble chart showing P values and fold-change of the listed transcription factors. (C) Representative confocal images showing the localization of AhR in keratinocytes treated with CH-223191 for 1 h before stimulation with propionate (4 mM) for different times. Scale bar = 20 μm. (D and E) Keratinocytes were treated with PTX (0.2 μg/ml) for 1 h before stimulation with propionate (Prop; 4 mM) for 24 h. Results of RT-qPCR analysis (D) and Western blotting analysis (E) for the expression of IL-33 in keratinocytes are shown. Data are representative of three independent experiments and are expressed as means ± SEM. Statistical significance was analyzed by one-way ANOVA followed by Tukey’s test. **, P < 0.01. Source data are available for this figure: SourceData FS5.
Figure 6.
Figure 6.
Propionate attenuates spontaneous AD-like dermatitis in sebum-deficient mice. (A) Gross appearance of skin lesions in Cidea KO and WT mice. The line down the middle of this panel is used to divide the two types of mice. (B–E) TEWL (B), epidermal hydration (C), total serum IgE (D), and scratching frequency (E) in Cidea KO and WT mice (n = 8 per group). (F) SCFA levels on the skin surface of Cidea KO and WT mice (n = 6 per group). (G) Gross appearance of skin lesions in Cidea KO mice before and after topical propionate treatment. The red box indicates the skin lesions treated with propionate. (H) The severity scores of skin lesions in Cidea KO mice before and after propionate treatment (n = 4). (I) H&E staining of skin samples from WT mice, lesional skin of Cidea KO mice, and lesional skin of Cidea KO mice treated with propionate. (J) Western blotting showing the protein expression of IL-33 in skin samples of WT mice, lesional skin of Cidea KO mice, and lesional skin of Cidea KO mice treated with propionate (Prop). Scale bar = 1 cm (A and G); 100 μm (I). Data are representative of three independent experiments and are expressed as means ± SEM. Statistical significance was analyzed by unpaired t test with Welch’s correction (B–F) and paired t test (H). *, P < 0.05; **, P < 0.01; ***, P < 0.001; ****, P < 0.0001. Source data are available for this figure: SourceData F6.
Figure 7.
Figure 7.
Topical propionate application ameliorates the symptoms of AD patients. (A) Representative photographs of symmetrical lesions in AD patients at enrollment (week 0) and week 2 after topical propionate or vehicle application. Scale bar = 1 cm. (B–D) Before- and after-treatment scores for skin symptom intensity (B), subjective pruritus (C), and treated region-specific SCORAD (D) of the propionate- or vehicle-treated region as measured by SCORAD protocol (n = 11). Treated region-specific SCORAD score is the sum of skin symptom intensity and pruritus scores. (E and F) Before- and after-treatment levels of TEWL (E) and skin hydration (F) of the propionate- or vehicle-treated region in enrolled AD patients (n = 6). Statistical significance was analyzed using paired t test. *, P < 0.05; **, P < 0.01; ****, P < 0.0001.

References

    1. Alenghat, T., Osborne L.C., Saenz S.A., Kobuley D., Ziegler C.G.K., Mullican S.E., Choi I., Grunberg S., Sinha R., Wynosky-Dolfi M., et al. . 2013. Histone deacetylase 3 coordinates commensal-bacteria-dependent intestinal homeostasis. Nature. 504:153–157. 10.1038/nature12687 - DOI - PMC - PubMed
    1. Baurecht, H., Rühlemann M.C., Rodríguez E., Thielking F., Harder I., Erkens A.-S., Stölzl D., Ellinghaus E., Hotze M., Lieb W., et al. . 2018. Epidermal lipid composition, barrier integrity, and eczematous inflammation are associated with skin microbiome configuration. J. Allergy Clin. Immunol. 141:1668–1676.e16. 10.1016/j.jaci.2018.01.019 - DOI - PubMed
    1. Bissonnette, R., Risch J.E., Mcelwee K.J., Marchessault P., Bolduc C., Nigen S., and Maari C.. 2015. Changes in serum free testosterone, sleep patterns, and 5-α-reductase type I activity influence changes in sebum excretion in female subjects. Skin Res. Technol. 21:47–53. 10.1111/srt.12155 - DOI - PubMed
    1. Bolger, A.M., Lohse M., and Usadel B.. 2014. Trimmomatic: A flexible trimmer for Illumina sequence data. Bioinformatics. 30:2114–2120. 10.1093/bioinformatics/btu170 - DOI - PMC - PubMed
    1. Bos, L.D.J., Sterk P.J., and Schultz M.J.. 2013. Volatile metabolites of pathogens: A systematic review. PLoS Pathog. 9:e1003311. 10.1371/journal.ppat.1003311 - DOI - PMC - PubMed

Publication types