Association of Simulated COVID-19 Policy Responses for Social Restrictions and Lockdowns With Health-Adjusted Life-Years and Costs in Victoria, Australia
- PMID: 35977202
- PMCID: PMC8796885
- DOI: 10.1001/jamahealthforum.2021.1749
Association of Simulated COVID-19 Policy Responses for Social Restrictions and Lockdowns With Health-Adjusted Life-Years and Costs in Victoria, Australia
Abstract
Importance: Countries have varied enormously in how they have responded to the COVID-19 pandemic, ranging from elimination strategies (eg, Australia, New Zealand, Taiwan) to tight suppression (not aiming for elimination but rather to keep infection rates low [eg, South Korea]) to loose suppression (eg, Europe, United States) to virtually unmitigated (eg, Brazil, India). Weighing the best option, based on health and economic consequences due to lockdowns, is necessary.
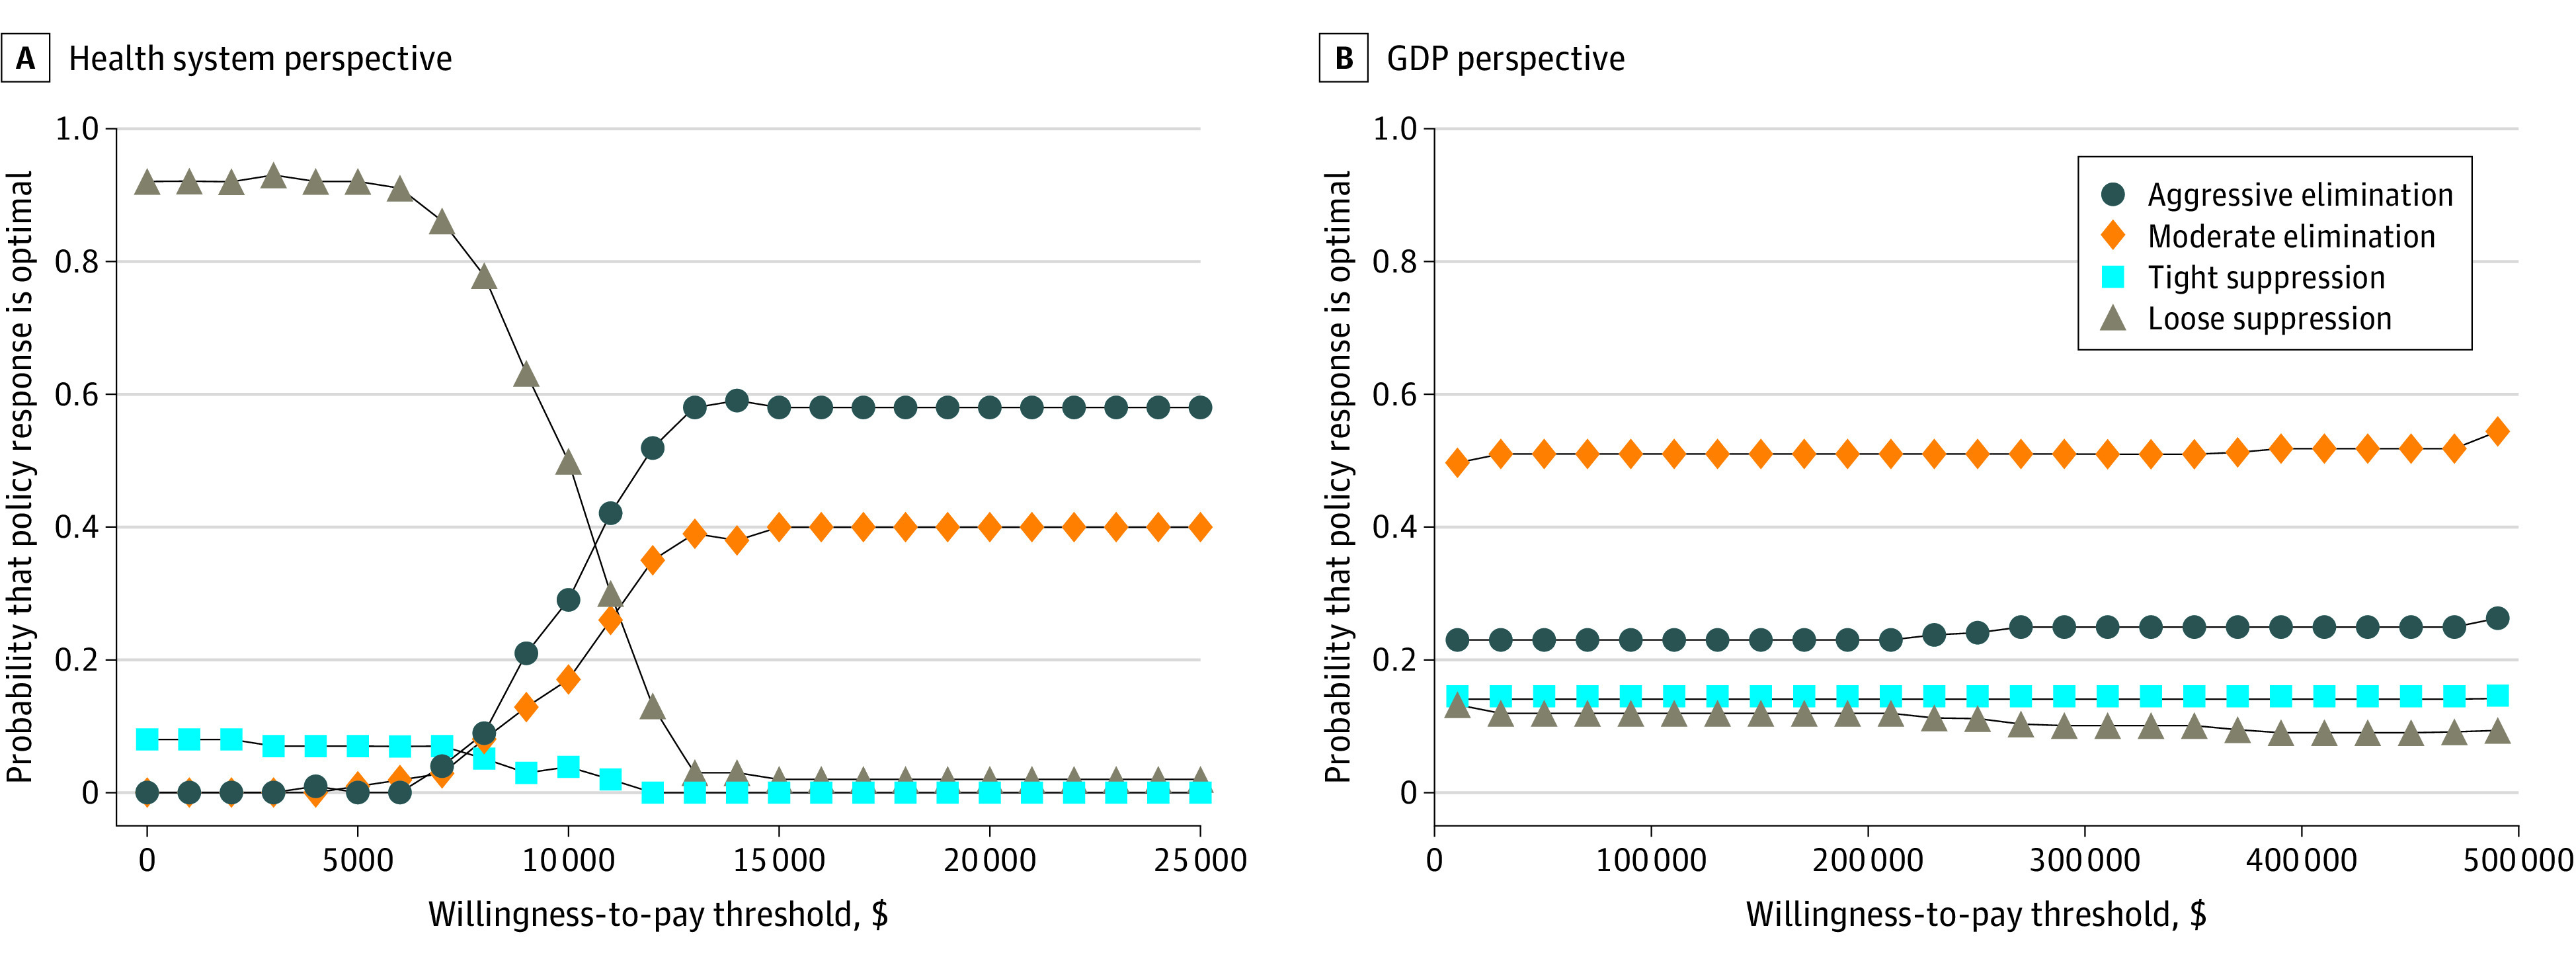
Objective: To determine the optimal policy response, using a net monetary benefit (NMB) approach, for policies ranging from aggressive elimination and moderate elimination to tight suppression (aiming for 1-5 cases per million per day) and loose suppression (5-25 cases per million per day).
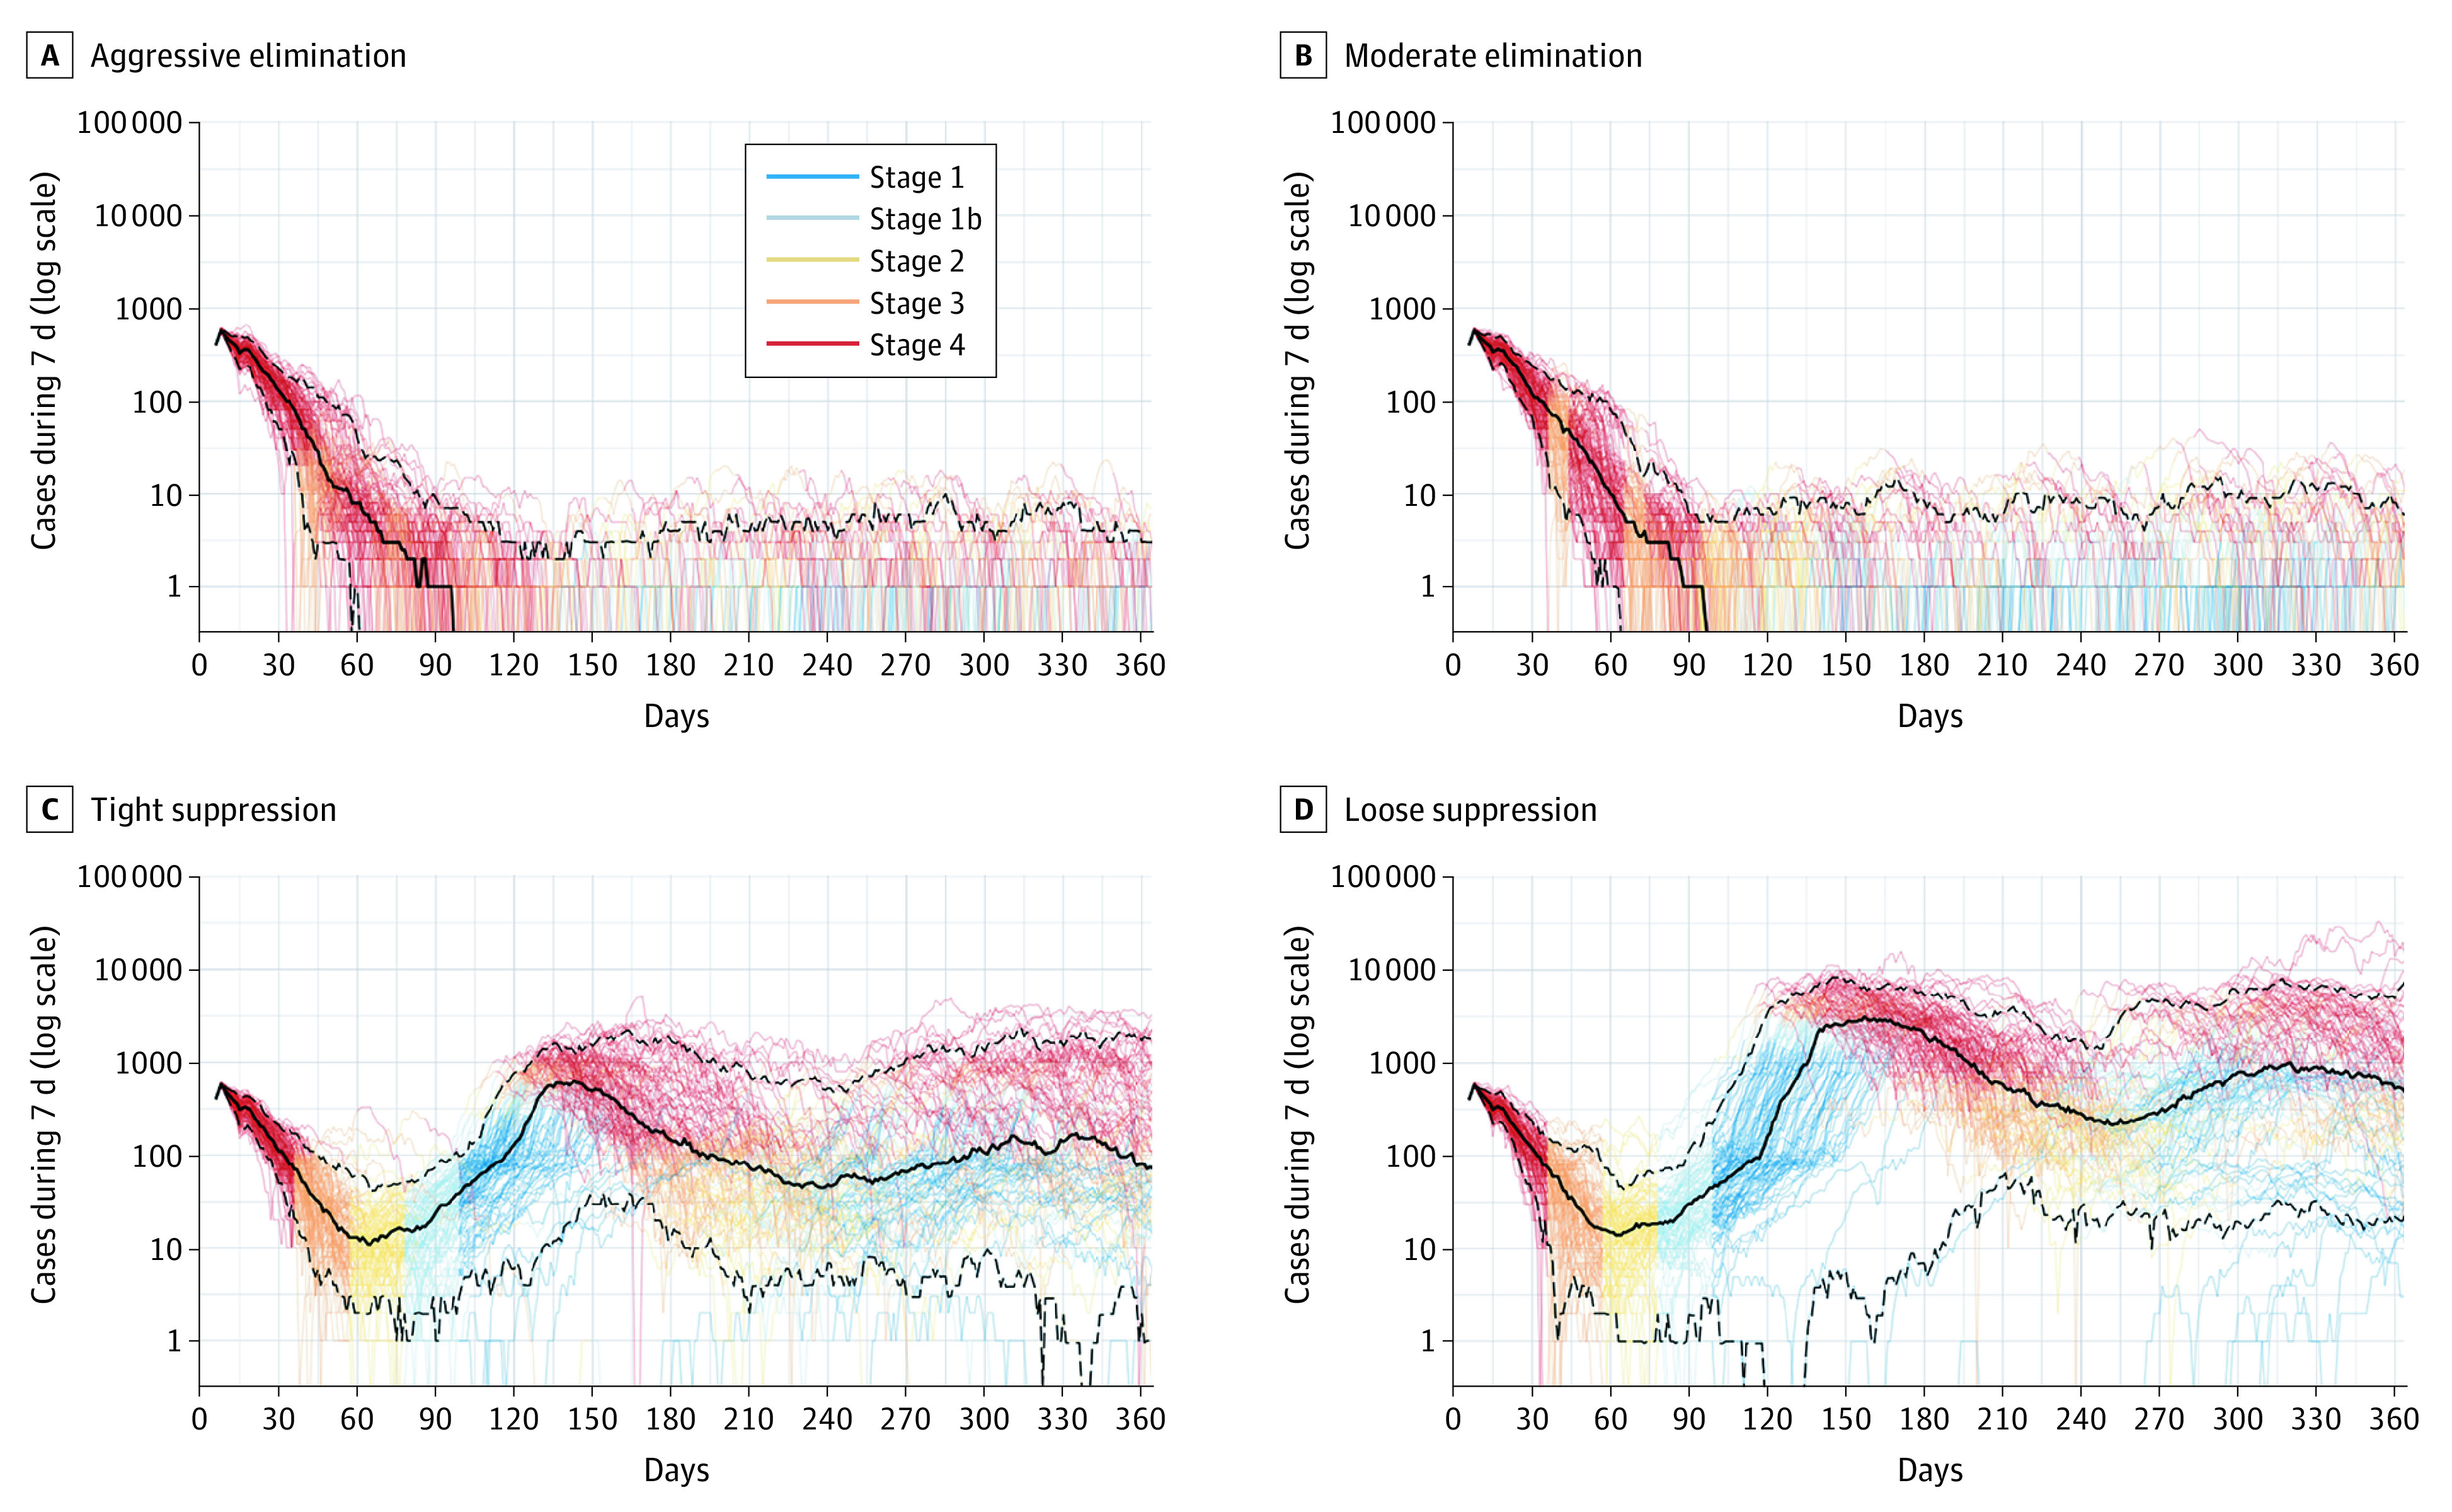
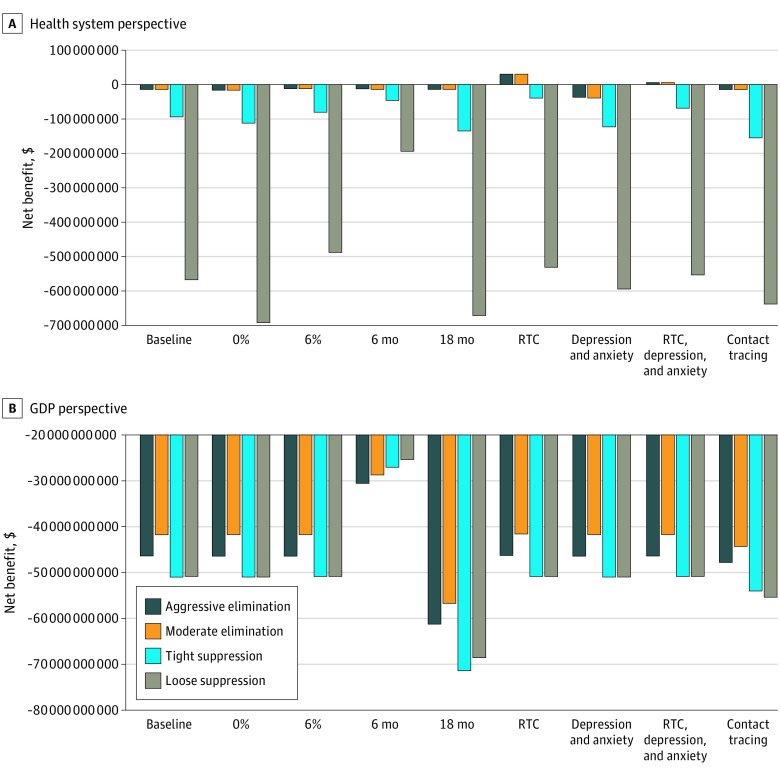
Design setting and participants: Using governmental data from the state of Victoria, Australia, and other collected data, 2 simulation models in series were conducted of all residents (population, 6.4 million) for SARS-CoV-2 infections for 1 year from September 1, 2020. An agent-based model (ABM) was used to estimate daily SARS-CoV-2 infection rates and time in 5 stages of social restrictions (stages 1, 1b, 2, 3, and 4) for 4 policy response settings (aggressive elimination, moderate elimination, tight suppression, and loose suppression), and a proportional multistate life table (PMSLT) model was used to estimate health-adjusted life-years (HALYs) associated with COVID-19 and costs (health systems and health system plus gross domestic product [GDP]). The ABM is a generic COVID-19 model of 2500 agents, or simulants, that was scaled up to the population of interest. Models were specified with data from 2019 (eg, epidemiological data in the PMSLT model) and 2020 (eg, epidemiological and cost consequences of COVID-19). The NMB of each policy option at varying willingness to pay (WTP) per HALY was calculated: NMB = HALYs × WTP - cost. The estimated most cost-effective (optimal) policy response was that with the highest NMB.
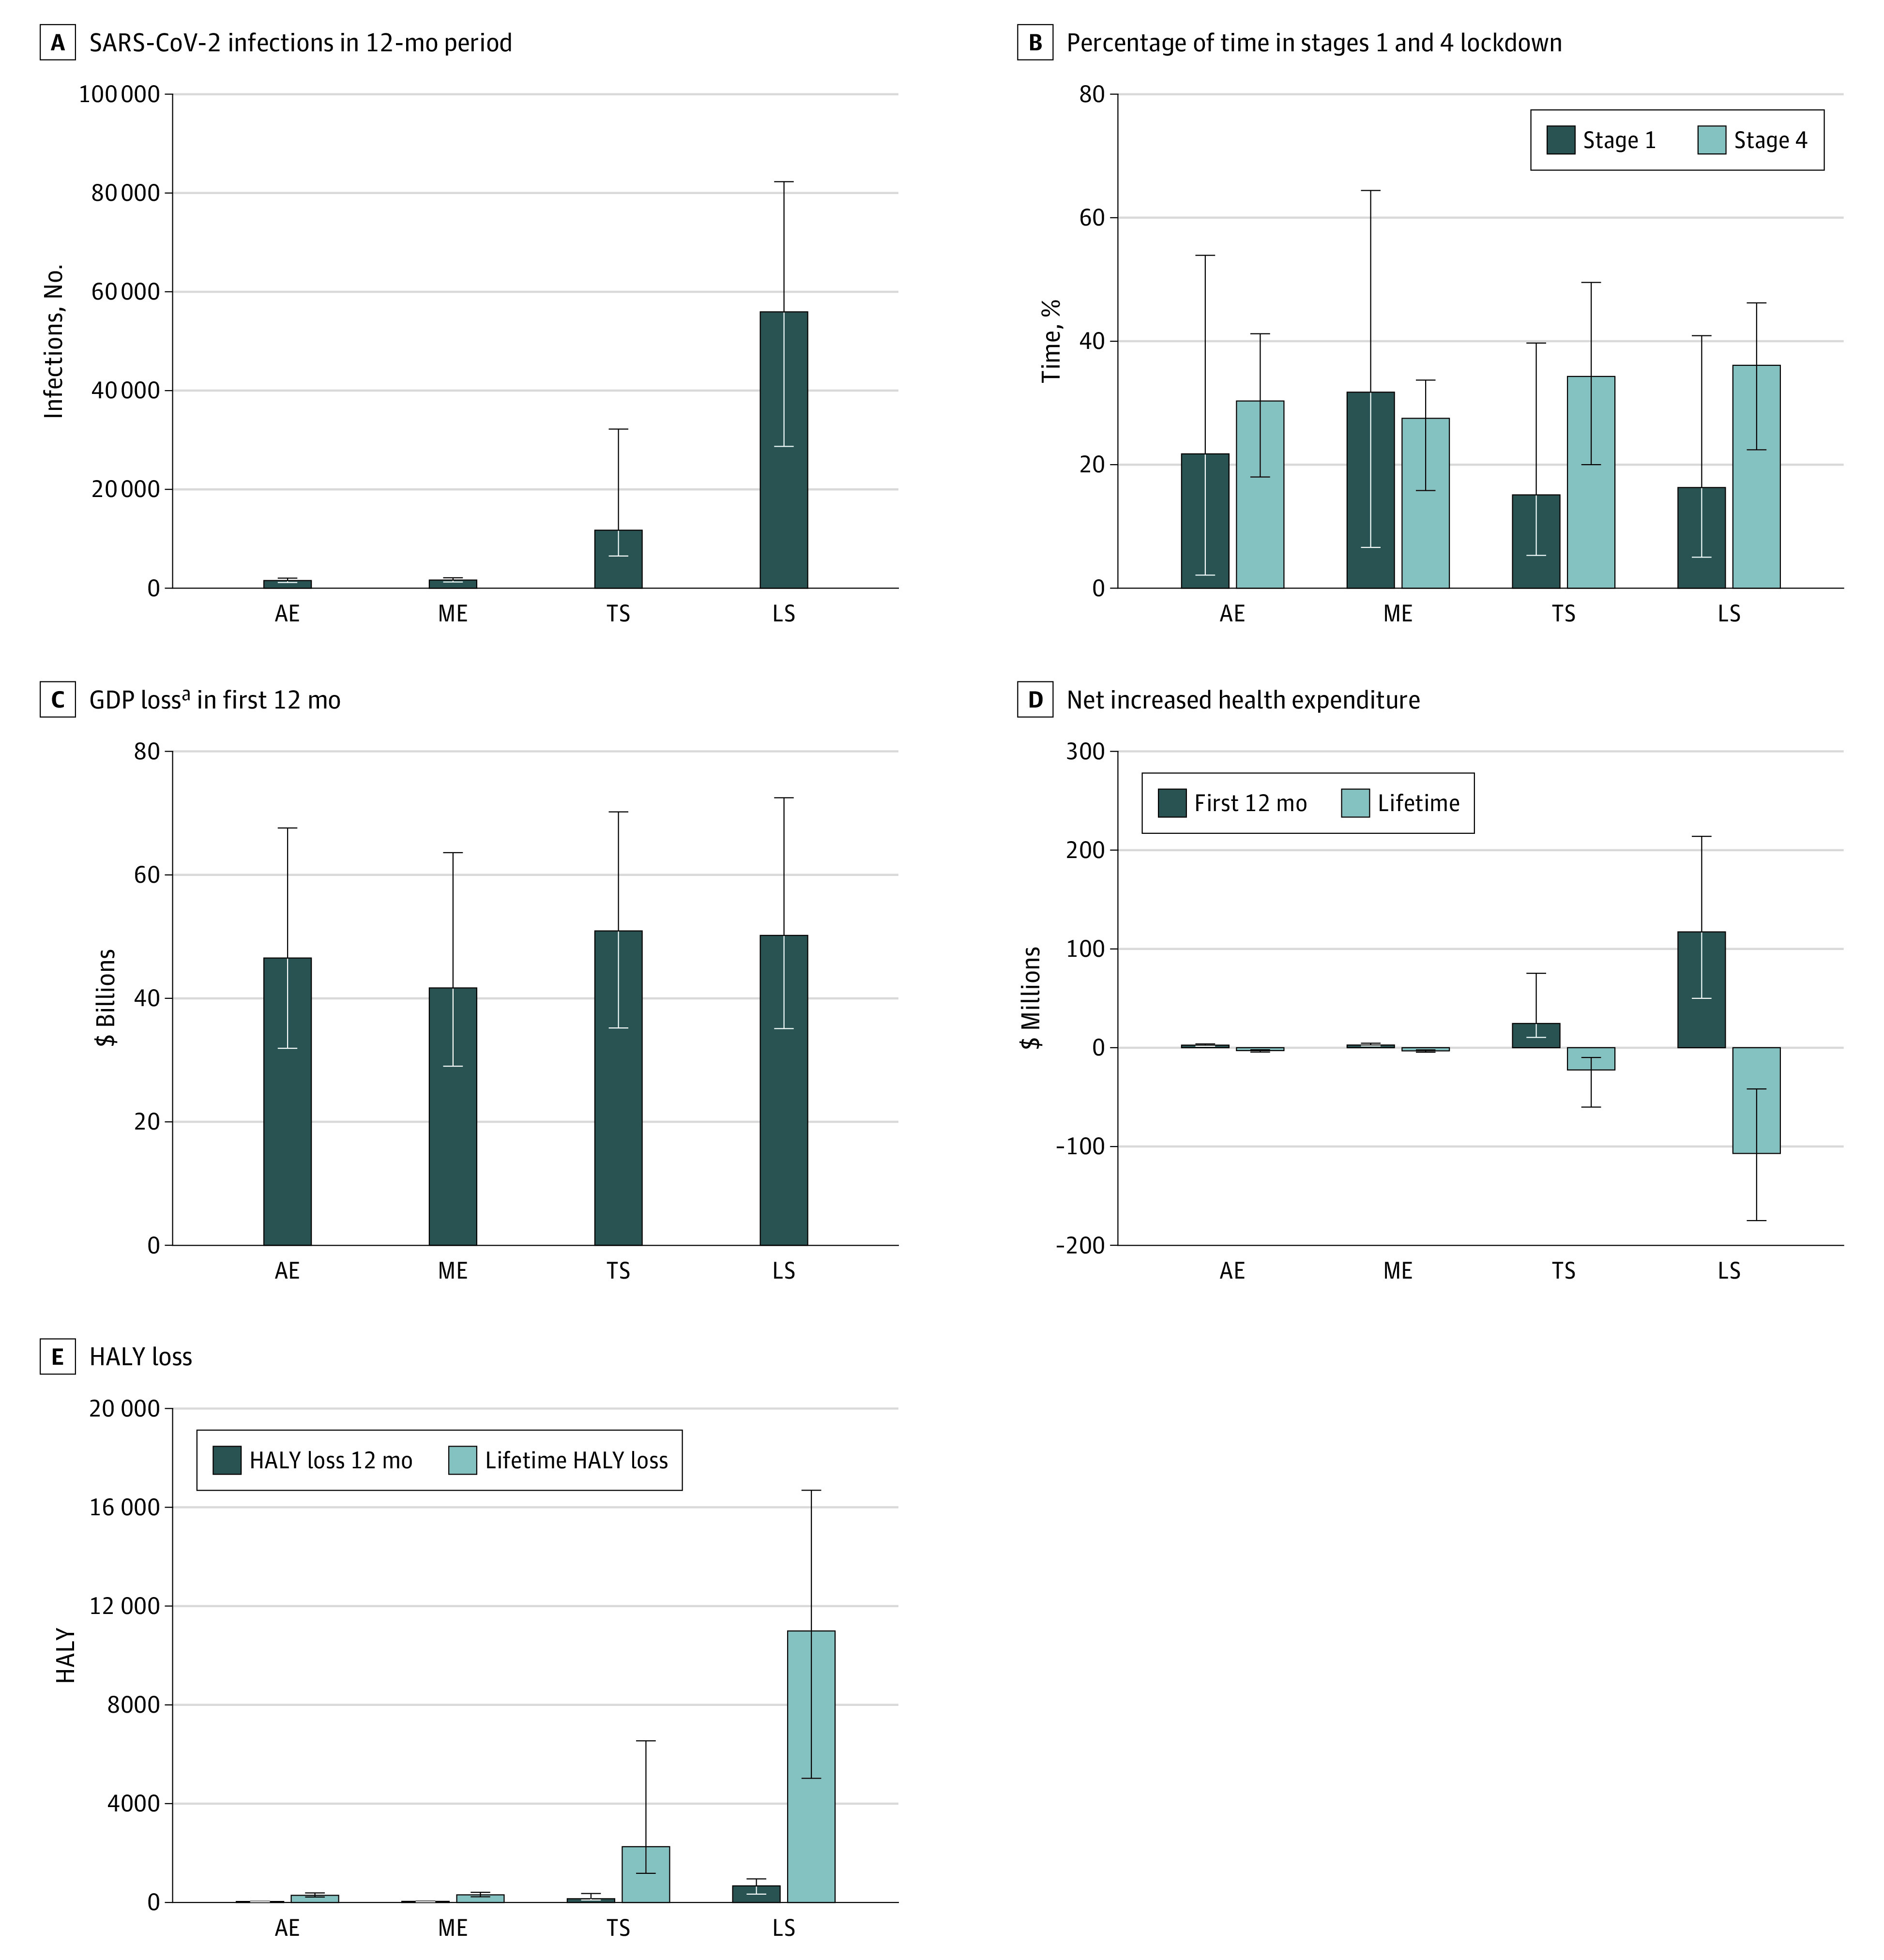
Main outcome and measures: Estimated SARS-CoV-2 infection rates, time under 5 stages of restrictions, HALYs, health expenditure, and GDP losses.
Results: In 100 runs of both the ABM and PMSLT models for each of the 4 policy responses, 31.0% of SARS-CoV-2 infections, 56.5% of hospitalizations, and 84.6% of deaths occurred among those 60 years and older. Aggressive elimination was associated with the highest percentage of days with the lowest level of restrictions (median, 31.7%; 90% simulation interval [SI], 6.6%-64.4%). However, days in hard lockdown were similar across all 4 strategies. The HALY losses (compared with a scenario without COVID-19) were similar for aggressive elimination (median, 286 HALYs; 90% SI, 219-389 HALYs) and moderate elimination (median, 314 HALYs; 90% SI, 228-413 HALYs), and nearly 8 and 40 times higher for tight suppression and loose suppression, respectively. The median GDP loss was least for moderate elimination (median, $41.7 billion; 90% SI, $29.0-$63.6 billion), but there was substantial overlap in simulation intervals between the 4 strategies. From a health system perspective, aggressive elimination was optimal in 64% of simulations above a WTP of $15 000 per HALY, followed by moderate elimination in 35% of simulations. Moderate elimination was optimal from a GDP perspective in half of the simulations, followed by aggressive elimination in a quarter.
Conclusions and relevance: In this simulation modeling economic evaluation of estimated SARS-CoV-infection rates, time under 5 stages of restrictions, HALYs, health expenditure, and GDP losses in Victoria, Australia, an elimination strategy was associated with the least health losses and usually the fewest GDP losses.
Copyright 2021 Blakely T et al. JAMA Health Forum.
Conflict of interest statement
Conflict of Interest Disclosures: Dr Bablani reported receiving grants from the Health Research Council of New Zealand outside of the submitted work. No other disclosures were reported.
Figures
Similar articles
-
Health Economic Consequences Associated With COVID-19-Related Delay in Melanoma Diagnosis in Europe.JAMA Netw Open. 2024 Feb 5;7(2):e2356479. doi: 10.1001/jamanetworkopen.2023.56479. JAMA Netw Open. 2024. PMID: 38363565 Free PMC article.
-
Assessing COVID-19 pandemic policies and behaviours and their economic and educational trade-offs across US states from Jan 1, 2020, to July 31, 2022: an observational analysis.Lancet. 2023 Apr 22;401(10385):1341-1360. doi: 10.1016/S0140-6736(23)00461-0. Epub 2023 Mar 23. Lancet. 2023. PMID: 36966780 Free PMC article.
-
The potential health and economic value of SARS-CoV-2 vaccination alongside physical distancing in the UK: a transmission model-based future scenario analysis and economic evaluation.Lancet Infect Dis. 2021 Jul;21(7):962-974. doi: 10.1016/S1473-3099(21)00079-7. Epub 2021 Mar 18. Lancet Infect Dis. 2021. PMID: 33743846 Free PMC article.
-
COVID-19 in Germany and China: mitigation versus elimination strategy.Glob Health Action. 2021 Jan 1;14(1):1875601. doi: 10.1080/16549716.2021.1875601. Glob Health Action. 2021. PMID: 33472568 Free PMC article. Review.
-
Mental health consequences of COVID-19 suppression strategies in Victoria, Australia: a narrative review.J Int Med Res. 2022 Nov;50(11):3000605221134466. doi: 10.1177/03000605221134466. J Int Med Res. 2022. PMID: 36352494 Free PMC article. Review.
Cited by
-
Public Health Management of the COVID-19 Pandemic in Australia: The Role of the Morrison Government.Int J Environ Res Public Health. 2022 Aug 20;19(16):10400. doi: 10.3390/ijerph191610400. Int J Environ Res Public Health. 2022. PMID: 36012035 Free PMC article.
-
We should not dismiss the possibility of eradicating COVID-19: comparisons with smallpox and polio.BMJ Glob Health. 2021 Aug;6(8):e006810. doi: 10.1136/bmjgh-2021-006810. BMJ Glob Health. 2021. PMID: 34373261 Free PMC article. No abstract available.
-
The role of economic evaluation in modelling public health and social measures for pandemic policy: a systematic review.Cost Eff Resour Alloc. 2024 Nov 1;22(1):77. doi: 10.1186/s12962-024-00585-6. Cost Eff Resour Alloc. 2024. PMID: 39487485 Free PMC article.
-
Modelling SARS-CoV-2 disease progression in Australia and New Zealand: an account of an agent-based approach to support public health decision-making.Aust N Z J Public Health. 2022 Jun;46(3):292-303. doi: 10.1111/1753-6405.13221. Epub 2022 Mar 3. Aust N Z J Public Health. 2022. PMID: 35238437 Free PMC article.
-
Modelling herd immunity requirements in Queensland: impact of vaccination effectiveness, hesitancy and variants of SARS-CoV-2.Philos Trans A Math Phys Eng Sci. 2022 Oct 3;380(2233):20210311. doi: 10.1098/rsta.2021.0311. Epub 2022 Aug 15. Philos Trans A Math Phys Eng Sci. 2022. PMID: 35965469 Free PMC article.
References
-
- Soled D, Bayefsky M, Nayak R. When does the cure become worse than the disease? applying cost-benefit analysis to the Covid-19 recovery. Journal of Medical Ethics. May 19, 2020. Accessed July 6, 2021. https://blogs.bmj.com/medical-ethics/2020/05/19/when-does-the-cure-becom...
Publication types
MeSH terms
LinkOut - more resources
Full Text Sources
Medical
Miscellaneous