Association of Wealth With Longevity in US Adults at Midlife
- PMID: 35977209
- PMCID: PMC8796893
- DOI: 10.1001/jamahealthforum.2021.1652
Association of Wealth With Longevity in US Adults at Midlife
Abstract
Importance: Wealthy adults tend to live longer than those with less wealth. However, a challenge in this area of research has been the reduction of potential confounding by factors associated with the early environment and heritable traits, which could simultaneously affect socioeconomic circumstances in adulthood and health across the life course.
Objective: To identify the association between net worth at midlife and subsequent all-cause mortality in individuals as well as within siblings and twin pairs.
Design setting and participants: This cohort study conducted a series of analyses using data from the Midlife in the United States (MIDUS) study, an ongoing national study of health and aging. The sample included adults (unrelated individuals, full siblings, and dizygotic and monozygotic twins) aged 20 to 75 years, who participated in wave 1 of the MIDUS study, which occurred from 1994 to 1996. The analyses were conducted between November 16, 2019, and May 18, 2021.
Exposures: Self-reported net worth (total financial assets minus liabilities) at midlife (the middle years of life).
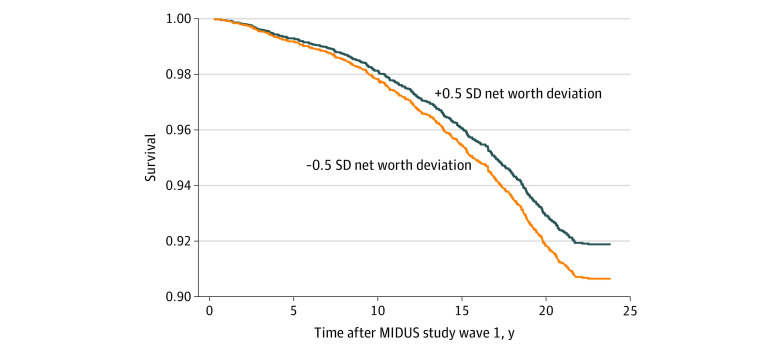
Main outcomes and measures: All-cause mortality was tracked over nearly 24 years of follow-up, with a censor date of October 31, 2018. Survival models tested the association between net worth and all-cause mortality. Discordant sibling and twin analyses compared longevity within siblings and twin pairs who, given their shared early experiences and genetic backgrounds, were matched on these factors.
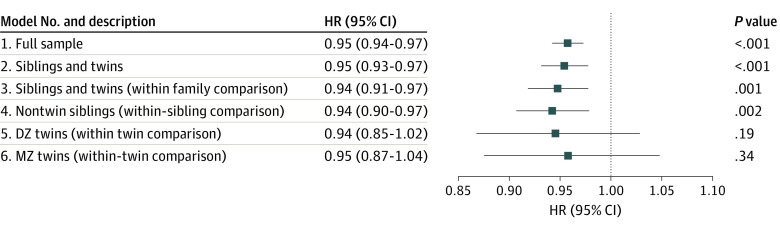
Results: The full sample comprised 5414 participants, who had a mean (SD) age of 46.7 (12.7) years and included 2766 women (51.1%). Higher net worth was associated with lower mortality risk (hazard ratio [HR], 0.95; 95% CI, 0.94-0.97; P < .001). Among siblings and twin pairs specifically (n = 2490), a similar within-family association was observed between higher net worth and lower mortality (HR, 0.94; 95% CI, 0.91-0.97; P = .001), suggesting that the sibling or twin with more wealth tended to live longer than their co-sibling or co-twin with less wealth. When separate estimates were performed for the subsamples of siblings (HR, 0.94; 95% CI, 0.90-0.97; P = .002), dizygotic twins (HR, 0.94; 95% CI, 0.86-1.02; P = .19), and monozygotic twins (HR, 0.95; 95% CI, 0.87-1.04; P = .34), the within-family estimates of the net worth-mortality association were similar, although the precision of estimates was reduced among twins.
Conclusions and relevance: This cohort study found that wealth accumulation at midlife was associated with longevity in US adults. Discordant sibling analyses suggested that this association is unlikely to be simply an artifact of early experiences or heritable characteristics shared by families.
Copyright 2021 Finegood ED et al. JAMA Health Forum.
Conflict of interest statement
Conflict of Interest Disclosures: Dr Krueger reported receiving grants from the National Institute on Aging (NIA) during the conduct of the study and outside the submitted work. Dr Miller reported receiving grants from the National Institutes of Health (NIH) outside the submitted work. No other disclosures were reported.
Figures
Comment in
-
The Pervasive Influence of Wealth Inequality on Health.JAMA Health Forum. 2021 Jul 2;2(7):e211647. doi: 10.1001/jamahealthforum.2021.1647. JAMA Health Forum. 2021. PMID: 36218777 No abstract available.
Similar articles
-
Associations Between General and Specific Psychopathology Factors and 10-Year Clinically Relevant Outcomes in Adult Swedish Twins and Siblings.JAMA Psychiatry. 2023 Jul 1;80(7):728-737. doi: 10.1001/jamapsychiatry.2023.1162. JAMA Psychiatry. 2023. PMID: 37163290 Free PMC article.
-
The Project TALENT Twin and Sibling Study.Twin Res Hum Genet. 2013 Feb;16(1):437-48. doi: 10.1017/thg.2012.71. Epub 2012 Oct 29. Twin Res Hum Genet. 2013. PMID: 23101474 Free PMC article. Clinical Trial.
-
Lifetime socioeconomic position and twins' health: an analysis of 308 pairs of United States women twins.PLoS Med. 2005 Jul;2(7):e162. doi: 10.1371/journal.pmed.0020162. Epub 2005 Jul 26. PLoS Med. 2005. PMID: 16033303 Free PMC article.
-
Heritability of Psychological Traits and Developmental Milestones in Infancy: A Systematic Review and Meta-analysis.JAMA Netw Open. 2022 Aug 1;5(8):e2227887. doi: 10.1001/jamanetworkopen.2022.27887. JAMA Netw Open. 2022. PMID: 35994288 Free PMC article.
-
Midlife in the 2020s: Opportunities and challenges.Am Psychol. 2020 May-Jun;75(4):470-485. doi: 10.1037/amp0000591. Am Psychol. 2020. PMID: 32378943 Free PMC article. Review.
Cited by
-
Effect of wealth inequality on child and infant mortality in Togo.BMC Health Serv Res. 2022 Dec 9;22(1):1499. doi: 10.1186/s12913-022-08912-4. BMC Health Serv Res. 2022. PMID: 36482465 Free PMC article.
-
Self-Rated Health and Mortality: Moderation by Purpose in Life.Int J Environ Res Public Health. 2023 Jun 19;20(12):6171. doi: 10.3390/ijerph20126171. Int J Environ Res Public Health. 2023. PMID: 37372758 Free PMC article.
-
Associations between epigenetic age acceleration and longitudinal measures of psychosocioeconomic stress and status.Soc Sci Med. 2024 Jul;352:116990. doi: 10.1016/j.socscimed.2024.116990. Epub 2024 May 24. Soc Sci Med. 2024. PMID: 38824837 Free PMC article.
-
Assessment of self-satisfaction, happiness, and quality of life (QoL) among adults: An online survey.J Educ Health Promot. 2024 Aug 29;13:312. doi: 10.4103/jehp.jehp_1528_23. eCollection 2024. J Educ Health Promot. 2024. PMID: 39429833 Free PMC article.
-
Pharmaceutical Purchasing: a Review of the Landscape and Implications for Antidotal Therapies.J Med Toxicol. 2023 Jul;19(3):262-267. doi: 10.1007/s13181-023-00943-5. Epub 2023 May 30. J Med Toxicol. 2023. PMID: 37249803 Free PMC article. Review.