Factors Associated With Overuse of Health Care Within US Health Systems: A Cross-sectional Analysis of Medicare Beneficiaries From 2016 to 2018
- PMID: 35977230
- PMCID: PMC8903118
- DOI: 10.1001/jamahealthforum.2021.4543
Factors Associated With Overuse of Health Care Within US Health Systems: A Cross-sectional Analysis of Medicare Beneficiaries From 2016 to 2018
Erratum in
-
Erratum: Errors in Discussion Section and Supplement.JAMA Health Forum. 2022 Feb 25;3(2):e220132. doi: 10.1001/jamahealthforum.2022.0132. eCollection 2022 Feb. JAMA Health Forum. 2022. PMID: 35981146 Free PMC article.
Abstract
Importance: Overuse of health care is a pervasive threat to patients that requires measurement to inform the development of interventions.
Objective: To measure low-value health care use within health systems in the US and explore features of the health systems associated with low-value care delivery.
Design setting and participants: In this cross-sectional analysis, we identified occurrences of 17 low-value services in 3745 hospitals and affiliated outpatient sites. Hospitals were linked to 676 health systems in the US using the Agency for Healthcare Research and Quality (AHRQ) Compendium of Health Systems. The participants were 100% of Medicare beneficiaries with claims from 2016 to 2018.
Exposures: We identified occurrences of 17 low-value services in 3839 hospitals and affiliated outpatient sites.
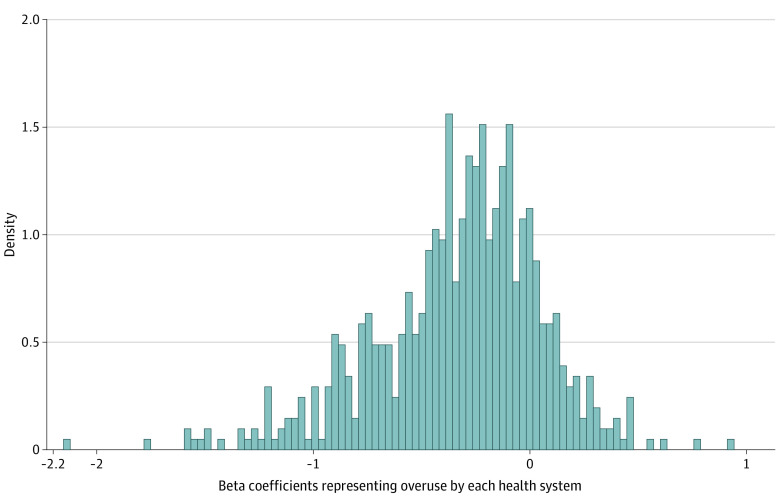
Main outcomes and measures: Hospitals were linked to health systems using AHRQ's Compendium of Health Systems. Between March and August 2021, we modeled overuse occurrences with a negative binomial regression model including the year-quarter, procedure indicator, and a health system indicator. The model included random effects for hospital and beneficiary age, sex, and comorbidity count specific to each indicator, hospital, and quarter. The beta coefficients associated with the health system term, normalized, reflect the tendency of that system to use low-value services relative to all other systems. With ordinary least squares regression, we explored health system characteristics associated with the Overuse Index (OI), expressed as a standard deviation where the mean across all health systems is 0.
Results: There were 676 unique health systems assessed in our study that included from 1 to 163 hospitals (median of 2). The mean age of eligible beneficiaries was 75.5 years and 76% were women. Relative to the lowest tertile, health systems in the upper tertile of medical groups count and bed count had an OI that was higher by 0.38 standard deviations (SD) and 0.44 SD, respectively. Health systems that were primarily investor owned had an OI that was 0.56 SD higher than those that were not investor owned. Relative to the lowest tertile, health systems in the upper tertile of primary care physicians, upper tertile of teaching intensity, and upper quartile of uncompensated care had an OI that was lower by 0.59 SD, 0.45 SD, and 0.47 SD, respectively.
Conclusions and relevance: In this cross-sectional study of US health systems, higher amounts of overuse among health systems were associated with investor ownership and fewer primary care physicians. The OI is a valuable tool for identifying potentially modifiable drivers of overuse and is adaptable to other levels of investigation, such as the state or region, which might be affected by local policies affecting payment or system consolidation.
Copyright 2022 Segal JB et al. JAMA Health Forum.
Conflict of interest statement
Conflict of Interest Disclosures: Dr Segal reported grants from the National Institute on Aging and grants from National Institute on Health Care Management during the conduct of the study; personal fees from Provention Bio, Gilead , Mathematic, DLP Piper, and the American College of Physicians, and grants from Altarum Institute and the Arnold Foundation outside the submitted work. Dr Sen reported grants from National Institute of Health Care Management during the conduct of the study. No other disclosures were reported.
Figures
Similar articles
-
Assessment of Overuse of Medical Tests and Treatments at US Hospitals Using Medicare Claims.JAMA Netw Open. 2021 Apr 1;4(4):e218075. doi: 10.1001/jamanetworkopen.2021.8075. JAMA Netw Open. 2021. PMID: 33904912 Free PMC article.
-
Low-Value Care at the Actionable Level of Individual Health Systems.JAMA Intern Med. 2021 Nov 1;181(11):1490-1500. doi: 10.1001/jamainternmed.2021.5531. JAMA Intern Med. 2021. PMID: 34570170 Free PMC article.
-
Comparison of Low-Value Services Among Medicare Advantage and Traditional Medicare Beneficiaries.JAMA Health Forum. 2022 Sep 2;3(9):e222935. doi: 10.1001/jamahealthforum.2022.2935. JAMA Health Forum. 2022. PMID: 36218933 Free PMC article.
-
Organization and Performance of US Health Systems.JAMA. 2023 Jan 24;329(4):325-335. doi: 10.1001/jama.2022.24032. JAMA. 2023. PMID: 36692555
-
Less Is More (Healthy): Overuse of Healthcare Services.Isr Med Assoc J. 2022 Jun;24(6):403-409. Isr Med Assoc J. 2022. PMID: 35734841 Review.
Cited by
-
Shifts in total medical expenses by health coverage changes among the low-income, medically vulnerable population in South Korea.Environ Health Prev Med. 2025;30:36. doi: 10.1265/ehpm.24-00409. Environ Health Prev Med. 2025. PMID: 40350288 Free PMC article.
-
A more complete measure of vertical integration between physicians and hospitals.Health Serv Res. 2024 Aug;59(4):e14314. doi: 10.1111/1475-6773.14314. Epub 2024 Apr 30. Health Serv Res. 2024. PMID: 38689535 Free PMC article.
-
Relationship Between Insurance Status and Receipt of Cardiac Tests and Procedures During Hospitalization: A Cross-Sectional Study.J Am Heart Assoc. 2024 Oct;13(19):e035797. doi: 10.1161/JAHA.124.035797. Epub 2024 Sep 30. J Am Heart Assoc. 2024. PMID: 39344602 Free PMC article.
-
Randomized Experiments to Reduce Overuse of Health Care: A Scoping Review.Med Care. 2024 Apr 1;62(4):263-269. doi: 10.1097/MLR.0000000000001978. Epub 2024 Feb 5. Med Care. 2024. PMID: 38315879 Free PMC article.
-
Reducing Overuse by Healthcare Systems: A Positive Deviance Analysis.J Gen Intern Med. 2023 Aug;38(11):2519-2526. doi: 10.1007/s11606-023-08060-3. Epub 2023 Feb 13. J Gen Intern Med. 2023. PMID: 36781578 Free PMC article.
References
Publication types
MeSH terms
LinkOut - more resources
Full Text Sources
Medical