Trends in Dialysis Industry Consolidation After Medicare Payment Reform, 2006-2016
- PMID: 35977264
- PMCID: PMC8796909
- DOI: 10.1001/jamahealthforum.2021.3626
Trends in Dialysis Industry Consolidation After Medicare Payment Reform, 2006-2016
Abstract
Importance: The dialysis industry is highly concentrated, with large dialysis organizations now providing dialysis for more than 85% of patients with kidney failure in the United States. In 2011, Medicare introduced a new Prospective Payment System (PPS) for end-stage kidney disease, which bundled payment for dialysis care into 1 payment per patient. Trends in dialysis facility consolidation after the PPS went into effect are unknown.
Objective: To determine whether the introduction of the PPS in 2011 was associated with an acceleration in acquisitions and closures of small dialysis chains (<20 facilities) and independently owned facilities.
Design setting and participants: This retrospective cohort study included all Medicare-certified independent or small chain-affiliated dialysis facilities in the continental US between 2006 and 2016. Data were obtained from Medicare and the US Renal Data System and were analyzed in 2020.
Exposures: The PPS.
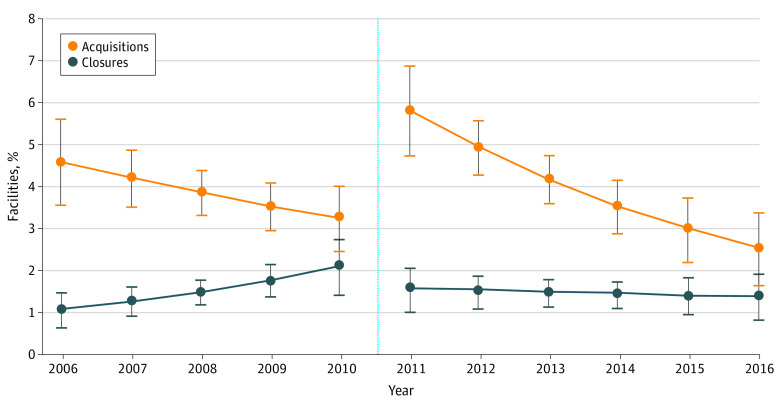
Main outcomes and measures: Discrete time hazard models were used to estimate the odds of acquisition and closure before the PPS (2006-2010) vs after the PPS (2011-2016). Analyses controlled for facility, market, and regional demographic characteristics. The average predicted marginal probabilities of acquisition and closure over time were estimated.
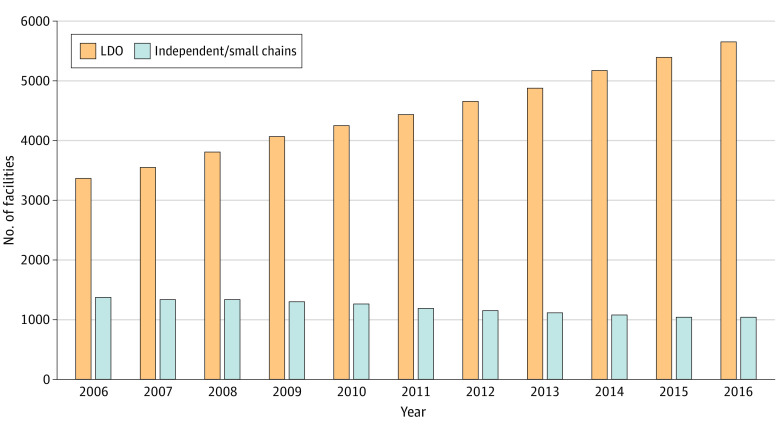
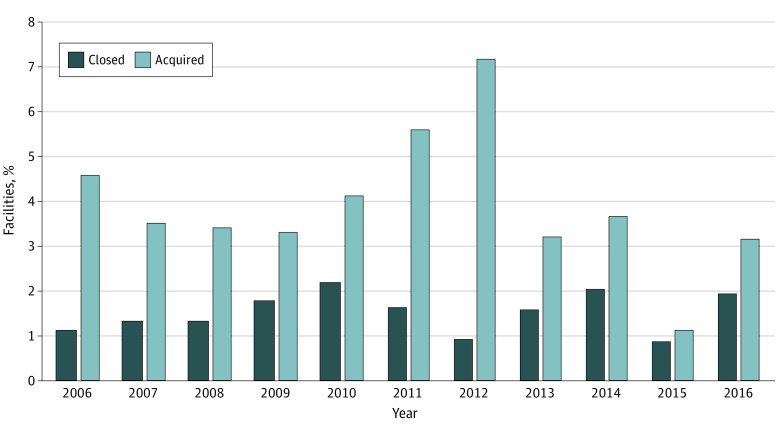
Results: The proportion of small chain-affiliated and independently owned facilities declined from 29% (1383 of 4750 facilities) in 2006 to 15% (1038 of 6738) in 2016. Among 13 481 facility-years, 6352 (47%) were for profit, and mean (SD) census was 68 (59) patients. Overall, 3286 (24%) facilities opened during the observation period. The proportion of acquisitions that occurred each year varied from 1.1% (12 of 1065 facilities in 2015) to 7.2% (86 of 1192 facilities in 2012), while closures varied from 0.8% (9 of 1065 facilities in 2015) to 2.2% (28 of 1286 facilities in 2010), making both fairly rare. There was a 3.48 higher odds of acquisition in the post-PPS period compared with the pre-PPS period (95% CI, 1.62-7.47; P = .001). The odds of closure before and after the PPS were not statistically significantly different (odds ratio, 2.03; 95% CI, 0.61-6.73; P = .25). Facilities that opened during the observation period had a 7.2% higher predicted probability of acquisition compared with older facilities (95% CI, 5.4%-9.0%; P < .001).
Conclusions and relevance: In this cohort study of continental US Medicare-certified dialysis facilities, small-chain and independently owned facilities retained a declining share of the dialysis market. Further research should evaluate the effect of continued dialysis market consolidation on patient access, health care utilization, and clinical outcomes.
Copyright 2021 Sloan CE et al. JAMA Health Forum.
Conflict of interest statement
Conflict of Interest Disclosures: Dr Sloan reports grants from the National Institutes of Health (NIH) outside the submitted work. Dr Maciejewski reports grants from NIH and the Department of Veterans Affairs, a contract from the National Committee for Quality Assurance, and ownership of Amgen stock owing to his spouse’s employment outside the submitted work. Dr Coffman reports grants from NIH and the Department of Veterans Affairs during the conduct of the study. Dr Wang reports grants from the National Institute of Diabetes and Digestive and Kidney Diseases, the Department of Veterans Affairs, and the Agency for Healthcare Research and Quality; a contract with the National Committee for Quality Assurance; and honoraria from NIH outside the submitted work. No other disclosures were reported.
Figures
Comment in
-
How Did Medicare Payment Reform Affect Highly Concentrated Dialysis Markets?JAMA Health Forum. 2021 Nov 2;2(11):e213378. doi: 10.1001/jamahealthforum.2021.3378. JAMA Health Forum. 2021. PMID: 36218842 No abstract available.
References
-
- United States Renal Data System . 2019 USRDS annual data report: epidemiology of kidney disease in the United States. National Institute of Diabetes and Digestive and Kidney Diseases. 2019. Accessed October 16, 2021. https://www.usrds.org/annual-data-report/
-
- Baker S. The U.S. health care system is full of monopolies. Axios. June 10, 2019. Accessed October 6, 2021. https://www.axios.com/health-care-costs-monopolies-competition-hospitals...
-
- Eliason PJ, Heebsh B, McDevitt RC, Roberts JW. How acquisitions affect firm behavior and performance: evidence from the dialysis industry. Q J Econ. 2020;135(1):221-267. doi: 10.1093/qje/qjz034 - DOI
Publication types
MeSH terms
Grants and funding
LinkOut - more resources
Full Text Sources
Medical