Comparison of Dental Care Visits Before and After Adoption of a Policy to Expand the Dental Workforce in Minnesota
- PMID: 35977282
- PMCID: PMC8933736
- DOI: 10.1001/jamahealthforum.2022.0158
Comparison of Dental Care Visits Before and After Adoption of a Policy to Expand the Dental Workforce in Minnesota
Abstract
Importance: Currently, 13 states and tribal nations have expanded their dental workforce by adopting use of dental therapists. To date, there has been no evaluation of the influence of this policy on dental care use.
Objective: To assess changes in dental care use in Minnesota after the implementation of the policy to authorize dental therapists in 2009.
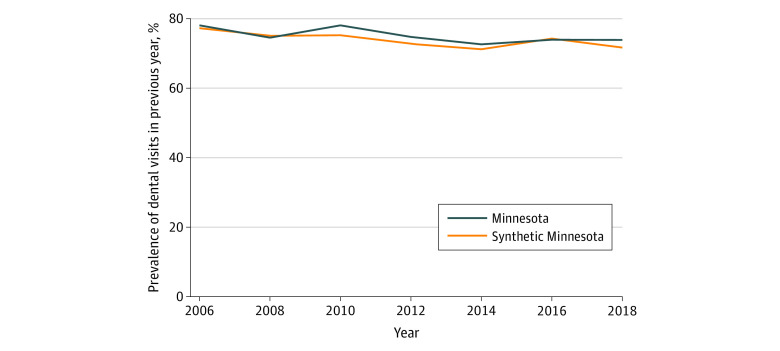
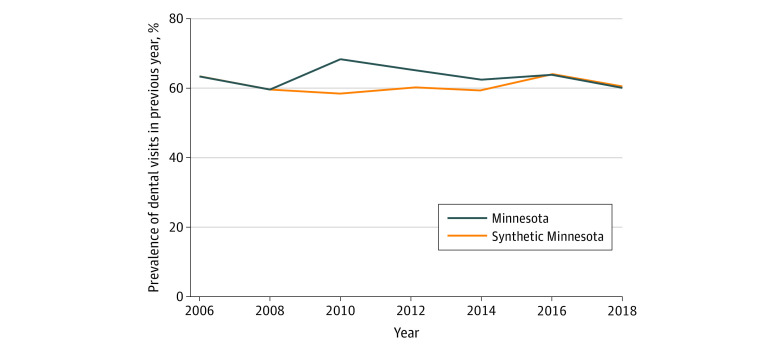
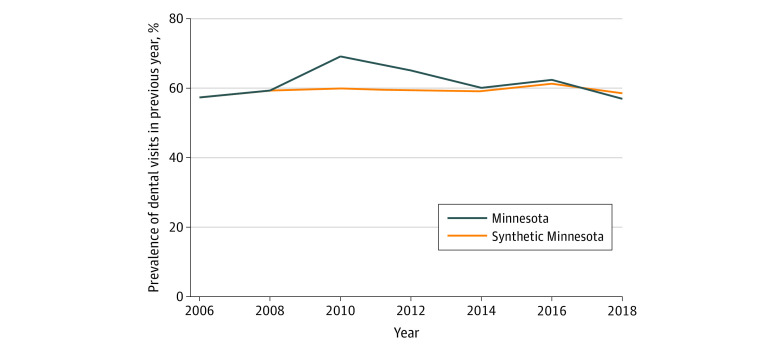
Design setting and participants: In this cross-sectional study of 2 613 716 adults aged 18 years and older, a synthetic control method was used to compare changes in dental care use after the authorization of the policy in Minnesota relative to a synthetic control of nonadopting states. Data from the Behavioral Risk Factor Surveillance System from 2006 to 2018 were analyzed. Data analysis was conducted from June 1, 2021, to December 18, 2021.
Exposure: Authorization of dental therapy.
Main outcomes and measures: Self-reported indicator for whether a respondent had visited a dentist or a dental clinic in the past 12 months.
Results: Among 2 613 716 adults aged 18 years or older, the mean (SD) age at baseline was 46.0 (17.7) years, 396 501 were women (weighted percentage, 51.3%), 503 197 were White (weighted percentage, 67.9%), 54 568 were Black (weighted percentage, 10.1%), 39 282 were Hispanic (weighted percentage, 14.5%), and 34 739 were other race (weighted percentage, 6.7%). The proportion of adults visiting a dentist before the authorization of dental therapists in Minnesota was 76.2% (95% CI, 75.0%-77.4%) in the full sample, 61.5% (95% CI, 58.4%-64.6%) for low-income adults, and 58.4% (95% CI, 53.0%-63.5%) among Medicaid-eligible adults. Authorizing dental therapists in Minnesota was associated with an increase of 7.3 percentage points (95% CI, 5.0-9.5 percentage points) in dental care use among low-income adults, a relative increase of 12.5% (95% CI, 8.6%-16.4%), and an increase of 6.2 percentage points (95% CI, 2.4-10.0 percentage points) among Medicaid-eligible adults, a relative increase of 10.5% (95% CI, 3.9%-17.0%). In addition, the policy was associated with an increase in dental visits among White adults (low-income sample, 10.8 percentage points [95% CI, 8.5-13.0 percentage points]; Medicaid sample, 13.5 percentage points [95% CI, 9.1-17.9 percentage points]), with no corresponding increases among other racial and ethnic groups in the low-income and Medicaid population.
Conclusions and relevance: In this cross-sectional study, expanding the dental workforce through authorization of dental therapists appeared to be associated with an increase in dental visits. In Minnesota, the policy was associated with improved access to dental care among low-income adults overall. However, racial and ethnic disparities in dental use persist.
Copyright 2022 Elani HW et al. JAMA Health Forum.
Conflict of interest statement
Conflict of Interest Disclosures: Dr Elani reported receiving grants from the National Institute on Minority Health and Health Disparities (NIMHD) during the conduct of the study. No other disclosures were reported.
Figures
References
-
- Kaiser Family Foundation . Dental care health professional shortage areas (HPSAs). Accessed May 26, 2021. https://www.kff.org/other/state-indicator/dental-care-health-professiona...
Publication types
MeSH terms
Grants and funding
LinkOut - more resources
Full Text Sources
Medical
Miscellaneous