Uptake of COVID-19 Vaccination Among Frontline Workers in California State Prisons
- PMID: 35977288
- PMCID: PMC8917424
- DOI: 10.1001/jamahealthforum.2022.0099
Uptake of COVID-19 Vaccination Among Frontline Workers in California State Prisons
Abstract
Importance: Prisons and jails are high-risk environments for COVID-19. Vaccination levels among workers in many such settings remain markedly lower than those of residents and members of surrounding communities. The situation is troubling because prison staff are a key vector for COVID-19 transmission.
Objective: To assess patterns and timing of staff vaccination in California state prisons and identify individual-level and community-level factors associated with remaining unvaccinated.
Design setting and participants: This cohort study used data from December 22, 2020, through June 30, 2021, to quantify the fractions of staff and incarcerated residents who remained unvaccinated among 23 472 custody and 7617 health care staff who worked in roles requiring direct contact with residents at 33 of the 35 prisons operated by the California Department of Corrections and Rehabilitation. Multivariable probit regressions assessed demographic, community, and peer factors associated with staff vaccination uptake.
Main outcomes and measures: Remaining unvaccinated throughout the study period.
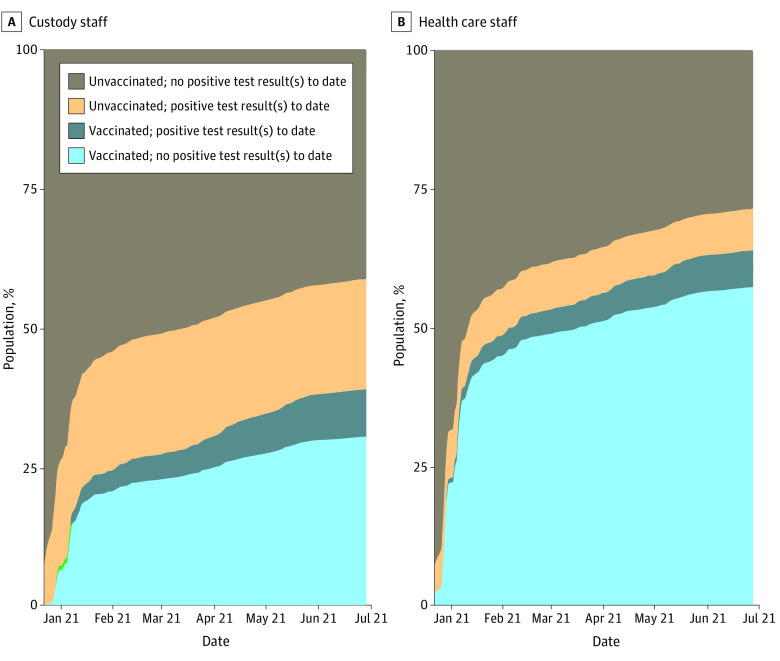
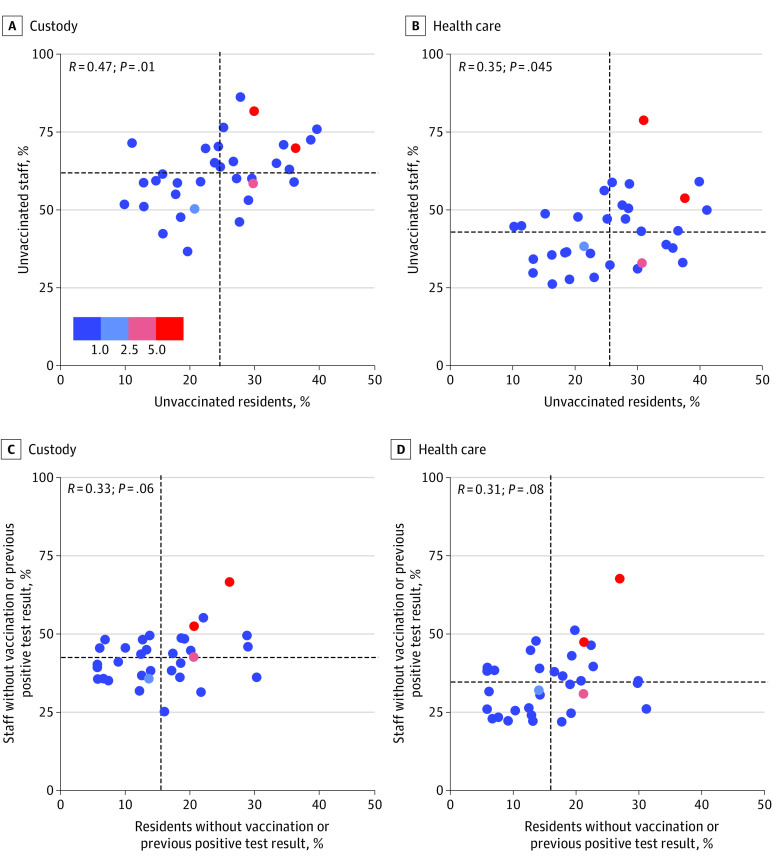
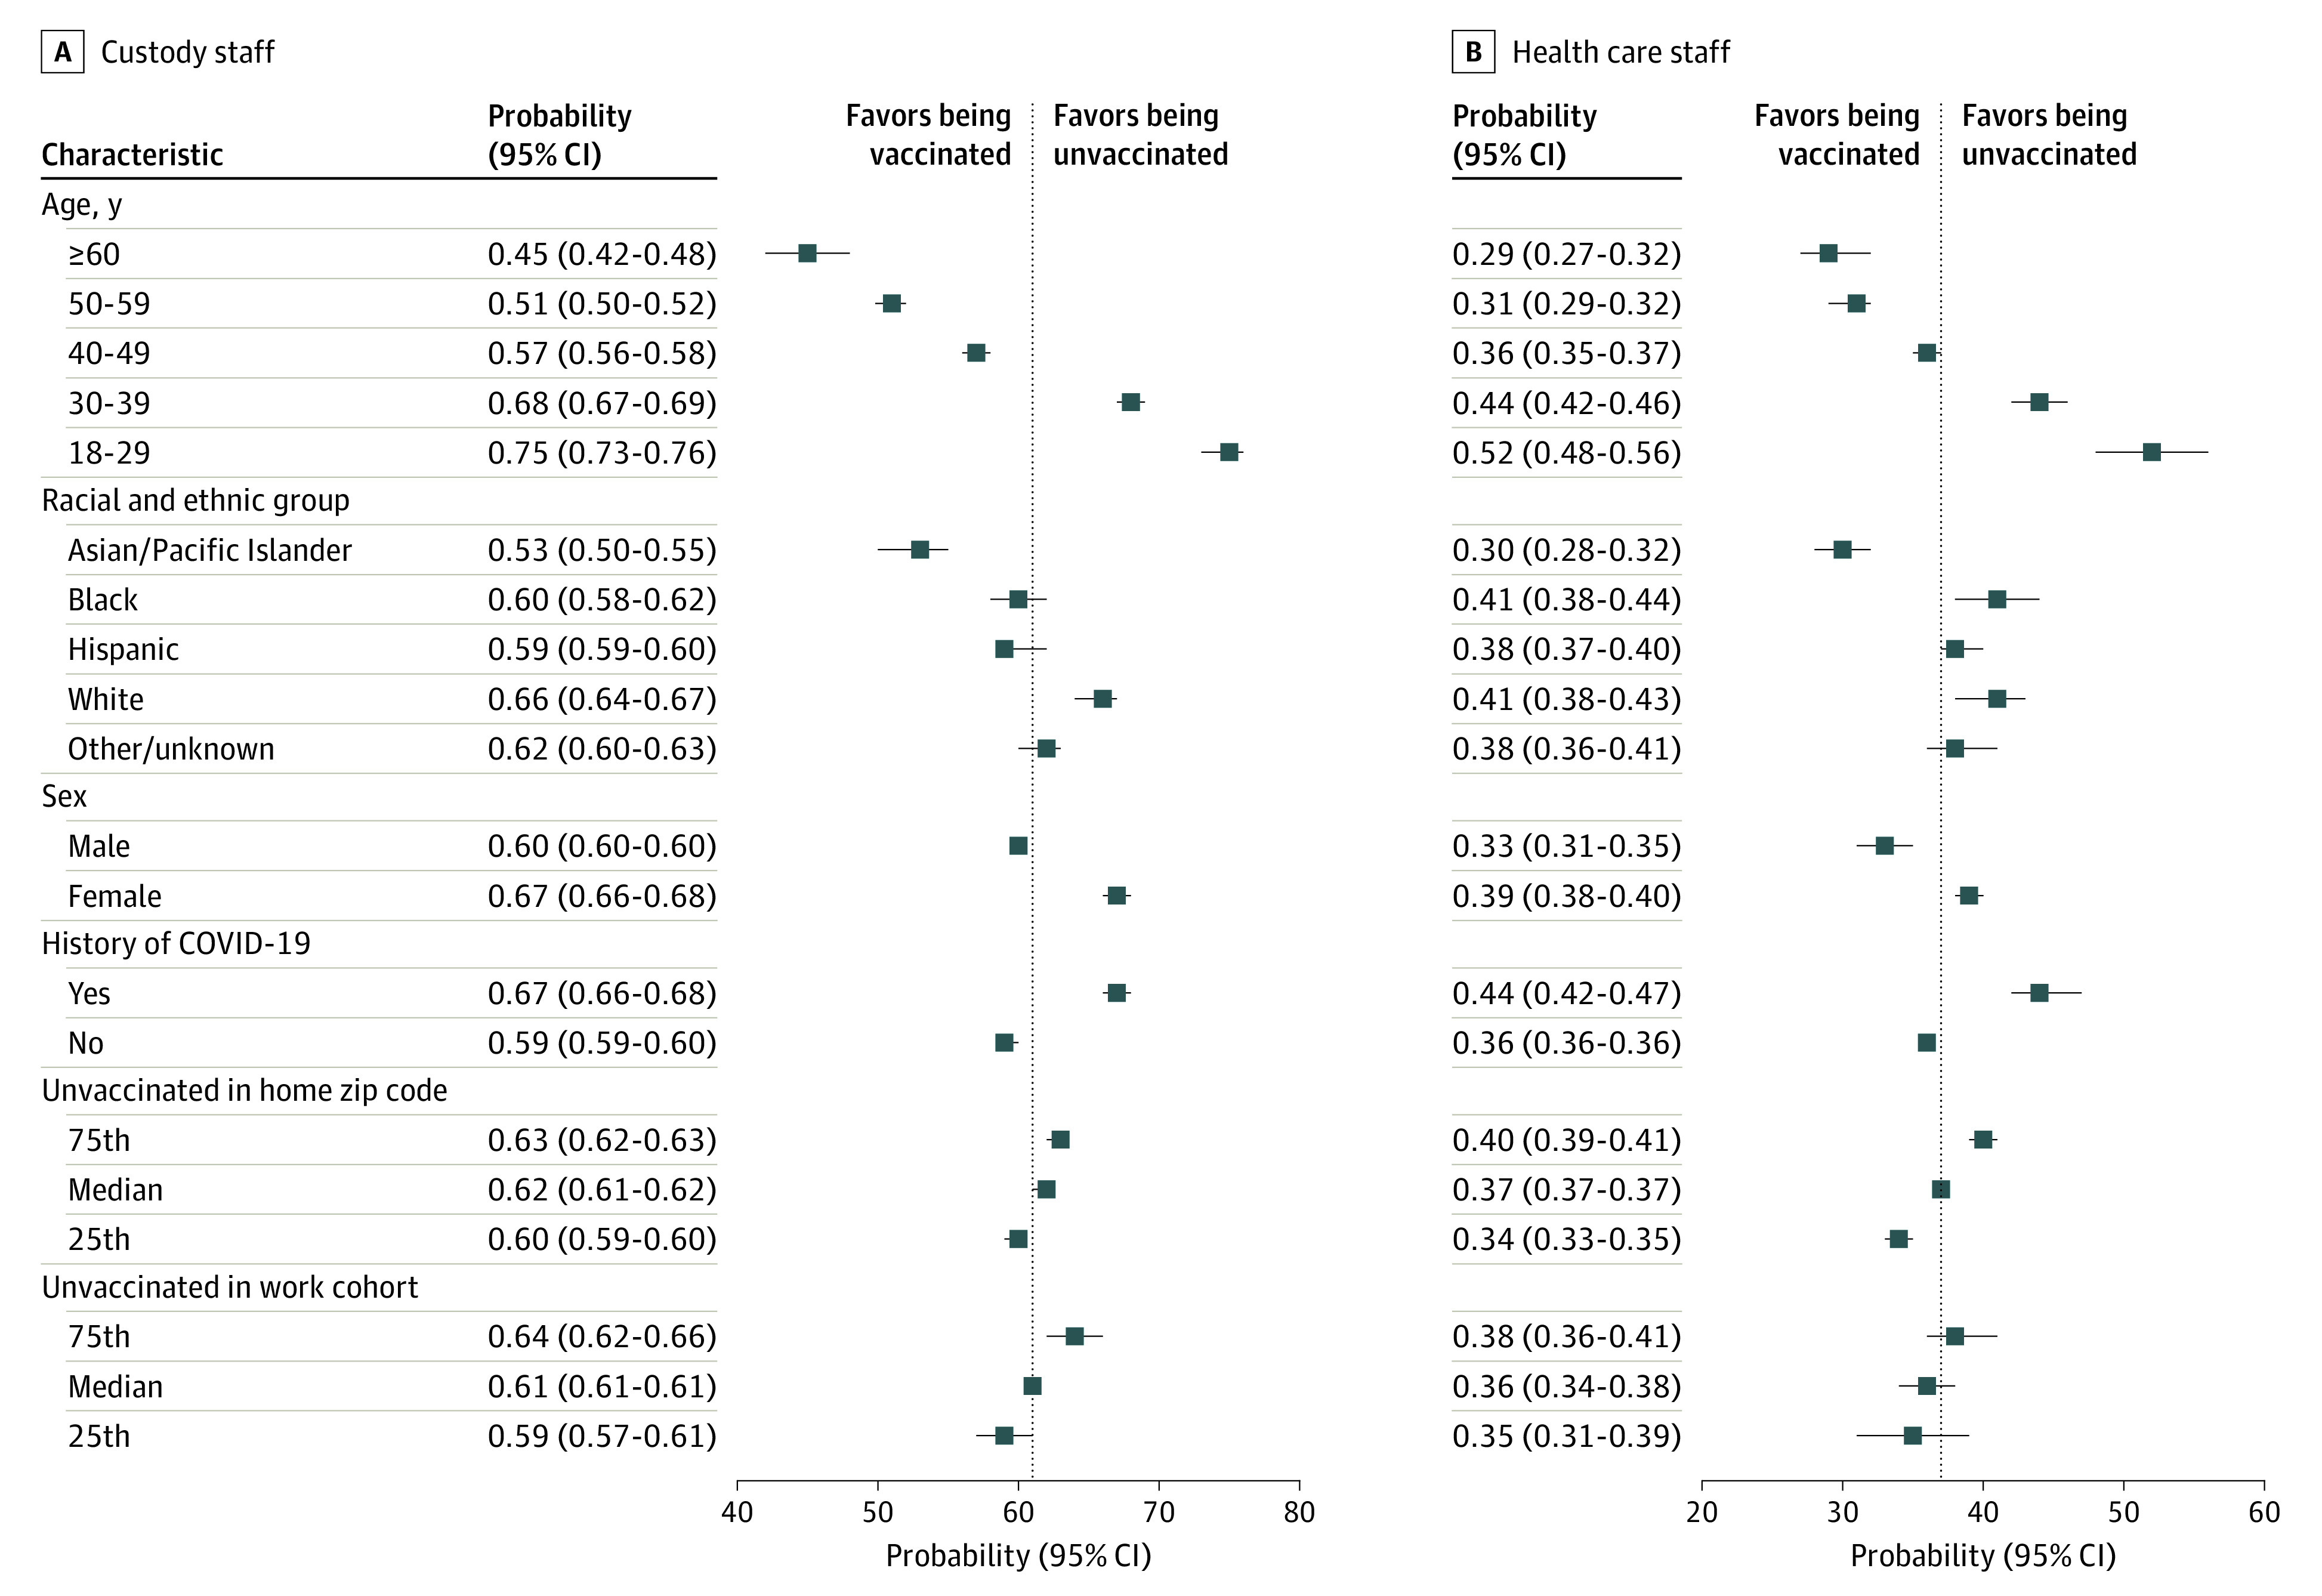
Results: Of 23 472 custody staff, 3751 (16%) were women, and 1454 (6%) were Asian/Pacific Islander individuals, 1571 (7%) Black individuals, 9008 (38%) Hispanic individuals, and 6666 (28%) White individuals. Of 7617 health care staff, 5434 (71%) were women, and 2148 (28%) were Asian/Pacific Islander individuals, 1201 (16%) Black individuals, 1409 (18%) Hispanic individuals, and 1771 (23%) White individuals. A total of 6103 custody staff (26%) and 3961 health care staff (52%) received 1 or more doses of a COVID-19 vaccine during the first 2 months vaccines were offered, but vaccination rates stagnated thereafter. By June 30, 2021, 14 317 custody staff (61%) and 2819 health care staff (37%) remained unvaccinated. In adjusted analyses, remaining unvaccinated was positively associated with younger age (custody staff: age, 18-29 years vs ≥60 years, 75% [95% CI, 73%-76%] vs 45% [95% CI, 42%-48%]; health care staff: 52% [95% CI, 48%-56%] vs 29% [95% CI, 27%-32%]), prior COVID-19 infection (custody staff: 67% [95% CI, 66%-68%] vs 59% [95% CI, 59%-60%]; health care staff: 44% [95% CI, 42%-47%] vs 36% [95% CI, 36%-36%]), residing in a community with relatively low rates of vaccination (custody staff: 75th vs 25th percentile:, 63% [95% CI, 62%-63%] vs 60% [95% CI, 59%-60%]; health care staff: 40% [95% CI, 39%-41%] vs 34% [95% CI, 33%-35%]), and sharing shifts with coworkers who had relatively low rates of vaccination (custody staff: 75th vs 25th percentile, 64% [95% CI, 62%-66%] vs 59% [95% CI, 57%-61%]; health care staff: 38% [95% CI, 36%-41%] vs 35% [95% CI, 31%-39%]).
Conclusions and relevance: This cohort study of California state prison custody and health care staff found that vaccination uptake plateaued at levels that posed ongoing risks of further outbreaks in the prisons and continuing transmission from prisons to surrounding communities. Prison staff decisions to forgo vaccination appear to be multifactorial, and vaccine mandates may be necessary to achieve adequate levels of immunity in this high-risk setting.
Copyright 2022 Prince L et al. JAMA Health Forum.
Conflict of interest statement
Conflict of Interest Disclosures: Dr Studdert reported research support from the Horowitz Family Foundation and grants from the National Institute on Drug Abuse, US Centers for Disease Control and Prevention (CDC), and National Science Foundation during the conduct of the study. Dr Leidner reported being an employee of the California Department of Corrections and Rehabilitation during the conduct of the study. Dr Andrews reported grants from Horowitz Foundation during the conduct of the study. Dr Salomon reported grants from the CDC through the Council of State and Territorial Epidemiologists during the conduct of the study. Dr Goldhaber-Fiebert reported grants from the National Institute on Drug Abuse, Covid-19 Emergency Response Fund at Stanford (Horowitz Foundation), Council of State and Territorial Epidemiologists (CDC), and the National Science Foundation during the conduct of the study. No other disclosures were reported.
Figures
Comment in
-
Meeting the Moment by Vaccinating Prison Staff Against COVID-19.JAMA Health Forum. 2022 Mar 1;3(3):e220107. doi: 10.1001/jamahealthforum.2022.0107. JAMA Health Forum. 2022. PMID: 36218873 No abstract available.
References
-
- The Marshall Project . A state-by-state look at coronavirus in prisons. The Marshall Project. Accessed June 9, 2021. https://www.themarshallproject.org/2020/05/01/a-state-by-state-look-at-c...
-
- The Covid Prison Project . The COVID Prison Project tracks data and policy across the country to monitor COVID-19 in prisons. Accessed October 21, 2021. https://covidprisonproject.com/
Publication types
MeSH terms
Substances
Grants and funding
LinkOut - more resources
Full Text Sources
Medical