. 2022 Aug 16;3(8):100717.
doi: 10.1016/j.xcrm.2022.100717.

hiPSC-derived bone marrow milieu identifies a clinically actionable driver of niche-mediated treatment resistance in leukemia

Affiliations

hiPSC-derived bone marrow milieu identifies a clinically actionable driver of niche-mediated treatment resistance in leukemia

Deepali Pal et al. Cell Rep Med. .

Abstract

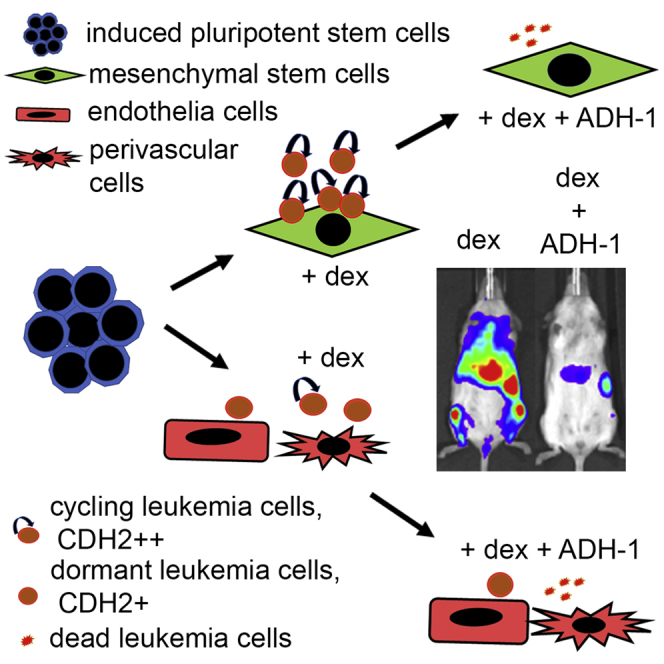
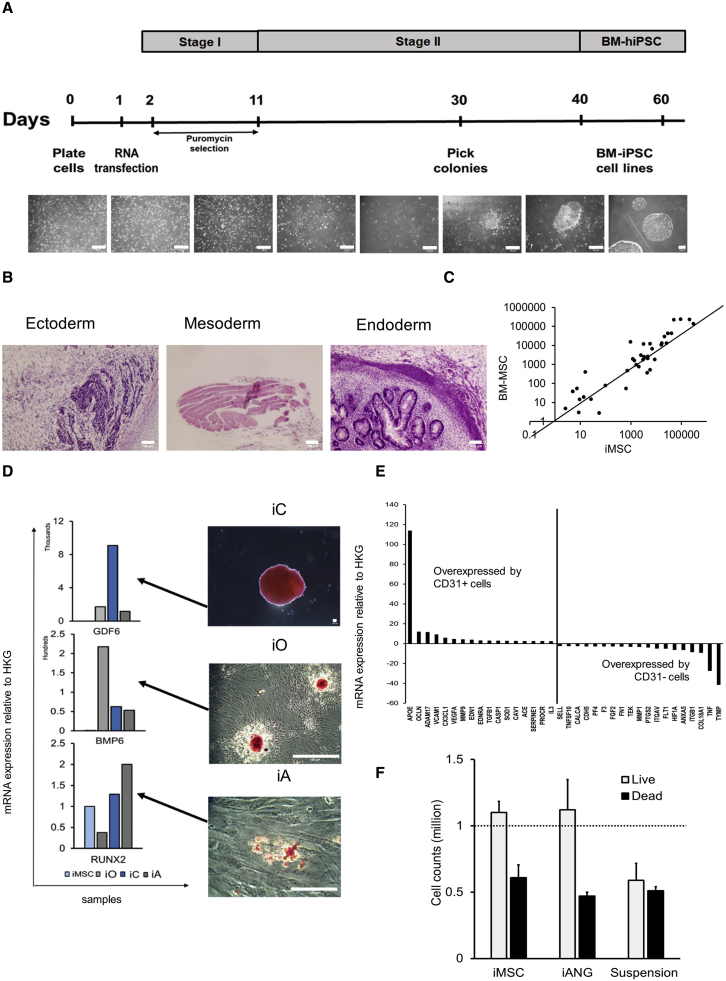
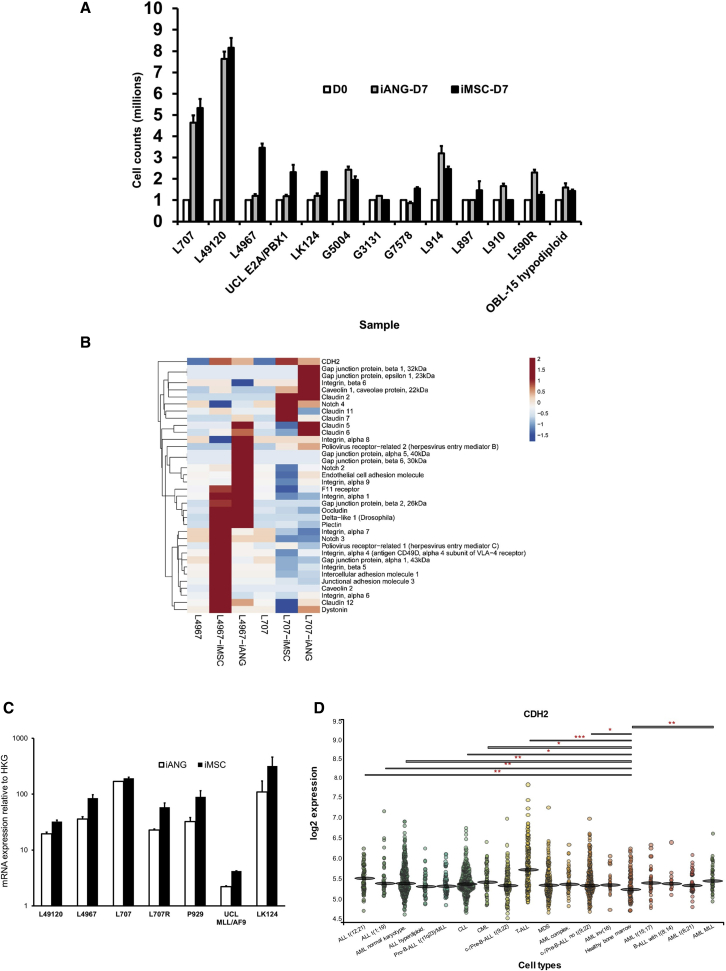
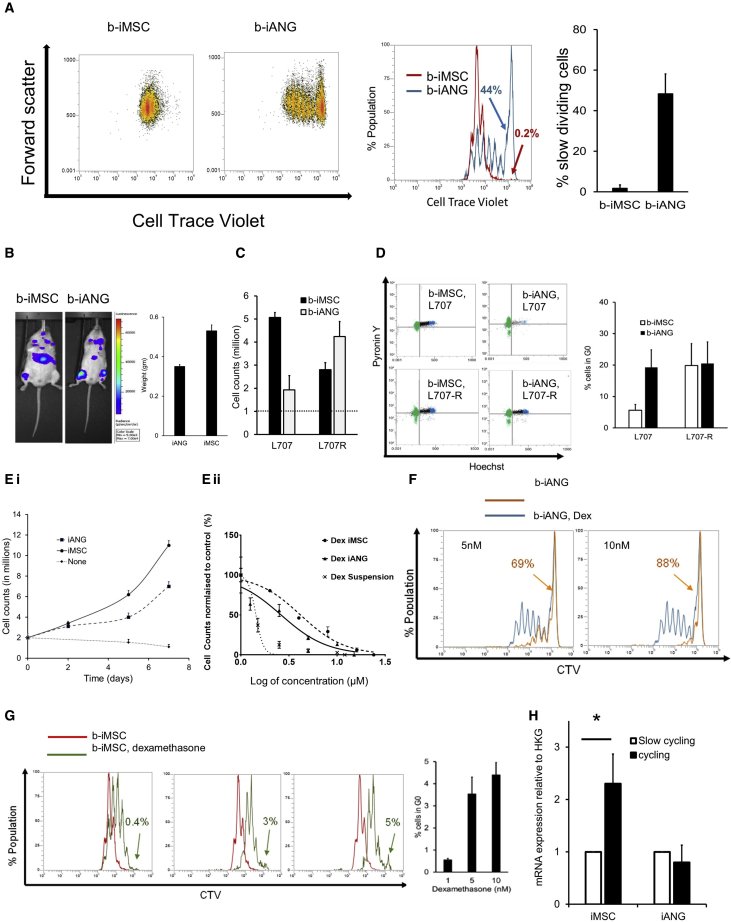
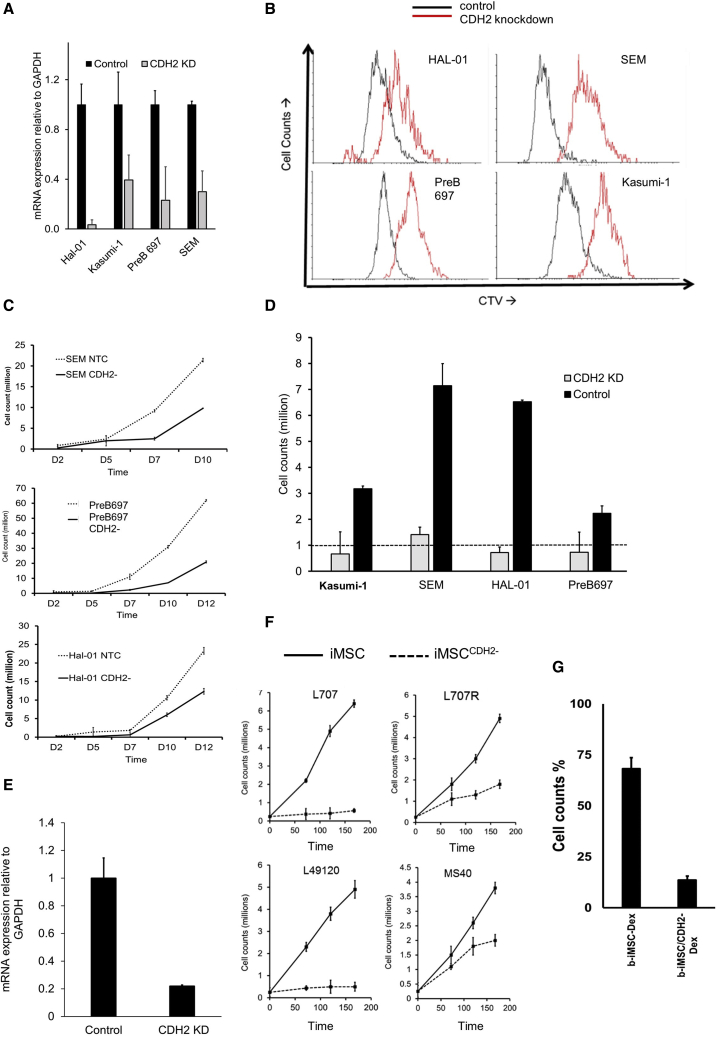
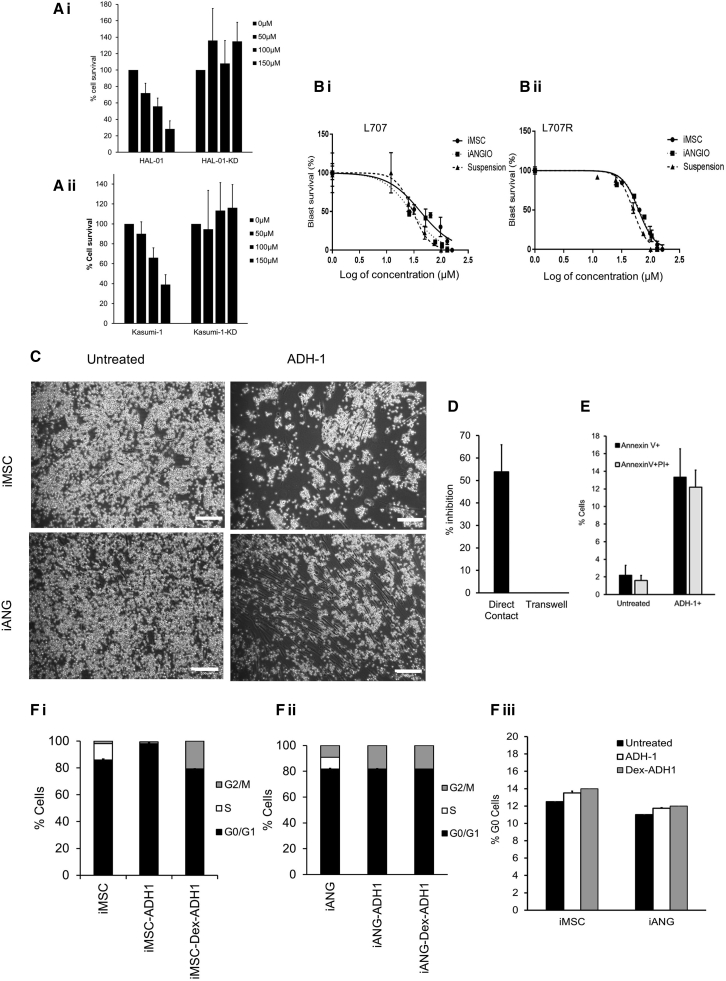
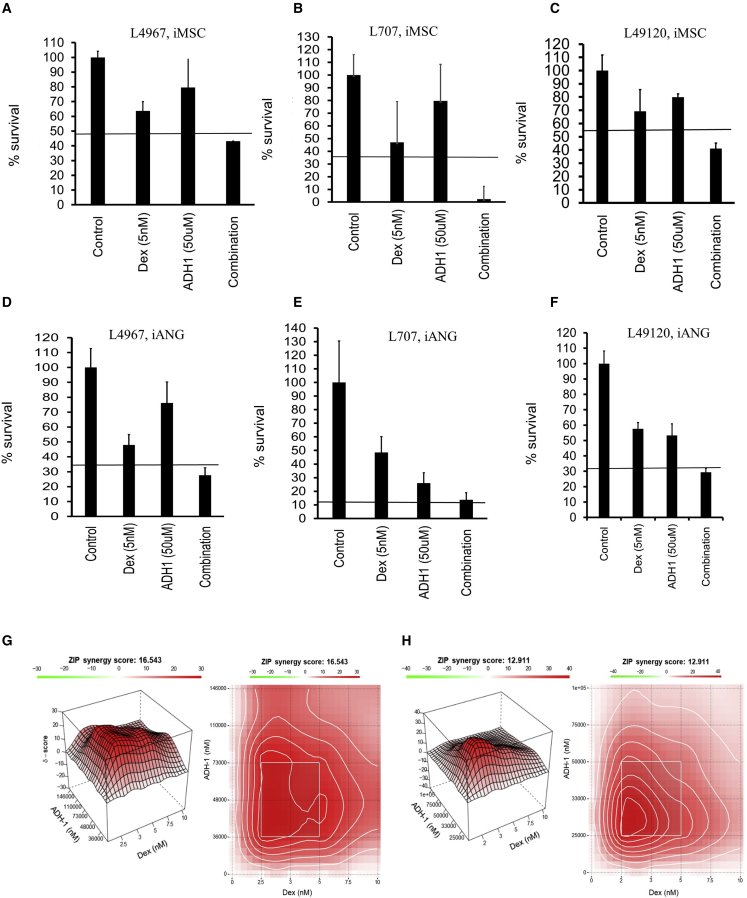
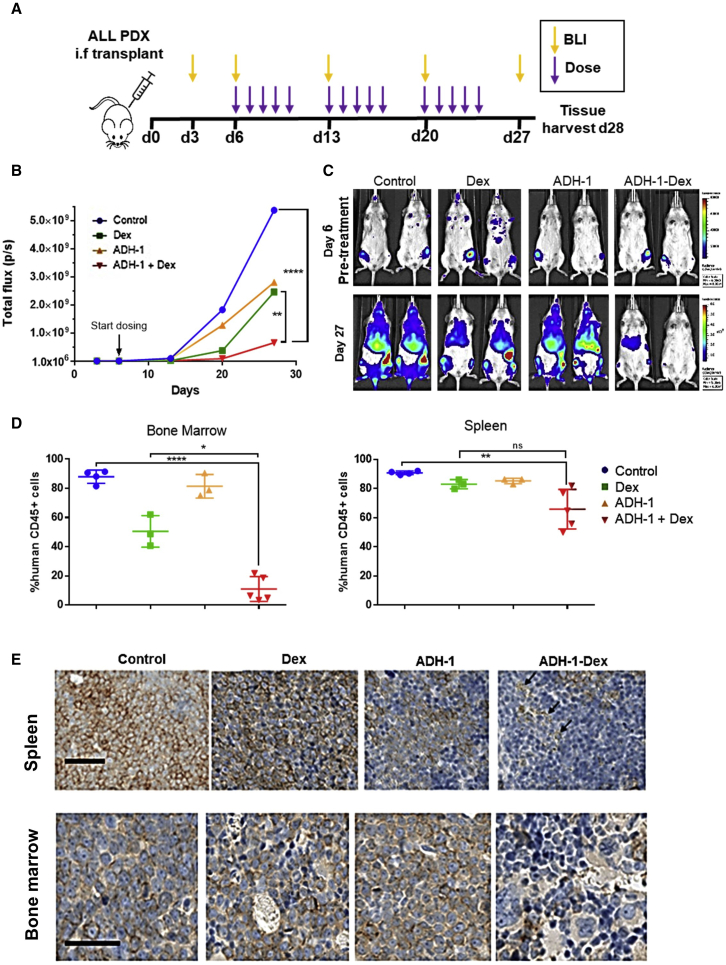
Leukemia cells re-program their microenvironment to augment blast proliferation and enhance treatment resistance. Means of clinically targeting such niche-driven treatment resistance remain ambiguous. We develop human induced pluripotent stem cell (hiPSC)-engineered niches to reveal druggable cancer-niche dependencies. We reveal that mesenchymal (iMSC) and vascular niche-like (iANG) hiPSC-derived cells support ex vivo proliferation of patient-derived leukemia cells, affect dormancy, and mediate treatment resistance. iMSCs protect dormant and cycling blasts against dexamethasone, while iANGs protect only dormant blasts. Leukemia proliferation and protection from dexamethasone-induced apoptosis is dependent on cancer-niche interactions mediated by CDH2. Consequently, we test CDH2 antagonist ADH-1 (previously in Phase I/II trials for solid tumors) in a very aggressive patient-derived xenograft leukemia mouse model. ADH-1 shows high in vivo efficacy; ADH-1/dexamethasone combination is superior to dexamethasone alone, with no ADH-1-conferred additional toxicity. These findings provide a proof-of-concept starting point to develop improved, potentially safer therapeutics targeting niche-mediated cancer dependencies in blood cancers.

Keywords: cancer microenvironment; dormancy; drugging cancer niche; iPSC-niche; treatment resistance.


Conflict of interest statement

Declaration of interests The authors declare no competing interests.

Figures

None
Graphical abstract
Figure 1
Figure 1
BM-iPSC-derived bone marrow (BM) milieu supports human hematopoietic cells ex vivo (A) Schema for synthetic RNA-based reprogramming using pluripotent transcripts POU5F1-SOX2-KLF4, GLIS1. Scale bar, 100 μM. Two BM-MSC samples (2 biological replicates) reprogrammed to form 13 BM-iPSC lines. (B) H&E staining of BM-iPSC-derived teratomas (5 NSG mice per i-niche sample) representing the 3 embryonic lineages. Scale bar, 100 μM. (C) Scatterplot showing comparable gene expression between primary BM mesenchymal stem cells (BM-MSC) and BM-iPSC derived MSC (iMSC). The genes profiled include MSC-specific genes IGF1, HGF, VIM, KITLG, PTPRC, PIGS, MMP2, ICAM1, COL1A1, VEGFA, TGFB3, SLC17A5, GTF3A, IL1B, NES, EGF, ITGB1, ANXA5, CSF2, CTNNB1, NUDT6, FUT1, BDNF, BGLAP, FGF22, LIF, ZFP42, SOX2, POU5F1, PROM1, CD44, MCAM, ITGA6, COL9A1, PDGFRB, NT5E, ITGAV, COL2A1, ERBB2, THY1, VCAM1, and ANPEP. (D) GDF6, BMP6, and RUNX2 expression in i-MSC-derived cartilage/chondrocytes, bone/osteoblasts, and fat/adipocytes cells (iC, iO, and iA). Immunohistochemical staining (2 technical replicates) demonstrating safranin O, alizarin red and oil red O staining in iC, iO, and iA, respectively. Scale bar, 100 μM. (E) mRNA expression relative to HKG (housekeeping genes: ACTB, B2M, GAPDH, HPRT1, and RPLP0) in iANG containing representative vascular cells such as CD31+ endothelial cells and CD31 perivascular cells in known proportions (Figure S2). (E) Gene expression has been normalized with respect to HKG (housekeeping genes: ACTB, B2M, GAPDH, HPRT1, and RPLP0) and the fold change expression between CD31+ endothelial cells/CD31 perivascular cells has been plotted. CD31+ cells express endothelial-relevant markers such as APOE, OCLN, ADAM17, and VCAM1, whereas CD31 cells express perivascular markers such as ANXA5, ITGB1, HIF1A, and COL18A1. (F) Cell counts of CD45+ hematopoietic cells (3 biological replicates) extracted from non-malignant human BM and co-cultured on iMSC, iANG versus in niche-free suspension cultures over 7 days.
Figure 2
Figure 2
Niche-primed leukemia cells upregulate CDH2 (A) Cell counts of leukemia blasts from 13 patient-derived samples (13 biological replicates) on iMSC and iANG at diagnosis and relapse over a 7-day period. (B) Heatmap demonstrating gene expression profiling of niche primed patient-leukemia samples (2 biological replicates: L707, L4967) shows consistent upregulation of CDH2 following a 7-day co-culture with iMSC and iANG. (C) CDH2 upregulation confirmed by qRT-PCR on 7 leukemia samples (7 biological replicates, each biological replicate has 3 technical replicates) following a 7-day co-culture with iMSC and iANG. (D) Gene expression profiles from BloodSpot database, MILE study showing CDH2 expression levels between healthy and leukemic BM.
Figure 3
Figure 3
Under dexamethasone treatment pressure, CDH2 is upregulated by iMSC-primed cycling cells (A) Dot plots show fast cycling and slow cycling iMSC primed blasts (b-iMSC, red) and iANG primed blasts (b-iANG, blue) at day 7 from a patient-leukemia (L707) sample at diagnosis. Histogram overlay and graph shows the percentage of slow cycling blasts on iMSC and iANG. Data shown from 2 technical replicates. (B) Total fluorescence intensity of luciferase-tagged niche-primed patient leukemic blasts transplanted in immunocompromised mice. The column graph depicts spleen weights (harvest at 4.5 weeks following injection) in mice transplanted with patient blasts (L707) at diagnosis (control) and following a 7-day co-culture on iMSC (b-iMSC) and iANG (b-iANG). Intrafemoral transplants, n = 3 mice, 1 representative example shown. (C) Cell counts of a diagnostic and matched relapse sample following co-culture on iMSC and iANG. Three technical replicates. (D) Hoechst-pyronin Y analysis (dot plot) of patient leukemic blasts on iMSC (left panel) and iANG (right panel) in patient leukemic blasts at diagnosis (top panel) and relapse (bottom panel). Graph shows percentage cells in G0 on iMSC (b-iMSC) and on iANG (b-iANG) at diagnosis (L707) and relapse (L707-R). Two technical replicates. (E) (i) Growth curve showing proliferation of patient leukemia cells (L707, 3 technical replicates) over a 7-day period on iMSC and iANG. (ii) Dexamethasone dose response (nM) curve of patient leukemia cells (L707, 3 technical replicates) treated for 7 days in niche-free suspension culture and on iMSC and iANG. (F) Histogram shows cell generational curve of untreated (blue) and treated leukemia cells (orange) co-cultured on iANG over a 7-day period. Two technical replicates, 1 representative example shown. (G) Cell generation curves of patient leukemic cells untreated (red) and treated (green) when co-cultured on iMSC over a 7-day period. Column graph shows percentage of slow cycling blasts on iMSC under dexamethasone treatment. Two technical replicates. (H) CDH2 expression under dexamethasone pressure in slow cycling and cycling/fast cycling blasts relative to HKG (GAPDH). Blasts were sorted using flow cytometry following 7-day treatment with 5 nM dexamethasone. Three technical replicates for 1 patient sample, L707 shown here. ∗Unpaired t test shows p < 0.05. Data for 3 additional patient samples/biological replicates, with each containing 3 technical replicates, are included in Figure S4E.
Figure 4
Figure 4
CDH2 drives leukemia proliferation and reduces sensitivity against dexamethasone (A) CDH2 levels in leukemia cell lines following lentiviral knockdown. Control = nonsense shRNA/non-targeting control. Four biological replicates, with each containing 3 technical replicates. (B) Cell generational tracing curves using the dye cell trace violet (CTV) in 4 different leukemia cell lines following CDH2 knockdown. Black = empty vector control. Red = CDH2 knockdown. Four biological replicates, with each containing 3 technical replicates. One representative example is shown here. (C) Leukemia cell proliferation in 3 different acute lymphoblastic leukemia cell lines following CDH2 knockdown (against empty vector control). Three biological replicates, with each containing 2 technical replicates. (D) Cell counts of CDH2 knockdown and empty vector control cell lines on iANG over 5 days. Dashed line indicates a starting cell count of 1 million cells. Feeder dependence was achieved by conducting co-cultures in the absence of fetal bovine serum (FBS) and at a reduced leukemia cell density of 10,000 cells/mL. Under these altered culture conditions, the leukemia cells failed to survive on iMSC. Four biological replicates, with each containing 2 technical replicates. (E) CDH2 mRNA levels in control iMSC and CDH2 knockdown iMSC (iMSCCDH2−). Two technical replicates. (F) Cell counts of 3 different patient leukemia samples. Three biological replicates and 1 matched relapse sample on iMSC (solid line) and iMSCCDH2− (dotted line). (G) Percentage of cell counts (with respect to untreated control) of patient leukemia cells (L707) on iMSCCDH2− with and without 5 nM dexamethasone. One biological replicate, 3 technical replicates.
Figure 5
Figure 5
CDH2 antagonist ADH-1, a repurposed compound, is identified to show high efficacy on a wide range of patient-derived leukemia cells (A) ADH-1 treatment on CDH2 knockdown and control (i) ALL and (ii) AML leukemia cells. Two biological replicates, with each containing 3 technical replicates. (B) ADH-1 dose-response curves in patient leukemia samples from a patient at (i) diagnosis and (ii) relapse. Doses used are in the range 12–450 μM, which is consistent with Cmax levels achieved in solid tumor clinical trials. The x axis of the graphs shows log of concentration of ADH-1 used. One biological replicate shown here. A total of 14 additional biological replicates shown in Figure S6. Each biological replicate contains 2 technical replicates. (C) Adherent patient blasts (L707) on iMSC and iANG following treatment with 50 μM ADH-1. Scale bar, 100 μM. Three technical replicates. (D) Percentage of inhibition (cell counts) of blasts (L707) following 50 μM ADH-1 treatment on direct contact cultures (iMSC) and in transwell cultures. Three technical replicates. (E) Annexin V PI flow cytometry analysis in patient blasts (L707) following treatment with 50 μM ADH-1. Two technical replicates. (F) (i–iii) RNA and DNA content analysis using flow cytometry in primary blasts (L707) following treatment with 50 μM ADH-1 in (i) iMSC and (ii) iANG co-cultures. (iii) Percentage of G0 cells in co-cultures following treatment with ADH-1. Two technical replicates.
Figure 6
Figure 6
ADH-1 demonstrates in vitro synergy in combination with dexamethasone (A–C) Percentage of survival following treatment with dexamethasone, ADH-1, and combination in 3 different patient samples over 7 days. (A) L4967, (B) L707, and (C) L49120 on iMSC, and (D–F) on iANG. Horizontal line depicts the expected combined effect as per the Bliss independence model. Three technical replicates. (G) Synergy landscapes (3-dimensional [3D] and 2D synergy maps) and ZIP synergy scores of Dex/ADH-1 on patient-derived blasts (L707) on iMSC. (H) iANG co-cultures over a 7-day period. Two technical replicates.
Figure 7
Figure 7
ADH-1 potentiates dexamethasone sensitivity in vivo (A) The PDX in vivo efficacy study design. Mice were dosed interperitoneally with either saline vehicle (control), 3 mg/kg dexamethasone (Dex), 200 mg/kg ADH-1, or ADH-1-Dex combined, 1× daily, 5× weekly for 3 weeks (15 doses), 5 mice per treatment group. (B) Mean whole-body total flux measurements from bioluminescent imaging of each treatment group. (C) Representative luminescence images of mice before and after treatment. Mice at each time point are shown with identical luminescence scale for comparison. Leukemic blasts are present in the femurs of all of the mice at the start of treatment. Signal spreads to BM sites, liver, and spleen in control mice, whereas signal is barely visible in ADH-1-Dex controls. (D) Leukemic engraftment in harvested BM and spleen measured by flow cytometry of labeled harvested cells. Human CD45+ cells are shown as a percentage of total CD45+ cells (mouse + human cells). Lines indicate means and SEs, symbols for individual mice. ANOVA (GraphPad Prism), ns not significant, ∗p < 0.05, ∗∗p < 0.005, ∗∗∗∗p < 0.00005. (E) Human CD19 immunohistochemistry on sections of spleen and bone harvested from mice. Mice treated with ADH-1-Dex combination have few CD19-stained cells (brown staining at the cell membranes) and have areas of punctate staining indicative of cell debris (arrows). Scale bar, 50 μm.

Similar articles

Cited by

References

    1. Agarwal P., Isringhausen S., Li H., Paterson A.J., He J., Gomariz Á., Nagasawa T., Nombela-Arrieta C., Bhatia R. Mesenchymal niche-specific expression of Cxcl12 controls quiescence of treatment-resistant leukemia stem cells. Cell Stem Cell. 2019;24:769–784.e6. doi: 10.1016/j.stem.2019.02.018. - DOI - PMC - PubMed
    1. Duan C.W., Shi J., Chen J., Wang B., Yu Y.H., Qin X., Zhou X.C., Cai Y.J., Li Z.Q., Zhang F., et al. Leukemia propagating cells rebuild an evolving niche in response to therapy. Cancer Cell. 2014;25:778–793. doi: 10.1016/j.ccr.2014.04.015. - DOI - PubMed
    1. Guarnerio J., Mendez L.M., Asada N., Menon A.V., Fung J., Berry K., Frenette P.S., Ito K., Pandolfi P.P. A non-cell-autonomous role for Pml in the maintenance of leukemia from the niche. Nat. Commun. 2018;9:66. doi: 10.1038/s41467-017-02427-x. - DOI - PMC - PubMed
    1. Zhang B., Nguyen L.X.T., Li L., Zhao D., Kumar B., Wu H., Lin A., Pellicano F., Hopcroft L., Su Y.L., et al. Bone marrow niche trafficking of miR-126 controls the self-renewal of leukemia stem cells in chronic myelogenous leukemia. Nat. Med. 2018;24:450–462. doi: 10.1038/nm.4499. - DOI - PMC - PubMed
    1. Batlle E., Clevers H. Cancer stem cells revisited. Nat. Med. 2017;23:1124–1134. doi: 10.1038/nm.4409. - DOI - PubMed

Publication types