. 2022 Aug 16;40(7):111159.
doi: 10.1016/j.celrep.2022.111159.

NF-κB memory coordinates transcriptional responses to dynamic inflammatory stimuli

Affiliations

NF-κB memory coordinates transcriptional responses to dynamic inflammatory stimuli

Andrew G Wang et al. Cell Rep. .

Abstract

Many scenarios in cellular communication require cells to interpret multiple dynamic signals. It is unclear how exposure to inflammatory stimuli alters transcriptional responses to subsequent stimulus. Using high-throughput microfluidic live-cell analysis, we systematically profile the NF-κB response to different signal sequences in single cells. We find that NF-κB dynamics store the short-term history of received signals: depending on the prior pathogenic or cytokine signal, the NF-κB response to subsequent stimuli varies from no response to full activation. Using information theory, we reveal that these stimulus-dependent changes in the NF-κB response encode and reflect information about the identity and dose of the prior stimulus. Small-molecule inhibition, computational modeling, and gene expression profiling show that this encoding is driven by stimulus-dependent engagement of negative feedback modules. These results provide a model for how signal transduction networks process sequences of inflammatory stimuli to coordinate cellular responses in complex dynamic environments.

Keywords: CP: Immunology; NF-κB; cellular memory; inflammation; information theory; innate immune signaling; live-cell imaging; mathematical modeling; microfluidics; pathogen-associated molecular patterns; signaling dynamics.


Conflict of interest statement

Declaration of interests The authors declare no competing interests.

Figures

Figure 1:
Figure 1:. Microfluidic live cell imaging tracks single cell NF-κB responses through multiple sequential stimuli.
A) Schematic representation of experimental conditions and microfluidic imaging set up. RelA-DsRed tagged 3T3s were stimulated with non-repeating combinations of 4 ligands with in an automated microfluidic cell culture device. B) Schematic representation of TNF-α (TNFR), IL-1β (IL-1R), LPS (TLR4), and PAM (TLR2) signaling converging on activation of RelA. C) Representative grayscale images of RelA nuclear translocation during stimulation with mid dose TNF-α (0 min), IL-1β (120 min), LPS (240 min), and PAM (360 min). RelA nuclear translocation in single cells (white arrows) is shown. Scale bar 50 microns. D) Quantification of nuclear/cytoplasmic NF-κB over imaging interval. Gray dashed lines indicate when new stimulus was provided. See also Supplemental Videos 1–2.
Figure 2:
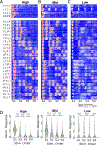
Figure 2:. Single-cell NF-κB activation traces reveal ligand and dose specific attenuation of signaling by prior stimuli.
A-C) NF-κB response dynamics over 2 hours of stimulus for each ligand. 50 randomly selected single-cell traces from two independent replicates are displayed for each condition. Each row shows the nuclear NF-κB level of a single-cell measured by time-lapse microscopy, and x-axis shows the time. Heatmap columns are arranged from the first stimulus (S1) to the fourth stimulus (S4). Stimulus orders are shown to the left of the first heatmap, where T stands for TNF-α, I for IL-1β, L for LPS, and P for PAM. Heatmap for response to four consecutive feedings with the same ligand are shown above the combinatorial orders. Heatmap colors are normalized based on the high dose S1 response to each ligand. D) Single cell responses from S1-S4, normalized to the mean of corresponding S1 response (>2000 cells for each condition). Open circle and line show the mean. Bonferroni corrected Wilcoxon rank sum test p-value < 10−4 (***). Fold change difference between sample means > 1 (#), > 1.25 (##), or >4 (###). See also Supplemental Figures 1–4.
Figure 3:
Figure 3:. Information about prior stimulus history is reflected in the dynamics of subsequent NF-κB responses.
A) Schematic representation of information theory analysis. Nuclear NF-κB levels at six different time points (20, 30, 40, 50, 70, and 90 min) from multiple conditions are used as inputs to calculate the mutual information between conditions. Channel capacity (CC) represents the maximum mutual information between conditions. B) Distinguishability among all samples at S1–4. CC is calculated from the 6-dimension vector (blue line) and compared to the CC from a single feature (red line) C) CC among samples exposed to the indicated ligand at S1–4 calculated using the 6-dimension vector. CC in S2–4 indicates how accurately the NF-κB network reflects the prior history in the response to the indicated ligand. D) As in C), CC among all samples with the same ligand at each sequence interval but calculated using a single feature. E) Mutual information (MI) between ligand response dynamics (S1 and S2 only). T, I, L, P indicates the order of the stimulus. MI of 1 indicates complete distinguishability between two conditions.
Figure 4:
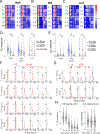
Figure 4:. Ligand and dose specific effects of prior history differentiate TNF-α from MyD88 dependent ligands and differentiate among MyD88 dependent ligands.
A-C) NF-κB response dynamics over 2 hours of stimulus for each ligand normalized to the mean amplitude of the naïve (S1) high dose response. 50 single-cell traces randomly selected for each condition. All sequences of S1 and S2 ligands shown. All 9 sequences shown at high (A), mid (B), and low (C) dose. D) Violin plot comparing the normalized S2 responses of the MyD88-dependent ligands (LPS, PAM, IL-1β) following either TNF-α (blue) or another MyD88-dependent ligand (red) or the TNF-α response following a MyD88 dependent ligand (green) (> 650 cells per condition). Open circle and line show the mean. E) Violin plot comparing the normalized S2 MyD88-dependent responses following IL-1β (blue), PAM (green), and LPS (red) stimulus at high, mid, and low doses (> 340 cells per condition). Bonferroni corrected Wilcoxon rank sum test p-value > 10−2 (n.s.), < 10−2 (*), < 10−3 (**), < 1*10−4 (***). Fold change difference between sample means > 1 (#), > 1.25 (##), or >4 (###). F) Plot of mean trace for conditions where LPS is provided at 0 min (gray arrowhead) and switched to 3 ng/mL (high dose) IL-1β after the indicated time (red arrowhead). Gray region and red regions of trace indicate NF-κB response during LPS stimulus interval and after replacement with IL-1β, respectively. Entirely red traces in the left column show an only IL-1β response and entirely gray traces in the right column show an only LPS response. Each mean trace represents > 100 single cells from 2 biological replicates. G) Plot of mean traces for conditions where 0.2 and 3 ng/mL (mid and high dose) IL-1β are provided at 0 min and switched to 100 and 400 ng/mL (mid and high dose) LPS, respectively, after the indicated time. Gray region and red regions of trace indicate NF-κB response during IL-1β stimulus interval and after replacement with LPS, respectively. As in F), entirely red traces in the left column show an only LPS response and entirely gray traces in the right column show an only IL-1β response. Each mean trace represents > 100 single cells over 2 biological replicates. H) Violin plot comparing the normalized response for 3 ng/mL IL-1β following 100 ng/mL LPS or the response for 100 ng/mL LPS following 0.2 ng/mL IL-1β. Each plot is derived from > 100 cells per condition over 2 biological replicates. Open circle and line show the mean. See also Supplemental Figure 5, 6A–B.
Figure 5:
Figure 5:. Differential regulation of downstream feedback controls ligand specificity of tolerance.
A) Violin plot comparing IL-1β maximum response following LPS treatment normalized to naïve for untreated (blue) and PS1145 pre-treated (red) cells. Pre-treated cells were exposed to 40 μM PS1145 stimulated with LPS at the indicated concentration, washed and stimulated with 3 ng/mL IL-1β. Each condition shown from > 120 single cells over 2 biological replicates. B) Diagram illustrating the NF-κB network model used for the simulation. Two negative components, IRAK1 autoinhibition and nuclear NF-κB dependent attenuation, are highlighted in red and orange. The TNF-α signaling pathway (green) utilizes different kinases to activate IKK than the MyD88 dependent ligands. C─E) Simulated network responses to different sequences of stimuli. The blue lines show the dynamics of nuclear NF-κB, the red lines for active IRAK1, and the orange lines for the downstream feedback component. Gray dashed vertical line indicates time of simulated replacement of ligands. See also Supplemental Figure 6C–D.
Figure 6:
Figure 6:. Myd88-depenent genes differentially regulate downstream cytokines and negative feedback regulators.
A) Venn diagram showing overlap of differentially expressed genes (DEGs) between IL-1β, LPS, and PAM after 2 hours of stimulus. B) Heatmap of DEGs for MyD88-dependent ligand treated cells. RNA-sequencing was performed in triplicate. Each row shows the normalized expression (z-score) of a single gene. Dendrogram shows linkage based on Ward’s method. C-D) Volcano plot showing log2(fold change) and -log10(P value) for DEGs between LPS and IL-1β stimulus Among the DEGs with adjusted p-value < 0.01 and fold change > 4, genes annotated as NF-κB negative regulators (GO:0032088) (C) or cytokines (GO:0005125) (D) are colored in red. All differentially expressed regulators and top ten differentially expressed cytokines are labeled. E) qRT-PCR data following for a subset of highly differentially expressed cytokines and NF-κB negative regulators stimulation with 0.2 ng/mL (light blue), 1 ng/mL (dark blue) IL-1β, or 100 ng/mL LPS (red). Gene expression is normalized to basal gene expression for unstimulated cells. Data shown as mean fold change over unstimulated cells +/− S.E.M. from 3 replicates. Benjamini-Hochberg adjusted P value < 0.05 (*) or <0.01 (**). See also Supplemental Figure 7, Supplemental Table 1.
Figure 7:
Figure 7:. Exposure to inflammatory ligands triggers shared feedbacks to alter subsequent ligand responses.
Naïve cell (gray) activates in response to different inflammatory ligands, which each induce characteristic feedback responses. LPS (red cell) induces upstream and downstream negative feedback, IL-1β (yellow cell) primarily induces upstream negative feedback, and TNF-α induces negative feedback which primarily acts orthogonally to the other ligands. As a result, response to a subsequent IL-1β stimulus becomes attenuated in a ligand specific manner and produces memory-informed NF-κB responses.

Similar articles

Cited by

References

    1. Adamson A, Boddington C, Downton P, Rowe W, Bagnall J, Lam C, Maya-Mendoza A, Schmidt L, Harper CV, Spiller DG, et al. (2016). Signal transduction controls heterogeneous NF-κB dynamics and target gene expression through cytokine-specific refractory states. Nat Commun 7, 12057. 10.1038/ncomms12057. - DOI - PMC - PubMed
    1. Adelaja A, Taylor B, Sheu KM, Liu Y, Luecke S, and Hoffmann A (2021). Six distinct NFκB signaling codons convey discrete information to distinguish stimuli and enable appropriate macrophage responses. Immunity 54, 916–930.e7. 10.1016/j.immuni.2021.04.011. - DOI - PMC - PubMed
    1. Ashall L, Horton CA, Nelson DE, Paszek P, Harper CV, Sillitoe K, Ryan S, Spiller DG, Unitt JF, Broomhead DS, et al. (2009). Pulsatile stimulation determines timing and specificity of NF-kappa B-dependent transcription. Science 324, 242–246. 10.1126/science.1164860. - DOI - PMC - PubMed
    1. Behar M, and Hoffmann A (2013). Tunable Signal Processing through a Kinase Control Cycle: the IKK Signaling Node. Biophys J 105, 231–241. 10.1016/j.bpj.2013.05.013. - DOI - PMC - PubMed
    1. Bunting K, Rao S, Hardy K, Woltring D, Denyer GS, Wang J, Gerondakis S, and Shannon MF (2007). Genome-wide analysis of gene expression in T cells to identify targets of the NF-kappa B transcription factor c-Rel. J Immunol 178, 7097–7109. 10.4049/jimmunol.178.11.7097. - DOI - PubMed

Publication types