. 2022 Aug 16;40(7):111201.
doi: 10.1016/j.celrep.2022.111201.

Stromal remodeling regulates dendritic cell abundance and activity in the tumor microenvironment

Affiliations

Stromal remodeling regulates dendritic cell abundance and activity in the tumor microenvironment

Athanasios Papadas et al. Cell Rep. .

Abstract

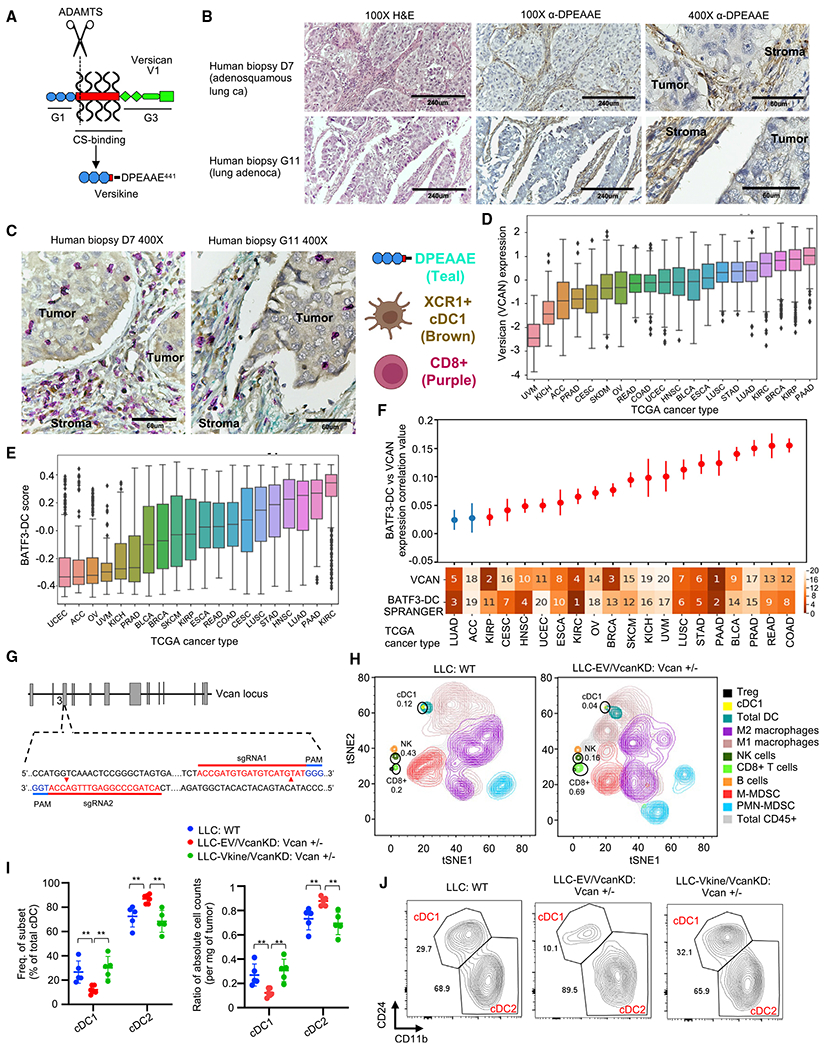
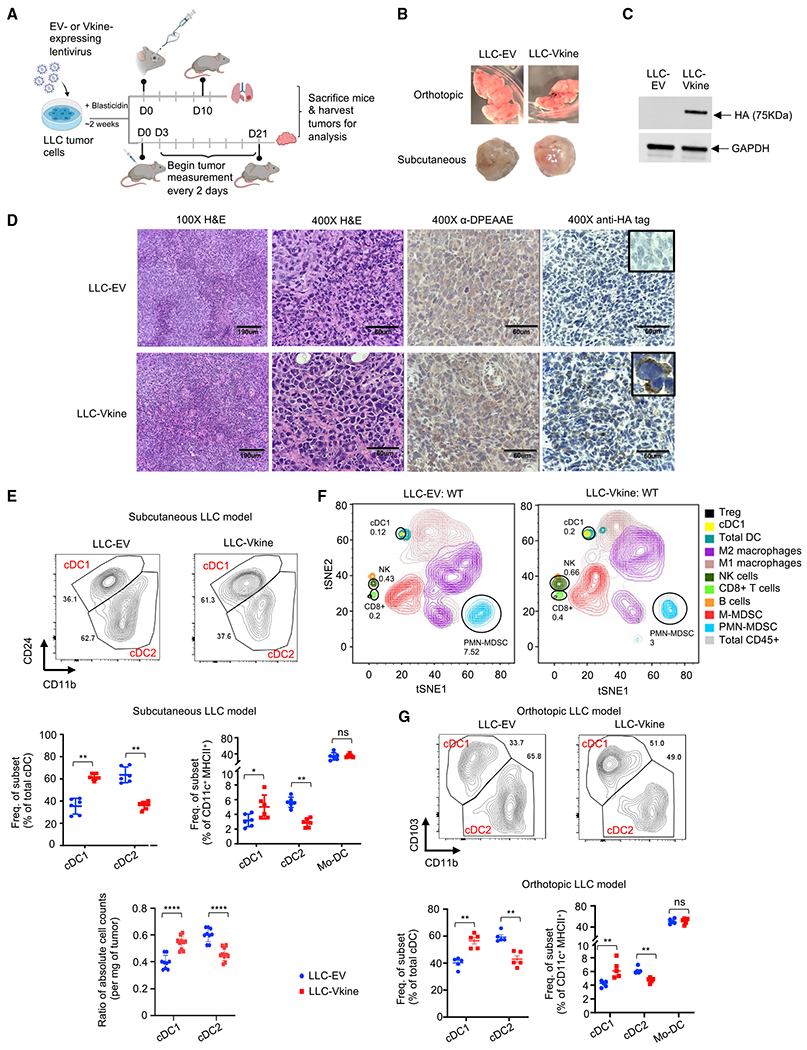
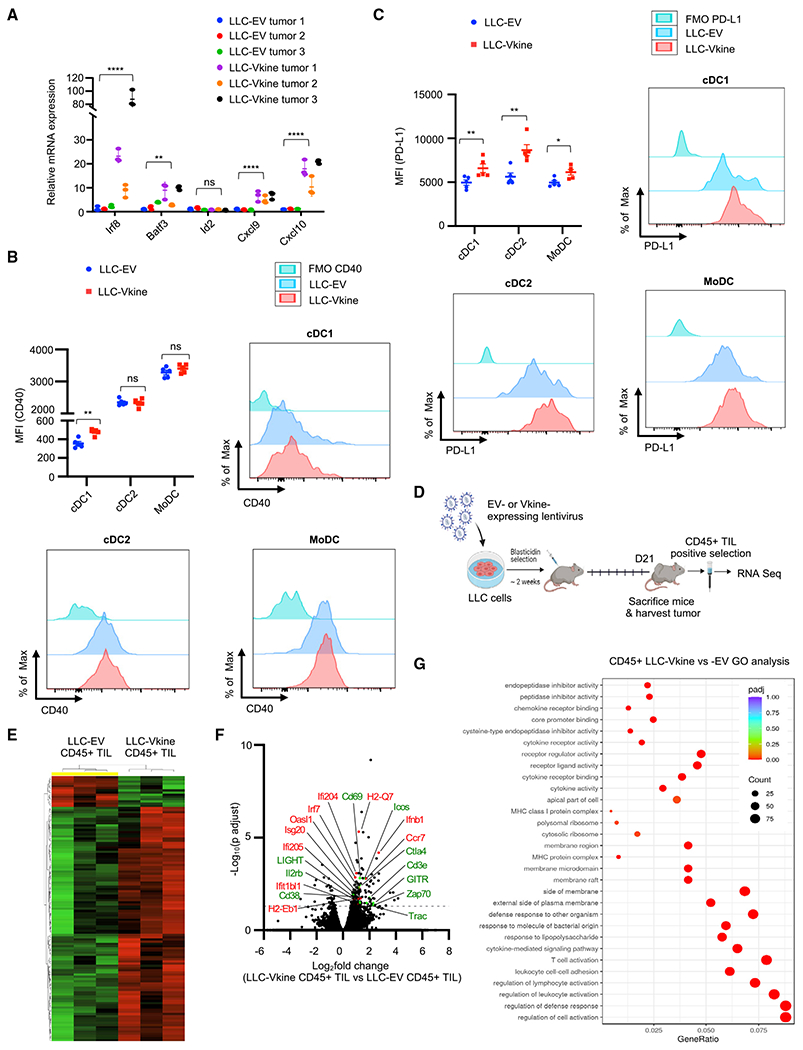
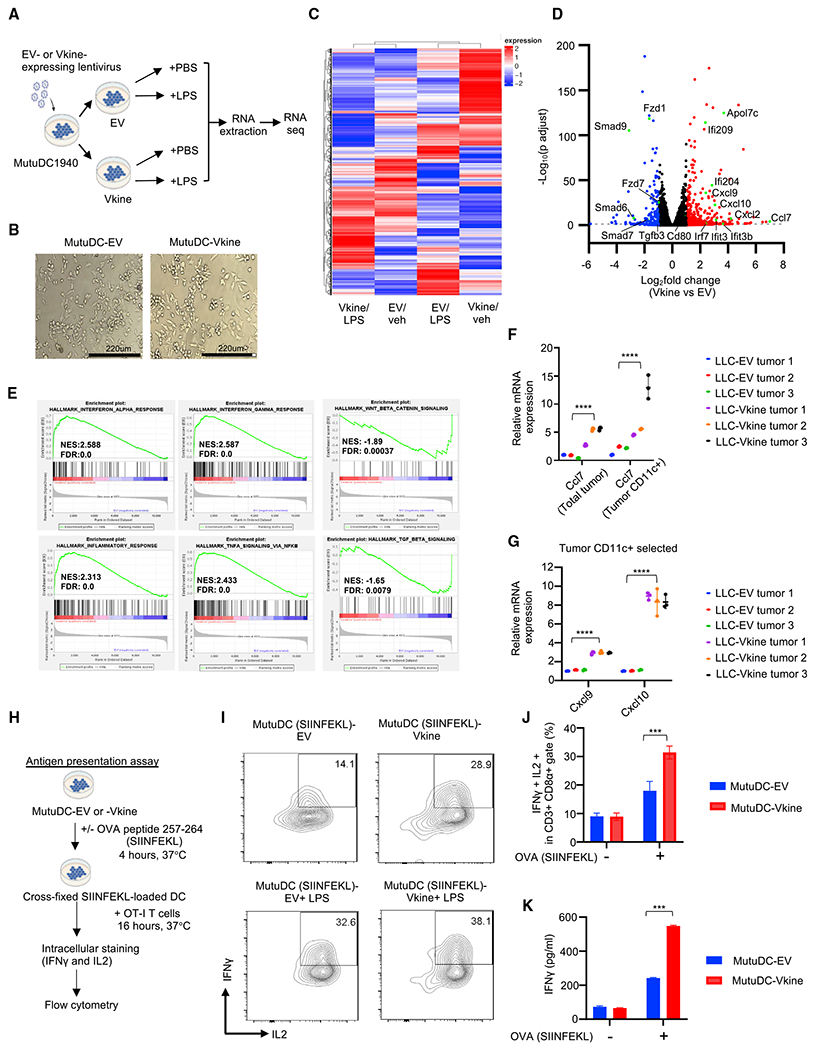
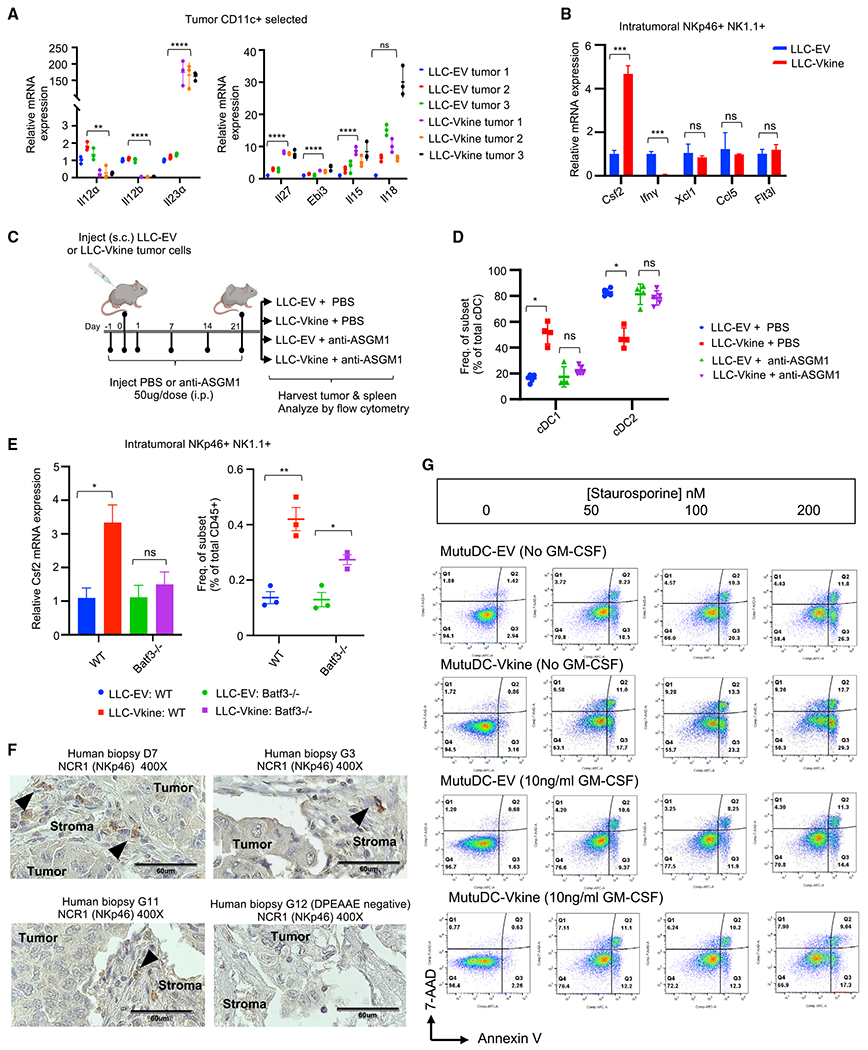
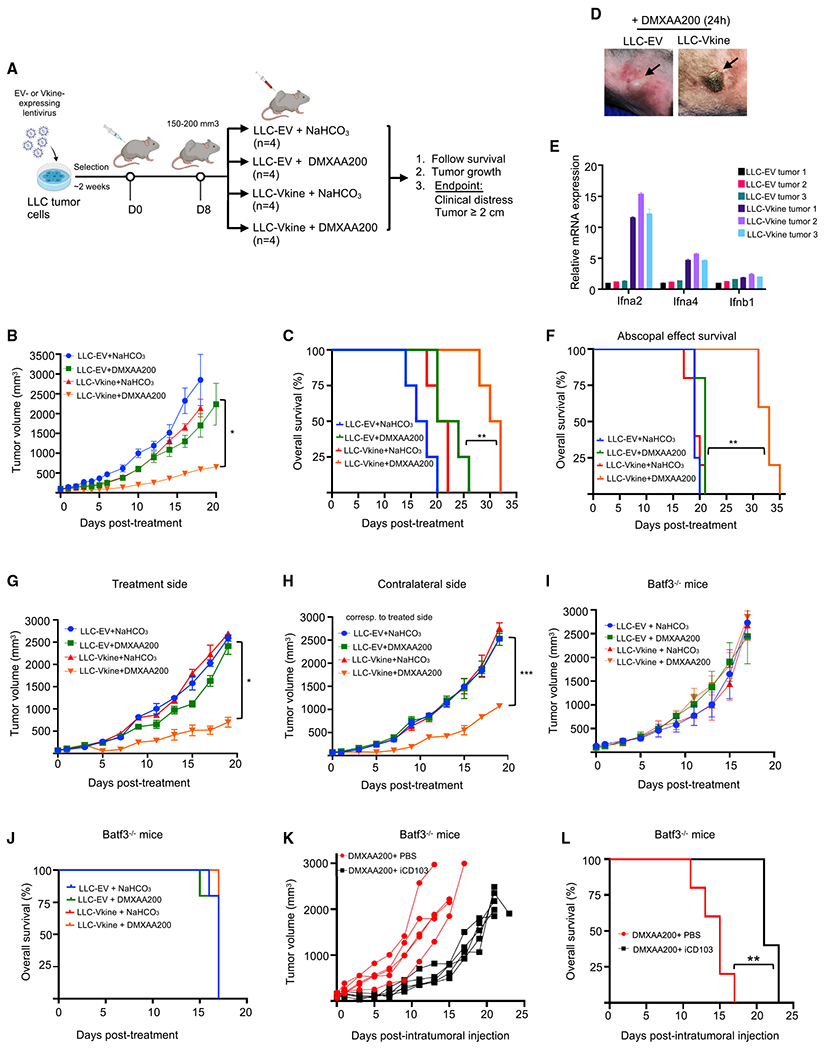
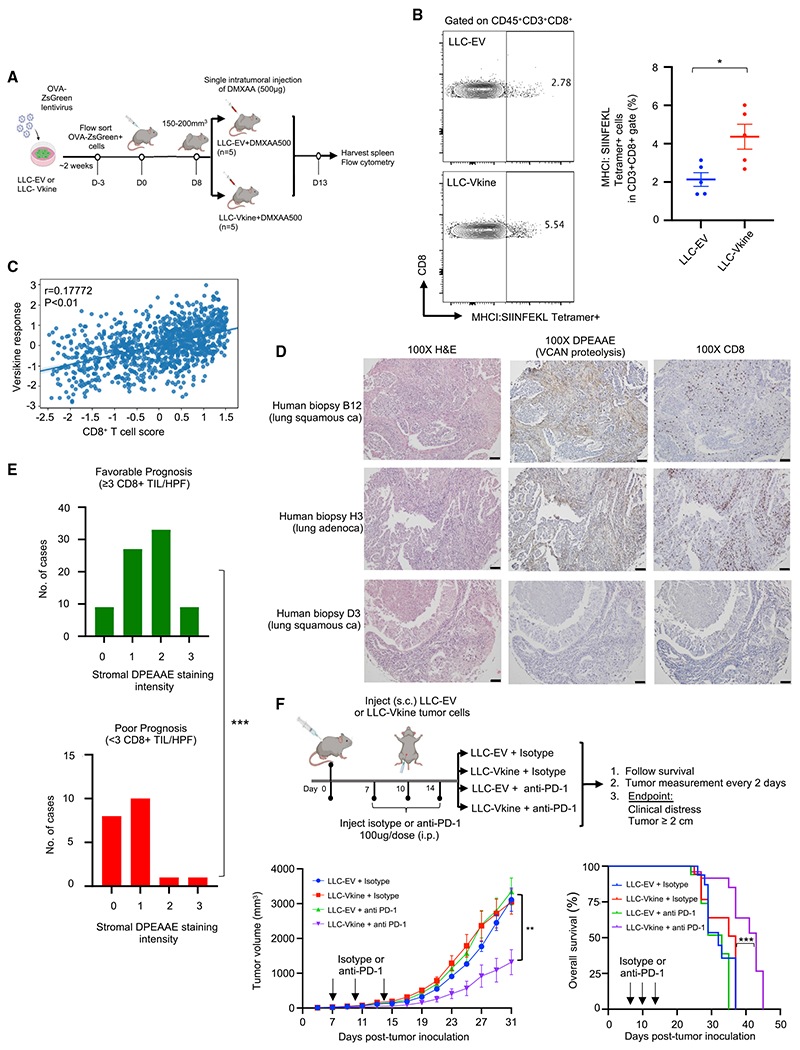
Stimulatory type 1 conventional dendritic cells (cDC1s) engage in productive interactions with CD8+ effectors along tumor-stroma boundaries. The paradoxical accumulation of "poised" cDC1s within stromal sheets is unlikely to simply reflect passive exclusion from tumor cores. Drawing parallels with embryonic morphogenesis, we hypothesized that invasive margin stromal remodeling generates developmentally conserved cell fate cues that regulate cDC1 behavior. We find that, in human T cell-inflamed tumors, CD8+ T cells penetrate tumor nests, whereas cDC1s are confined within adjacent stroma that recurrently displays site-specific proteolysis of the matrix proteoglycan versican (VCAN), an essential organ-sculpting modification in development. VCAN is necessary, and its proteolytic fragment (matrikine) versikine is sufficient for cDC1 accumulation. Versikine does not influence tumor-seeding pre-DC differentiation; rather, it orchestrates a distinctive cDC1 activation program conferring exquisite sensitivity to DNA sensing, supported by atypical innate lymphoid cells. Thus, peritumoral stroma mimicking embryonic provisional matrix remodeling regulates cDC1 abundance and activity to elicit T cell-inflamed tumor microenvironments.

Keywords: CD40; CP: Cancer; CP: Immunology; cDC1; checkpoint inhibitors; dendritic cells; immunotherapy; proteoglycans; tumor matrix; tumor stroma; versican; versikine.


Conflict of interest statement

Declaration of interests F.A. and C.H. are listed as inventors on US patent US20170258898A1: “Versikine for inducing or potentiating an immune response.”

Figures

Figure 1.
Figure 1.. The VCAN pathway regulates tumor cDC1s
For a Figure360 author presentation of this figure, see https://doi.org/10.1016/j.celrep.2022.111201. (A) Schematic showing versican (VCAN)-V1 functional domains and site-specific proteolysis to generate versikine (scissors represent ADAMTS proteolytic cleavage). CS, chondroitin sulphate. (B) Stromal distribution of anti-DPEAAE IHC staining in human lung cancers. DPEAAE constitutes the C terminus of versikine (chromogen, DAB; counterstain, hematoxylin). 10× objective: scale bars, 240 μm; 40× objective: scale bars, 60 μm. (C) Triple IHC staining of human lung cancers (DPEAAE, teal; XCR1, brown; CD8, purple). (D) Distribution of VCAN expression across TCGA carcinomas (gdc.cancer.gov), ordered on the horizontal axis by median VCAN expression. (E) Distribution of cDC1 (BATF3-DC) score across TCGA carcinomas, ordered on the horizontal axis by median measured cDC1 score. (F) Levels of correlation between cDC1 (BATF3-DC) score and VCAN expression across TCGA carcinomas. The ranked median of VCAN expression and measured cDC1 (BATF3-DC) score is shown across the x axis (1, highest; 20, lowest). Significant (q < 0.1) correlations after multiple hypothesis correction are colored red. Error bars represent the standard error of the correlation coefficient measured using Python statsmodels. (G) Generation of Vcan+/− mice through CRISPR-Cas9-based targeting of Vcan exon 3. (H) Mass cytometry of CD45+ cells from WT (LLC implanted into WT recipients, left) and Vcan-depleted tumors (LLCVcanKD tumor cells implanted into Vcan+/− recipients, right). (I) Quantification of frequency (left) and absolute count ratios (cDC1/cDC1+cDC2 and cDC2/cDC1+cDC2) in WT, Vcan-depleted (LLC-EVVcanKD: Vcan+/−), and versikine (Vkine)-rescued (LLC-VkineVcanKD: Vcan+/−) tumors. Data are presented as mean ± SEM. n = 5 for each group. *p < 0.05, **p < 0.01, ***p < 0.001. (J) Representative flow cytometry plots showing cDC1 and cDC2 frequency in WT, Vcan-depleted (LLC-EVVcanKD: Vcan+/−), and Vkine-rescued (LLC-VkineVcanKD: Vcan+/−) tumors (gating according to Figure S1F). In vitro experiments were performed in technical triplicates. In vivo cohort sizes are shown in individual panels. All experiments were reproduced independently at least twice.
Figure 2.
Figure 2.. The VCAN-matrikine versikine promotes cDC1 abundance in vivo
(A) Schematic of the experiment. LLC tumor cells were engineered to express hemagglutinin (HA)-tagged versikine (LLC-Vkine) or empty vector controls (LLC-EV) and injected subcutaneously (s.c.) on the flank or intravenously using a retro-orbital approach. (B) Gross morphology of orthotopic (top) and s.c. (bottom) LLC-EV and LLC-Vkine tumors. (C) Anti-HA tag western blotting detects a 75-kDa band in LLC-Vkine tumor lysates, consistent with versikine. See the full blot in Figure S2A. (D) Representative immunohistochemistry (IHC) images showing α-DPEAAE and HA tag staining of LLC-EV and LLC-Vkine tumors. Endogenous DPEAAE proteolysis is low level and similar between LLC-EV and LLC-Vkine. Anti-HA staining localizes in a membranous distribution in LLC-Vkine cells (inset, larger magnification). (E) Flow cytometric analysis of cDC subsets in s.c. LLC-EV and LLC-Vkine tumors (gating strategy according to Figure S1F) (Laoui et al., 2016) and quantification of cDC and tumor-associated DC (TADC) frequency (top) and absolute count ratios (cDC1/cDC1+cDC2 and cDC2/cDC1+cDC2) (bottom). (F) Comparison of immune contexture (CD45+ fraction) in LLC-EV versus LLC-Vkine tumors by 31-marker mass cytometry. (G) Flow cytometry analysis of cDC subsets in orthotopic LLC-EV and LLC-Vkine tumors (lung metastases induced by intravenous injection). A summary of cDC and TADC subset frequencies is depicted on the right. Data are presented as mean ± SEM and are from one of three independent experiments with n = 5 or 6 for each group. *p < 0.05, **p < 0.01, ***p < 0.001. In vitro experiments were performed in technical triplicates. In vivo cohort sizes are shown in individual panels. All experiments were reproduced independently at least twice.
Figure 3.
Figure 3.. Versikine selectively activates cDC1 in vivo
(A) RT-PCR analysis for cDC1 “signature” transcripts in bulk LLC-EV and LLC-Vkine tumor mRNA. Data are presented as mean ± SEM. (B) Summary of CD40 staining intensity (MFI, mean fluorescence intensity) in DC subsets from LLC-EV and LLC-Vkine tumors (experiment 1). A second, independent experiment (experiment 2) is depicted in Figure S3F. Examples of individual histogram plots for each DC subset are shown. (C) Summary of PD-L1 staining intensity in DC subsets from LLC-EV and LLC-Vkine tumors. Examples of individual histogram plots for each DC subset are shown. (D) Layout of the experiment to compare transcriptomic profiles in LLC-EV versus LLC-Vkine tumor immune infiltrates. (E) Hierarchical clustering of transcriptomic profiles by RNA sequencing (RNA-seq) analysis of CD45+ tumor-infiltrating leukocytes (TILs) extracted from LLC-EV versus LLC-Vkine tumors. (F) Volcano plot highlighting key differentially expressed genes in CD45+ TILs from LLC-Vkine tumors compared with LLC-EV tumors. Genes whose overexpression has been linked to APC activation are shown in red and genes whose overexpression has been linked to T cell activation in green. (G) Gene Ontology (GO) analysis of pathways enriched in CD45+ fractions from LLC-Vkine versus LLC-EV tumors. ns, non-significant; *p < 0.05; **p < 0.01; ***p < 0.001; ****p < 0.0001. Data are presented as mean ± SEM. In vitro experiments were performed in technical triplicates. In vivo cohort sizes are shown in individual panels. All experiments were reproduced independently at least twice.
Figure 4.
Figure 4.. cDC1 activation by versikine is cell autonomous
(A) Schematic layout of the experiment. MutuDC1940-EV or -Vkine cells were stimulated for 4 h with vehicle (PBS) or the TLR4 agonist lipopolysaccharide (LPS) (100 ng/mL) before RNA extraction. (B) Gross morphology of MutuDC1940 cells engineered to express versikine (Vkine) or empty vector (EV). Phase contrast, 100× magnification; scale bar, 220 μm. (C) Hierarchical clustering of MutuDC1940 transcriptomic profiles expressing EV or versikine (Vkine) and stimulated with the TLR4 agonist LPS or vehicle (PBS). (D) Volcano plot highlighting key differentially expressed genes in MutuDC1940-Vkine versus -EV cells (without LPS). (E) Gene set enrichment analysis (GSEA) of significantly upregulated (left and center) and downregulated (right) pathways in MutuDC1940-Vkine versus -EV cells (without LPS). (F) Ccl7 RT-PCR using LLC-EV and LLC-Vkine tumor bulk mRNA (left) and CD11c+ magnetically separated fraction mRNA (right). (G) Cxcl9 and Cxcl10 RT-PCR using CD11c+ magnetically separated fractions from LLC-EV or LLC-Vkine tumors. (H) Schematic of the antigen presentation experiment. (I) Flow cytometry for endogenous IFN-γ and IL-2 of OT-I CD8+ T cells co-cultured with SIINFEKL peptide-loaded MutuDC1940 cells, EV- or Vkine-expressing, with or without LPS. (J) Quantitation of OT-I flow cytometry analysis of the antigen presentation assay. (K) IFN-γ by ELISA in supernatants from OT-I and MutuDC1940:SIINFEKL co-cultures in the antigen presentation assay. Data are presented as mean ± SEM. *p < 0.05, **p < 0.01, ***p < 0.001, ****p < 0.0001. In vitro experiments were performed in technical triplicates. In vivo cohort sizes are shown in individual panels. All experiments were reproduced independently at least twice.
Figure 5.
Figure 5.. cDC1 accumulation requires innate lymphoid support
(A) RT-PCR for NK cell-activating cytokine transcripts expressed by ex vivo magnetically separated CD11c+ cells from LLC-EV and LLC-Vkine tumors. (B) RT-PCR profile of NKp46+ NK1.1+ cells flow-sorted from LLC-EV and LLC-Vkine tumors. Data are presented as mean ± SEM, n = 3 for each group. (C) Schematic of the NK cell depletion experiment. (D) Summary of cDC subset frequency by flow cytometric analysis in LLC-EV versus LLC-Vkine tumors after treatment with NK cell-depleting antibody (anti-ASGM1) or vehicle (PBS). (E) Csf2 (GM-CSF) RT-PCR of RNA extracted from NKp46+ NK1.1+ cells flow-sorted from LLC-EV and LLC-Vkine tumors growing in WT or Batf3−/− hosts. (F) Stromal localization of NCR1+ (NKp46+) cells in human lung cancers (chromogen, DAB; counterstain, hematoxylin). 40× objective: scale bar, 60 μm. (G) Annexin V/7-AAD apoptosis assay of MutuDC1940-EV or -Vkine dendritic cells exposed to graded staurosporine concentrations with or without murine GM-CSF. Data are presented as mean ± SEM. *p < 0.05, **p < 0.01, ***p < 0.001, ****p < 0.0001. In vitro experiments were performed in technical triplicates. In vivo cohort sizes are shown in individual panels. All experiments were reproduced independently at least twice.
Figure 6.
Figure 6.. Stroma-licensed cDC1s are “poised” and hypersensitive to nucleic acid sensing in vivo
(A) Schematic of the experiment. (B) Growth curves of LLC-EV and LLC-Vkine tumors challenged with a single subtherapeutic dose (200 μg) of intratumoral (IT) DMXAA (DMXAA200) or vehicle (NaHCO3) on day 0. (C) Kaplan-Meier survival curves for the experiment in (B); **p < 0.01 by log rank test. (D) Representative images showing development of hemorrhagic necrosis and a necrotic eschar in LLC-Vkine but not LLC-EV tumors 24 h after IT DMXAA200 administration. (E) Transcriptomic profile of LLC-EV and LLC-Vkine tumors harvested 2 h after IT DMXAA200 (Table S6). (F) Versikine -DMXAA synergy generates an abscopal effect in LLC tumors that produces a survival advantage. **p < 0.01 by log rank test. (G) Growth curves of treatment-side LLC-EV and LLC-Vkine tumors challenged with a single subtherapeutic dose (200 μg) of IT DMXAA (DMXAA200) or vehicle (NaHCO3) on day 0. (H) Growth curves of contralateral side unmanipulated LLC tumors; treated side as in (G). (I) Response to DMXAA200 is lost in Batf3−/− recipients. Shown are growth curves of LLC-EV and LLC-Vkine tumors challenged with a single subtherapeutic dose (200 μg) of IT DMXAA (DMXAA200) or vehicle (NaHCO3) on day 0 in Batf3−/− recipients. (J) Batf3 loss abrogates the survival advantage seen in the WT (C). (K) Efficacy of DMXAA200 in LLC-Vkine tumors implanted into Batf3−/− recipients is restored after adoptive transfer of iCD103 (Figures S6D and S6E). (L) Adoptive transfer of iCD103 in LLC-Vkine tumors implanted into Batf3−/− recipients restores the survival advantage of mice treated with DMXAA200. **p < 0.01 by log rank test. Data are presented as mean ± SEM. *p < 0.05, **p < 0.01, ***p < 0.001, ****p < 0.0001. In vitro experiments were performed in technical triplicates. In vivo cohort sizes are shown in individual panels. All experiments were reproduced independently at least twice.
Figure 7.
Figure 7.. Versikine promotes CD8+ responses and overcomes resistance to anti-PD1 inhibitors in vivo
(A) Schematic of the experiment. (B) Frequency of MHCI:SIINFEKL tetramer+CD8+ splenocytes in mice bearing LLC-EV versus LLC-Vkine tumors 5 days after challenge with a therapeutic dose of a STING agonist (DMXAA500). Data are presented as mean ± SEM. (C) Correlation between in vitro versikine signature and CD8+ T cell scores across TCGA human lung cancers. Significance was measured using a linear model while accounting for total immune infiltration. (D) DPEAAE staining in human lung cancers and associated CD8+ infiltration. 10× objective: scale bar, 50 μm. (E) Distribution of DPEAAE stromal staining intensity across lung cancer prognostic subgroups (pauci-immune [poor prognosis] and immune-rich [favorable prognosis] at cutoff 3 CD8+ TILs/HPF). p < 0.001 by two-tailed Mann-Whitney test. (F) Top: schematic of the experiment. Bottom: tumor growth rates and survival curves of LLC-EV and LLC-Vkine-bearing animals treated with 3 doses of anti-PD1 antibody or isotype control. *p < 0.05, **p < 0.01, ***p < 0.001, ****p < 0.0001. In vitro experiments were performed in technical triplicates. In vivo cohort sizes are shown in individual panels. All experiments were reproduced independently at least twice.

Similar articles

Cited by

References

    1. Balan S, Radford KJ, and Bhardwaj N (2020). Unexplored horizons of cDC1 in immunity and tolerance. Adv. Immunol 148, 49–91. - PubMed
    1. Barbie DA, Tamayo P, Boehm JS, Kim SY, Moody SE, Dunn IF, Schinzel AC, Sandy P, Meylan E, Scholl C, et al. (2009). Systematic RNA interference reveals that oncogenic KRAS-driven cancers require TBK1. Nature 462, 108–112. - PMC - PubMed
    1. Barry KC, Hsu J, Broz ML, Cueto FJ, Binnewies M, Combes AJ, Nelson AE, Loo K, Kumar R, Rosenblum MD, et al. (2018). A natural killer-dendritic cell axis defines checkpoint therapy-responsive tumor micro-environments. Nat. Med 24, 1178–1191. - PMC - PubMed
    1. Bell D, Chomarat P, Broyles D, Netto G, Harb GM, Lebecque S, Valladeau J, Davoust J, Palucka KA, and Banchereau J (1999). In breast carcinoma tissue, immature dendritic cells reside within the tumor, whereas mature dendritic cells are located in peritumoral areas. J. Exp. Med 190, 1417–1426. - PMC - PubMed
    1. Binnewies M, Roberts EW, Kersten K, Chan V, Fearon DF, Merad M, Coussens LM, Gabrilovich DI, Ostrand-Rosenberg S, Hedrick CC, et al. (2018). Understanding the tumor immune microenvironment (TIME) for effective therapy. Nat. Med 24, 541–550. - PMC - PubMed

Publication types